[How to Use Tellus from Scratch] Comparing regions of Shibuya and Sugamo using Mobile Spatial Statistics data
Mobile spatial statistics data has been added to the API available on Tellus. In this article, we will introduce and explain a simple case study.
Starting from May 7, 2020, Mobile Spatial Statistics has been added to the data available in the Tellus development environment. In this article, we will introduce a sample code using Mobile Spatial Statistics API and how to graph the acquired data.
Mobile Spatial Statistics is demographic information on different time periods of areas based on data from base stations accessed by DOCOMO mobile phones.
Currently, the following data can be found in the Tellus development environment:
===
■July 1, 2016 to September 30, 2017 (Tokyo 23 wards, Yokohama 18 wards, Osaka 24 wards, Nagoya 16 wards, Fukuoka 7 wards)
■April 1, 2016 to July 31, 2016 (all areas of Kumamoto Prefecture)
■June 28, 2018 to July 8, 2018 + 1 week before and after (Gifu, Kyoto, Hyogo, Okayama, Tottori, Hiroshima, Ehime, Kochi, Fukuoka, Saga and Nagasaki prefectures)
===
If you are interested, try an analysis of any area you choose. In the future, we would also like to introduce combined analysis using satellite data.
* See Tellusの開発環境でAPI引っ張ってみた (Use Tellus API from the development environment) for how to use environment development data (JupyterLab) on Tellus.
Try using various geospatial data on Tellus!
Want to try using satellite data? Try out Japan’s open and free to use data platform, “Tellus”!
You can register for Tellus right here
1. Run the Mobile Spatial Statistics API
First, run the following code to get Mobile Spatial Statistics API data.
import os, requests
TOKEN = "自分のトークン情報を記載してください"

def mobaku(params={}, next_url=''):
    if len(next_url) > 0:
        url = next_url
    else:
        url = 'https://pflow.tellusxdp.com/api/v1/mobaku'


    headers = {
        'Authorization': 'Bearer {}'.format(TOKEN)
    }

    r = requests.get(url, params=params, headers=headers)

    if not r.status_code == requests.codes.ok:

        r.raise_for_status()
    return r.json()

data = mobaku({})
print(data['count'])
print(data['next'])
print(data['items'][0:4])
Then, you’ll get the following response:
100
https://pflow.tellusxdp.com/api/v1/mobaku?cursor=eyJsYXN0X2l0ZW0iOnsiaWQiOjEwMCwiZGF0ZXRpbWUiOiIyMDE2LTAzLTMxVDE1OjAwOjAwWiIsIm1lc2giOiI0ODMwMjM2NDIifSwicXVlcnkiOnsibWVzaCI6IiIsImFmdGVyIjoiIiwiYmVmb3JlIjoiIiwibWluX2xhdCI6IiIsIm1heF9sYXQiOiIiLCJtaW5fbG9uIjoiIiwibWF4X2xvbiI6IiJ9fQ%3D%3D
[{'datetime': '2016-03-31T15:00:00+00:00', 'mesh': '482947592', 'lon': 129.99375, 'lat': 32.375, 'total': 180, 'male_15': 0, 'male_20': 0, 'male_30': 0, 'male_40': 16, 'male_50': 12, 'male_60': 32, 'male_70': 19, 'female_15': 0, 'female_20': 10, 'female_30': 10, 'female_40': 16, 'female_50': 14, 'female_60': 38, 'female_70': 13}, {'datetime': '2016-03-31T15:00:00+00:00', 'mesh': '482947594', 'lon': 129.99375, 'lat': 32.3791667, 'total': 29, 'male_15': 0, 'male_20': 0, 'male_30': 0, 'male_40': 0, 'male_50': 0, 'male_60': 14, 'male_70': 0, 'female_15': 0, 'female_20': 0, 'female_30': 0, 'female_40': 0, 'female_50': 0, 'female_60': 15, 'female_70': 0}, {'datetime': '2016-03-31T15:00:00+00:00', 'mesh': '483012984', 'lon': 130.35625, 'lat': 32.1625, 'total': 85, 'male_15': 0, 'male_20': 0, 'male_30': 0, 'male_40': 0, 'male_50': 17, 'male_60': 14, 'male_70': 10, 'female_15': 0, 'female_20': 0, 'female_30': 0, 'female_40': 10, 'female_50': 0, 'female_60': 22, 'female_70': 12}, {'datetime': '2016-03-31T15:00:00+00:00', 'mesh': '483015644', 'lon': 130.68125, 'lat': 32.1375, 'total': 10, 'male_15': 0, 'male_20': 0, 'male_30': 0, 'male_40': 0, 'male_50': 10, 'male_60': 0, 'male_70': 0, 'female_15': 0, 'female_20': 0, 'female_30': 0, 'female_40': 0, 'female_50': 0, 'female_60': 0, 'female_70': 0}]
In the response, you can see that you got 100 returned data (the API’s default maximum number of retrievals) and the details of the first 4 of them.
The “mesh” in the response indicates a regional mesh code, which is a code that identifies an area defined by Japanese Industrial Standards.
Reference: Website of Statistics Bureau of Japan: About regional mesh statistics
Also, as you can see from the responses such as male_15 and female_20, the demographic information is broken down by gender and age, with male_15 providing the number of males between 15 and 19 years old and female_20 providing the number of females between 20 and 29 years old.
2. Analyze the acquired data and examine regional differences
Now, we are going to actually use Mobile Spatial Statistics API to see demographic data by region. This time, we will use data from Shibuya and Sugamo and compare ages. Most people have the impression that there are many young people in Shibuya and many older people in Sugamo, so we would like to confirm this with actual data.
First, we will get the data of the area around Shibuya Station.
Run the API with the coordinates near Shibuya Station. The maximum number of retrievals (page_size) is 100 by default, but we will set it to 1,000, which is the maximum number possible.
# 渋谷駅付近(座標指定) 2017/5/1 12時から18時のデータを取得し、最初の1件を表示する
params = {
    'after' : '2017-05-01T12:00:00+00:00',
    'before' : '2017-05-01T18:00:00+00:00',
    'min_lon': 139.701355,
    'max_lon':  139.751355,
    'min_lat': 35.658220,
    'max_lat':  35.708220,
    'page_size': 1000
}
data = mobaku(params)
print(data['count'])
print(data['items'][0:1])
Then, you’ll get the following response:
672
[{'datetime': '2017-05-01T12:00:00+00:00', 'mesh': '533935962', 'lon': 139.70625, 'lat': 35.6583333, 'total': 5659, 'male_15': 106, 'male_20': 709, 'male_30': 998, 'male_40': 691, 'male_50': 387, 'male_60': 204, 'male_70': 104, 'female_15': 116, 'female_20': 648, 'female_30': 641, 'female_40': 454, 'female_50': 271, 'female_60': 189, 'female_70': 141}]
This time, we have specified the coordinates, but the API can also be set by specifying a regional mesh code (mesh).
Now we specify the value of mesh contained in the response to the API for the API request parameter and run it.
# 渋谷駅付近(地域メッシュコード指定) 2017/5/1 12時から18時のデータを取得し、最初の1件を表示する
data = mobaku({
    'after' : '2017-05-01T12:00:00+00:00',
    'before' : '2017-05-01T18:00:00+00:00',
    'mesh':533935962,
    'page_size': 1000
})
print(data['count'])
print(data['items'][0:1])
Then, you’ll get the following response:
7
[{'datetime': '2017-05-01T12:00:00+00:00', 'mesh': '533935962', 'lon': 139.70625, 'lat': 35.6583333, 'total': 5659, 'male_15': 106, 'male_20': 709, 'male_30': 998, 'male_40': 691, 'male_50': 387, 'male_60': 204, 'male_70': 104, 'female_15': 116, 'female_20': 648, 'female_30': 641, 'female_40': 454, 'female_50': 271, 'female_60': 189, 'female_70': 141}]
Using the same method, we can get the data for Sugamo.
# 巣鴨駅付近(座標指定) 2017/5/1 12時から18時のデータを取得し、最初の1件を表示する
params = {
    'after' : '2017-05-01T12:00:00+00:00',
    'before' : '2017-05-01T18:00:00+00:00',
    'min_lon': 139.739506,
    'max_lon':  139.789506,
    'min_lat': 35.733101,
    'max_lat':  35.783101,
    'page_size': 1000
}
data = mobaku(params)
print(data['count'])
print(data['items'][0:1])
Then, you’ll get the following response:
672
[{'datetime': '2017-05-01T12:00:00+00:00', 'mesh': '533945892', 'lon': 139.74375, 'lat': 35.7333333, 'total': 5110, 'male_15': 71, 'male_20': 346, 'male_30': 532, 'male_40': 501, 'male_50': 381, 'male_60': 441, 'male_70': 248, 'female_15': 72, 'female_20': 361, 'female_30': 502, 'female_40': 513, 'female_50': 372, 'female_60': 381, 'female_70': 389}]
Just like we did with Shibuya, we also run it by specifying a regional mesh code (mesh).
# 巣鴨駅付近(地域メッシュコード指定) 2017/5/1 12時から18時のデータを取得し、最初の1件を表示する
data = mobaku({
    'after' : '2017-05-01T12:00:00+00:00',
    'before' : '2017-05-01T18:00:00+00:00',
    'mesh':533945892,
    'page_size': 1000
})
print(data['count'])
print(data['items'][0:1])
Then, you’ll get the following response:
7
[{'datetime': '2017-05-01T12:00:00+00:00', 'mesh': '533945892', 'lon': 139.74375, 'lat': 35.7333333, 'total': 5110, 'male_15': 71, 'male_20': 346, 'male_30': 532, 'male_40': 501, 'male_50': 381, 'male_60': 441, 'male_70': 248, 'female_15': 72, 'female_20': 361, 'female_30': 502, 'female_40': 513, 'female_50': 372, 'female_60': 381, 'female_70': 389}]
As shown above, we could obtain data from two points by using the API.
Next, we are going to output the acquired data into a graph for comparison.
3. Graph the results obtained by the Mobile Spatial Statistics API
As explained above, the Mobile Spatial Statistics API allows us to retrieve data by gender and age.
To get a clearer picture of this data, we will create a graph comparing the ages of the data for Shibuya and Sugamo.
To graph the acquired data, we use pandas.
import pandas as pdWe take the data as of 12:00 p.m. in Shibuya and Sugamo and create a graph for each gender.
For the “mesh” value, we use the regional mesh code near each station obtained by running the API with the coordinates.
# 渋谷 2017/5/1 12:00
data = mobaku({
    'after' : '2017-05-01T12:00:00+00:00',
    'before' : '2017-05-01T12:00:00+00:00',
    'mesh':533935962,
    'page_size': 1000
})

df = pd.DataFrame(data['items'])

df_male = df.loc[:, df.columns.str.startswith('male')]
df_female = df.loc[:, df.columns.str.startswith('female')]

df_male.plot.bar()
df_female.plot.bar()
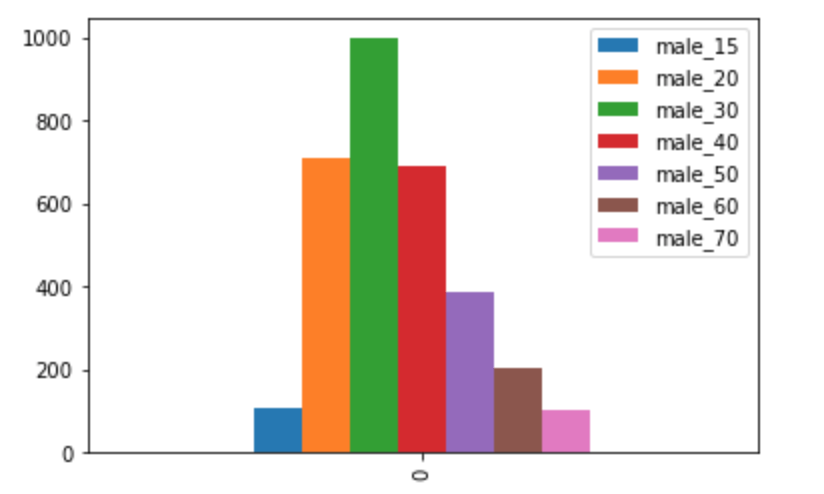
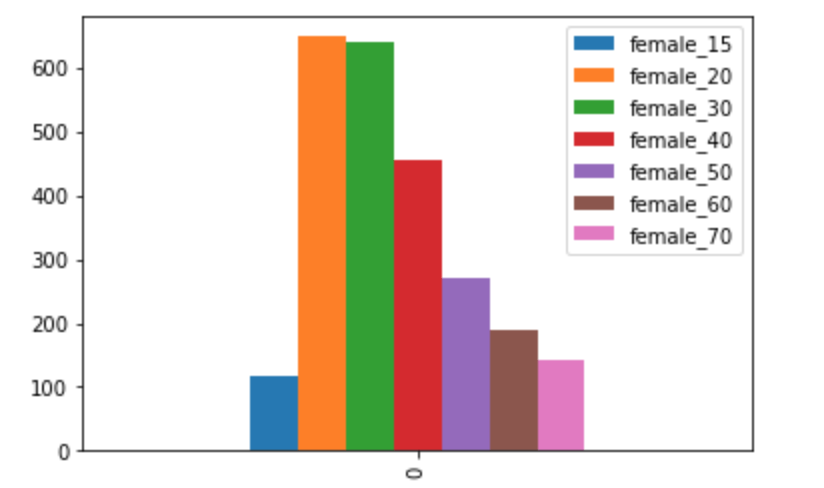
As a result, Shibuya had the highest number of males in their 30s and females in their 20s for the date and time of the data obtained.
Next, we take a look at Sugamo.
# 巣鴨
data = mobaku({
    'after' : '2017-05-01T12:00:00+00:00',
    'before' : '2017-05-01T12:00:00+00:00',
    'mesh':533945892,
    'page_size': 1000
})

df = pd.DataFrame(data['items'])

df_male = df.loc[:, df.columns.str.startswith('male')]
df_female = df.loc[:, df.columns.str.startswith('female')]

df_male.plot.bar()
df_female.plot.bar()
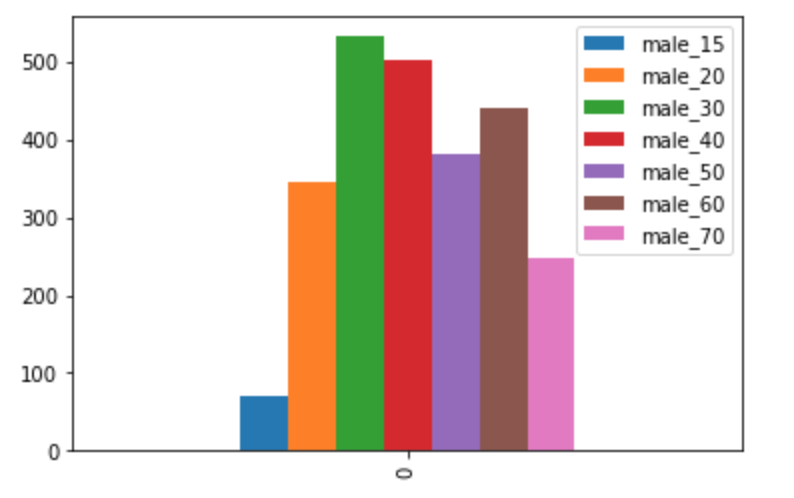
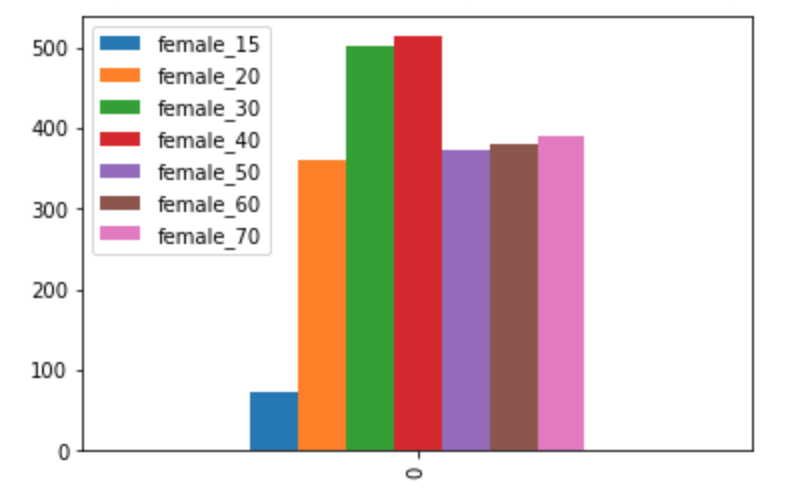
While the majority of people in Shibuya are in their 20s to 40s with few people in their 50s or older, in Sugamo, the majority are in their 50s to 70s.
In addition, Sugamo also features a higher number of women of people in their 70s.
4. Summary
In this article, we introduced a sample code using Mobile Spatial Statistics API and how to graph the acquired data.
Mobile Spatial Statistics API is useful when working with demographic information in terms of gender, age, region and time.
It may still be difficult to compare time categories due to the limited time period of available data, but it would be interesting to compare demographics of underdeveloped and overcrowded areas and investigate some kind of correlation with satellite data. Please take this opportunity to give it a go.
Try out Mobile Spatial Statistics data on "Tellus"!
Want to try using Mobile Spatial Statistics data? Try out Japan’s open and free to use data platform, “Tellus”! We also recommend analyzing it in combination with satellite data.
You can register for Tellus here