[How to Use Tellus from Scratch] How do you get an image larger than a map tile? Four tips on handling map tiles
We have shown you how to handle data on JupyterLab in the "Tellus from Scratch" posts. We often use the word "map tile" in these posts. Now, we'll tell you some useful techniques to deal with map tiles with JupyterLab on Tellus.
We’ve shown you how to handle data on JupyterLab on the satellite data platform Tellus in “Tellus from Scratch” posts.
We often use the word “map tile” in these posts. Now, we’ll tell you some useful techniques to deal with map tiles with JupyterLab on Tellus.
Let’s learn how to easily get the coordinates of a target location and how to write code to get a larger image, whilst running some sample codes.
Please refer to “API available in the developing environment of Tellus” for how to use Jupyter Lab (Jupyter Notebook) on Tellus.
1. What is a map tile?
A map tile is each piece of a Web Mercator map divided into 256 x 256-pixel squares. Each tile has its own zoom factor (z) and position (x,y). The zoom factor of the world map is 0. If the zoom factor is raised one level, the number of tiles increases by four times as each tile is divided into four parts.
A Web Mercator map represents a section in the Mercator projection world map — you might have seen it in social studies or geography textbooks. — from 180° east longitude to 180° west, and from 85.0511° north to 85.0511° south latitude. It is often used on online map services.
| Zoom factor | Number of tiles | Sample coordinates Tile coordinates (x,y) Latitude and longitude of the top left corner of the tile |
| 0 | 1 | (0, 0) => (-180, 85.0511) |
| 1 | 4 | (0, 1) => (-180, 0) (1, 0) => (0, 85.0511) (1, 1) => (0, 0) |
| 2 | 16 | (0, 1) => (-180, 66.5133) (0, 2) => (-180, 0) (0, 3) => (-180, -66.5133) (2, 1) => (0, 66.5133) |
2. Get tile coordinates using latitude and longitude
Tellus offers satellite data mostly as map tiles.
Example: the API to get a Landsat-8 optical image
https://gisapi.tellusxdp.com/api/v1/landsat8/{z}/{x}/{y}.png
Tile coordinates are specified in the path of the API.
However, when you need an image of a location, you often don’t know the tile coordinates of the place even if you know the longitude and latitude.
You can check them with map tile tools etc., but it is a bother and time consuming to do every time, right?
We’ll show you a sample Python code to calculate tile coordinates from latitude and longitude.
import math

def get_tail_num(lat, lon, zoom):
    """
    緯度経度からタイル座標を取得する
    Parameters
    ----------
    lat : number
        タイル座標を取得したい地点の緯度(deg)
    lon : number
        タイル座標を取得したい地点の経度(deg)
    zoom : int
        タイルのズーム率
    Returns
    -------
    xtile : int
        タイルのX座標
    ytile : int
        タイルのY座標
    """
    # https://wiki.openstreetmap.org/wiki/Slippy_map_tilenames#Python
    lat_rad = math.radians(lat)
    n = 2.0 ** zoom
    xtile = int((lon + 180.0) / 360.0 * n)
    ytile = int((1.0 - math.log(math.tan(lat_rad) + (1 / math.cos(lat_rad))) / math.pi) / 2.0 * n)
    return (xtile, ytile)
*A sample snippet published by OpneStreetMap is used in the code.
This method, when given latitude / longitude (lon, lat) and zoom ratio (zoom) as arguments, returns the coordinates of the map tile containing that point.
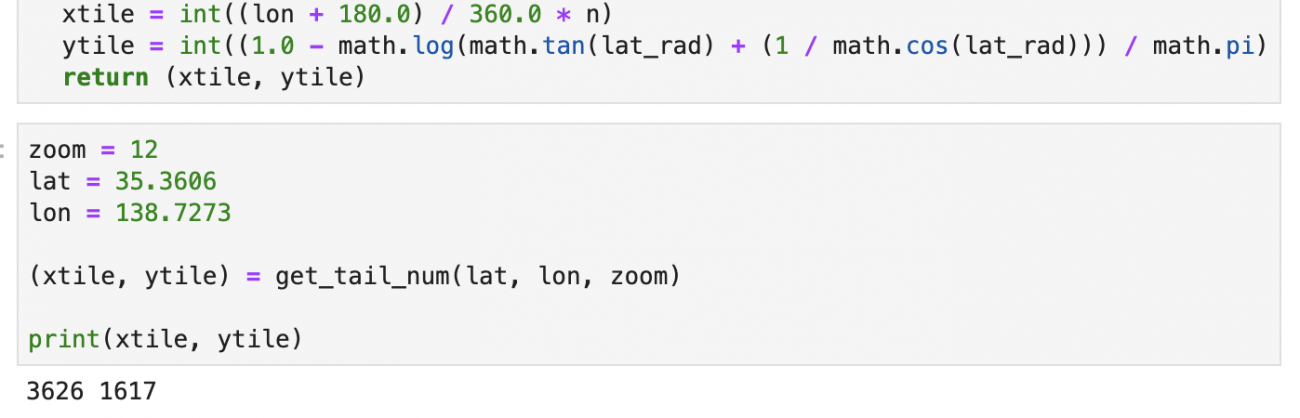
In this example, this function is used to find the coordinates of the tile that contains the summit of Mount Fuji (latitude: 35.3606°, longitude: 138.7273°) with a zoom factor of 12 (x,y) = (3626,1617)).
3. Get latitude and longitude using tile coordinates
On the contrary, when you process data using map tiles, you might need the latitude and longitude of an image.
We’ll again show you a sample Python code to calculate latitudes and longitudes from tile coordinates.
import math

def get_tile_bbox(z, x, y):
    """
    タイル座標からバウンディングボックスを取得する
    https://tools.ietf.org/html/rfc7946#section-5
    Parameters
    ----------
    z : int
        タイルのズーム率
    x : int
        タイルのX座標
    y : int
        タイルのY座標
    Returns
    -------
    bbox: tuple of number
        タイルのバウンディングボックス
        (左下経度, 左下緯度, 右上経度, 右上緯度)
    """
    def num2deg(xtile, ytile, zoom):
        # https://wiki.openstreetmap.org/wiki/Slippy_map_tilenames#Python
        n = 2.0 ** zoom
        lon_deg = xtile / n * 360.0 - 180.0
        lat_rad = math.atan(math.sinh(math.pi * (1 - 2 * ytile / n)))
        lat_deg = math.degrees(lat_rad)
        return (lon_deg, lat_deg)

    right_top = num2deg(x + 1, y, z)
    left_bottom = num2deg(x, y + 1, z)
    return (left_bottom[0], left_bottom[1], right_top[0], right_top[1])
*A sample snippet published by OpneStreetMap is used in the code.
This function takes tile coordinates (z, x, y) as its argument and returns the latitudes and longitudes of the bottom left and top right corner of the tile.
XXXXX and calculates?
The return value is in the bounding box format (which contains bottom left longitude, bottom left latitude, top right longitude and top right latitude in that order). Bounding boxes are used for many things such as GeoJSON.
You can know the latitudes and longitudes of the top left and bottom right corner as well as the data from the bounding box.
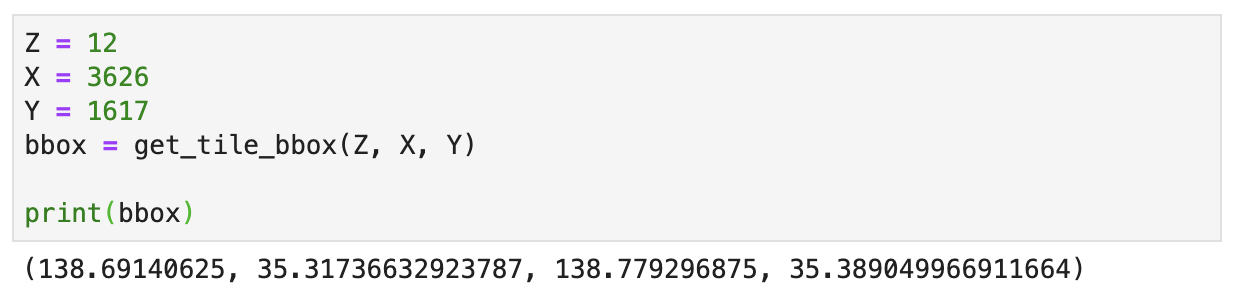
In this example, this function is used to find the bounding box (bottom left: 138.6914°, 35.3174°; top right: 138.7793°, 35.3890°) of the tile that contains Mt. Fuji’s summit (z=12, x=3626, y=1617).
4. Get the latitude and longitude of each pixel in a tile
You can get the latitudes and longitudes of the four corners of a tile using the get_tile_bbox function as shown above.
Then, how can you find the latitude and longitude of each pixel within a tile?
An easy option is to divide latitudinal and longitudinal lengths between the corners by 256.
import numpy as np

def get_tile_approximate_lonlats(z, x, y):
    """
    タイルの各ピクセルの左上隅の経度緯度を取得する(簡易版)
    Parameters
    ----------
    z : int
        タイルのズーム率
    x : int
        タイルのX座標
    y : int
        タイルのY座標
    Returns
    -------
    lonlats: ndarray
        タイルの各ピクセルの経度緯度
        256*256*2のnumpy配列
        経度、緯度の順
    """
    bbox = get_tile_bbox(z, x, y)
    width = abs(bbox[2] - bbox[0])
    height = abs(bbox[3] - bbox[1])
    width_per_px = width/256
    height_per_px = height/256

    lonlats = np.zeros((256,256,2))
    lat = bbox[3]
    for i in range(256):
        lon = bbox[0]
        for j in range(256):
            lonlats[i,j,:] = [lon, lat]
            lon += width_per_px
        lat -= height_per_px
    return lonlats
*get_tile_bbox function is used in the code.
This method, given tile coordinates (z, x, y) as an argument, calculates the latitude and longitude of the upper left corner of each pixel of the image and returns it as a 256 * 256 * 2 array. Actually using this method, the coordinates of each pixel of the tile image (z = 12, x = 3626, y = 1617) including the summit of Mt. Fuji are as follows.
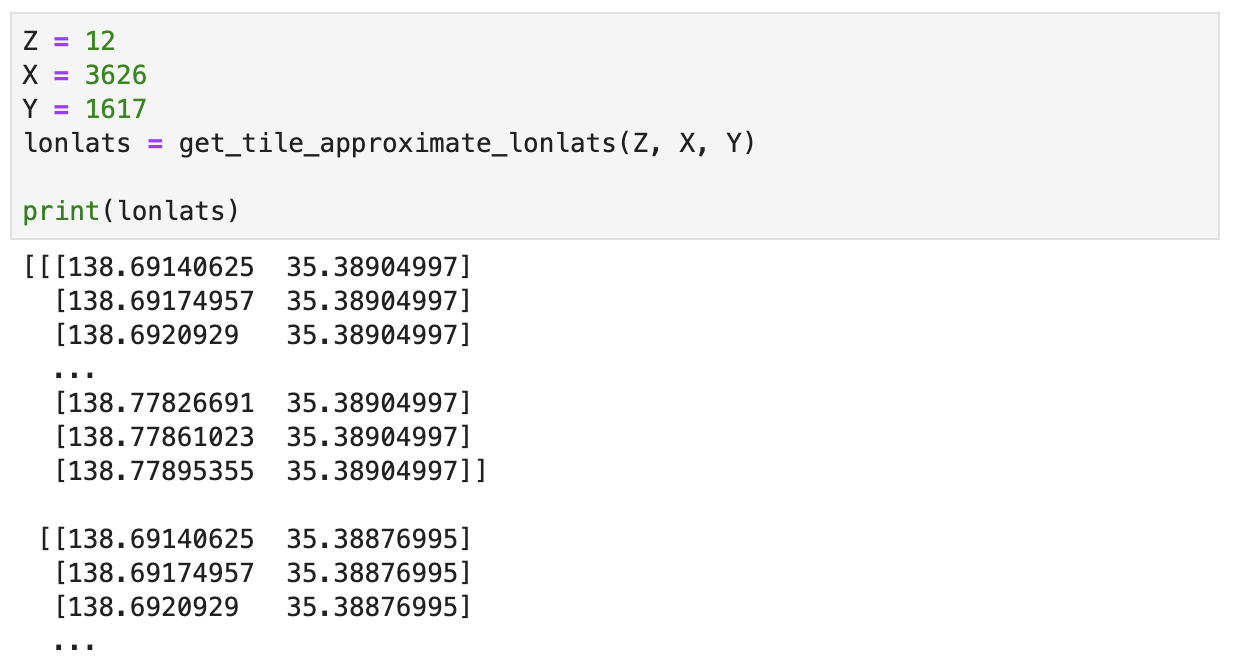
Note that longitude and latitude are returned in this order, as shown in “lonlats[0, 0] = [138.69140625 35.38904997]”.
However, the return value is just an approximation. Because map tiles use the Mercator projection, the latitude changes at slightly different rates through different pixels even in the same tile (the higher the latitude is, the less it changes per pixel). For this reason, dividing the longitudinal length of a tile by 256 doesn’t give you the exact coordinates.
The difference in change rate is very small, so you don’t have to worry when you make a casual calculation. However, you need accurate coordinates for some analyses. Then, give this sample code a try.
import numpy as np

def get_tile_lonlats(zoom, xtile, ytile):
    """
    タイルの各ピクセルの左上隅の経度緯度を取得する
    Parameters
    ----------
    z : int
        タイルのズーム率
    x : int
        タイルのX座標
    y : int
        タイルのY座標
    Returns
    -------
    lonlats: ndarray
        タイルの各ピクセルの経度緯度
        256*256*2のnumpy配列
        経度、緯度の順
    """
    x = int(xtile * 2**8)
    y = int(ytile * 2**8)
    z = zoom + 8

    lonlats = np.zeros((256,256,2))
    for i in range(256):
        for j in range(256):
            bbox = get_tile_bbox(z, x + j, y + i)
            lonlats[i,j,:] = [bbox[0], bbox[3]]
    return lonlats
*get_tile_bbox function is used in the code.
This function takes tile coordinates (z, x, y) as its argument (data) and will calculate the latitude and longitude of the pixels more accurately on a Mercator map in the form of a three-dimensional arrangement of size 256 x 256 x 2.
5. Combine tiles into a larger image
The size of a map tile is fixed at 256 x 256 pixels.
This is not always convenient. The area it covers is often too small to make a detailed analysis.
If you zoom out from the map, you can cover a larger area, but this lowers resolution; this is pointless if what you need to see is obscured.
We’ve prepared a sample code for you that combines multiple tiles into an image so you can cover a larger area without lowering resolution.
import numpy as np

def get_combined_image(get_image_func, z, topleft_x, topleft_y, size_x=1, size_y=1, option={}, params={}):
    """
    結合されたタイル画像を取得する
    Parameters
    ----------
    get_image_func : function
        タイル画像取得メソッド
        引数はz, x, y, option, params
    z : int
        タイルのズーム率
    topleft_x : int
        左上のタイルのX座標
    topleft_y : int
        左上のタイルのY座標
    size_x : int
         タイルを経度方向につなぎわせる枚数
    size_y : int
        タイルを緯度方向につなぎわせる枚数
    option : dict
        APIパスのオプション(z,x,y除く)
    params : dict
        クエリパラメータ
    Returns
    -------
    combined_image: ndarray
        結合されたタイル画像
    """
    rows = []
    blank = np.zeros((256, 256, 4), dtype=np.uint8)

    for y in range(size_y):
        row = []
        for x in range(size_x):
            try:
                img = get_image_func(z, topleft_x + x, topleft_y + y, option, params)
            except Exception as e:
                img = blank

            row.append(img)
        rows.append(np.hstack(row))
    return  np.vstack(rows)
Once you give functions such as to get image using API (get image func), the coordinates of the starting tile (z, topleft x, topleft y), a number of tiles to combine (size x, size y), the parameters to pass to API (option, params), you will be able to get the image of combined tiles.
For the function that fetches an image using an API, you need to write different functions for different APIs.
For example, below is a function to obtain an ASNARO-1 image using the API.
import requests
from skimage import io
from io import BytesIO
%matplotlib inline

TOKEN = 'ここには自分のアカウントのトークンを貼り付ける'

def get_asnaro1_image(z, x, y, option, params={}):
    """
    ASNARO-1のタイル画像を取得する
    Parameters
    ----------
    z : int
        タイルのズーム率
    x : int
        タイルのX座標
    y : int
        タイルのY座標
    option : dict
        APIパスのオプション(entityId)
    params : dict
        クエリパラメータ
    Returns
    -------
    img: ndarray
        タイル画像
    """
    url = 'https://gisapi.tellusxdp.com/ASNARO-1/{}/{}/{}/{}.png'.format(option['entityId'], z, x, y)
    headers = {
        'Authorization': 'Bearer ' + TOKEN
    }
    r = requests.get(url, headers=headers, params=params)
    if not r.status_code == requests.codes.ok:
        r.raise_for_status()
    return io.imread(BytesIO(r.content))
Let’s use this function to get an image larger than 256 x 256 pixels.
option = {
    'entityId': '20181226061336632_AS1'
}
z = 14
x = 13979
y  = 6340
combined = get_combined_image(get_asnaro1_image, z, x, y, 3, 2, option)

io.imshow(combined)
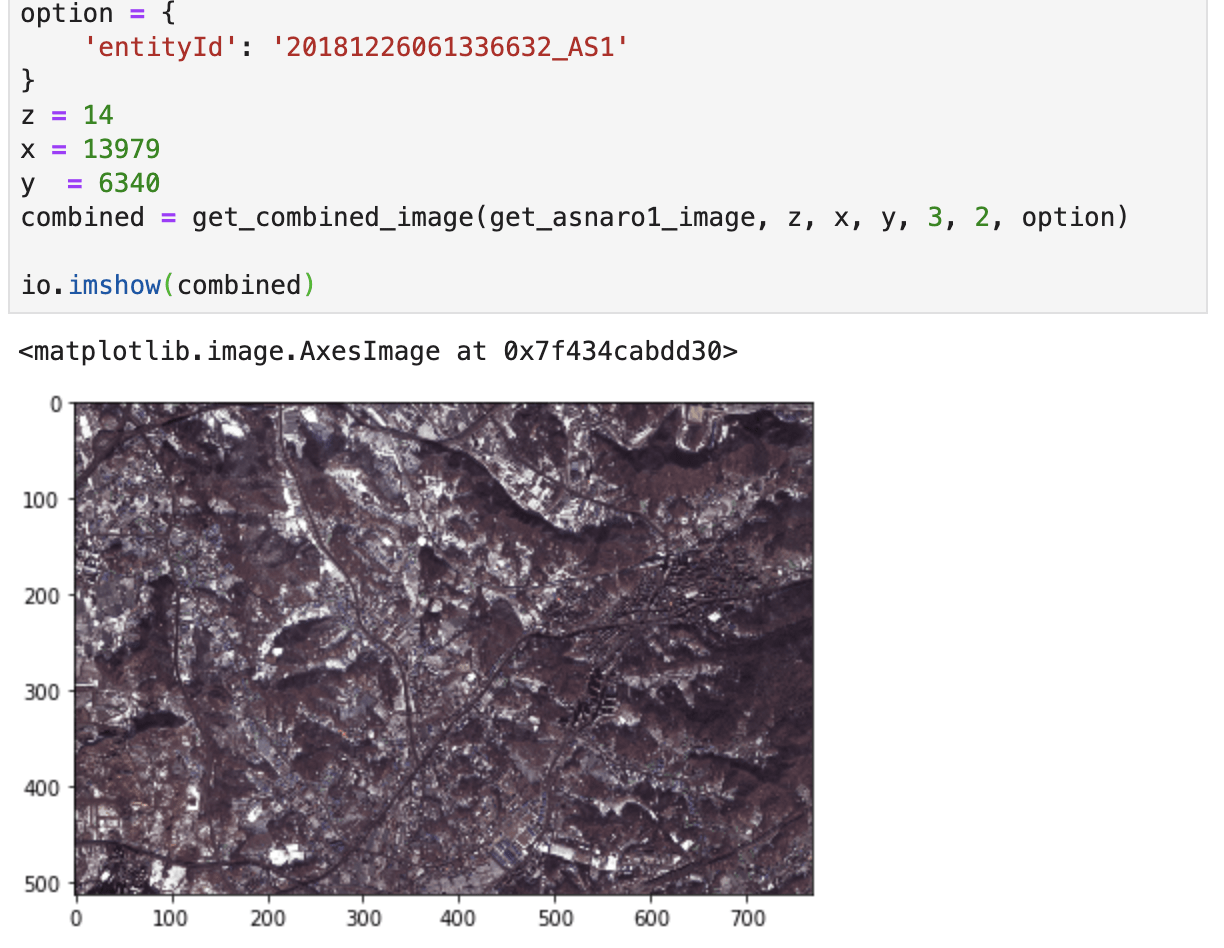
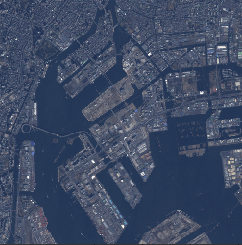
In this sample code, the adjacent six tiles in the scene entity Id = 20181226061336632_AS1 are in two rows and three columns with the tile z = 14, x = 13979, y = 6340 as the starting position, and are combined into a 768 x 512-pixel image.
You can also get images other than ASNARO-1 in the same way.
Below is a function to get a Palsar-2 image using the API.
def get_palsar2_image(z, x, y, option, params={}):
    """
    Palsar-2のタイル画像を取得する
    Parameters
    ----------
    z : int
        タイルのズーム率
    x : int
        タイルのX座標
    y : int
        タイルのY座標
    option : dict
        APIパスのオプション(entityId)
    params : dict
        クエリパラメータ
    Returns
    -------
    img: ndarray
        タイル画像
    """
    url = 'https://gisapi.tellusxdp.com/PALSAR-2/{}/{}/{}/{}.png'.format(option['entityId'], z, x, y)
    headers = {
        'Authorization': 'Bearer ' + TOKEN
    }
    r = requests.get(url, headers=headers, params=params)
    if not r.status_code == requests.codes.ok:
        r.raise_for_status()
    return io.imread(BytesIO(r.content))
Let’s us now use this function to get a vertical rectangular satellite image.
option = {
    'entityId': 'ALOS2017871020'
}
z = 12
x = 2055
y  = 1367
io.imshow(get_palsar2_image(z, x, y, option))
combined = get_combined_image(get_palsar2_image, z, x, y, 2, 3, option)

io.imshow(combined)
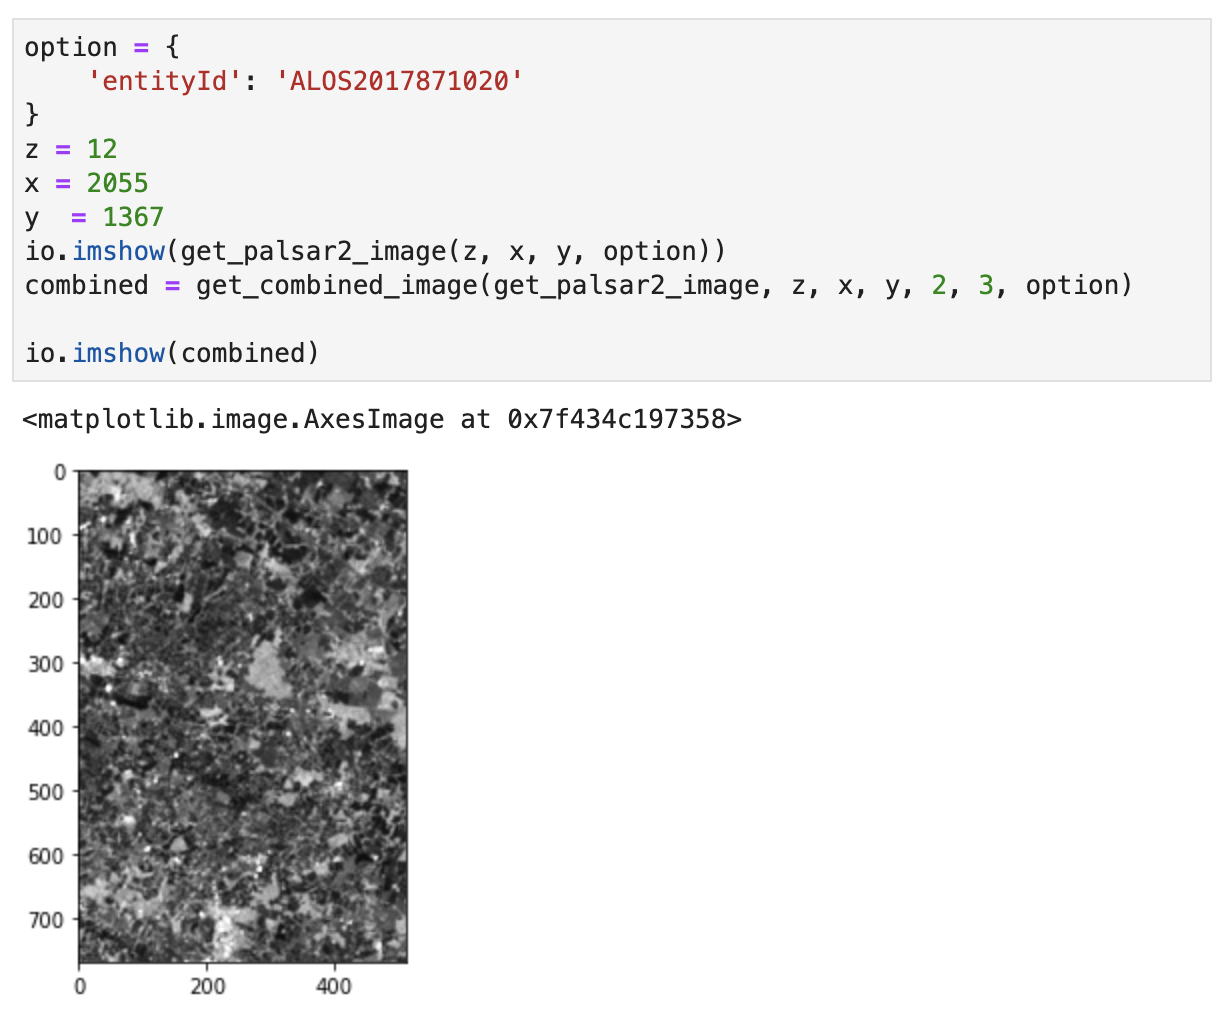
In the sample, the adjacent six tiles in the scene entityId = ALOS2017871020 are in three rows and two columns with the tile z = 12, x = 2055, y = 1367 as the starting position, and are combined into a 512 x 768-pixel image.
Now, you’ve learned some useful techniques to handle map tiles on Jupyter Lab on Tellus.
They are all quite basic technique as they rely on the library as little as possible.
If you have any helpful ideas or examples for map tile handling, please let the SORABATAKE editorial department know. We always welcome any of your suggestion.
