Basics of Geographic Information Systems (GIS) – Capabilities, Applications, GIS Data, Software-
We have compiled the basic essentials needed when using GIS (Geographic Information Systems), including what it can do, application examples, and software.
(1)What is GIS (Geographic Information System)?
GIS stands for Geographic Information System.
In the book “Geographic Information: Basics and Applications,” GIS is defined as “a series of systems that involve collecting, acquiring, building, managing, searching, analyzing, integrating, displaying, and informing about spatial data on a computer.”
In simpler terms, GIS is a system that allows us to view and analyze data with location information.
One familiar example of GIS is Google Maps, where we can view the location and operating hours of restaurants, search for routes, and check traffic information.
History of GIS
Origin of GIS "CGIS" and "Father of GIS" Tomlinson
The origin of GIS is said to be CGIS (Canada Geographic Information), developed by Roger Tomlinson in Canada during the 1960s.
CGIS was developed as a system to manage Canada’s land and resources, storing large amounts of land use data on computers to assist in land reclamation and exploration for development suitability.
The concepts and technologies developed in CGIS formed the foundation of modern GIS, earning Tomlinson the title “Father of GIS.”
From System to Science: Evolution of GIS
In the early stages, GIS, exemplified by CGIS, was primarily developed for practical purposes in administration. However, in the 1980s, GIS began to be recognized as an academic research subject.
In 1987, the “International Journal of Geographic Information Systems” was published, and in the United States, the National Center for Geographic Information and Analytics (NCGIA) was established in 1988 at the University of California, Santa Barbara, leading to the evolution of GIS from a system to a science.
Development of GIS in Japan Triggered by the Great Hanshin-Awaji Earthquake
The development of GIS in Japan is said to have been triggered by the Great Hanshin-Awaji Earthquake in 1995.
At the time of the earthquake, university research institutes and academic societies conducted surveys of building collapses and other damage as volunteer activities, providing them as spatial databases on GIS.
The Geospatial Information Authority of Japan also expanded its observation network using GPS-based Control Stations , conducted emergency aerial photography, and created damage situation maps.
(2)What can be done with GIS - Visualization, Overlay, Analysis
The basic functions of GIS involve visualizing information on a map and overlaying multiple layers of data. By visualizing and overlaying data, various analyses can be performed.
Visualization of Information on a Map
One of the fundamental capabilities of GIS is displaying information on a map.
While data presented in a tabular format can be difficult to interpret, visualizing it on a map allows for a better understanding by incorporating geographical elements.
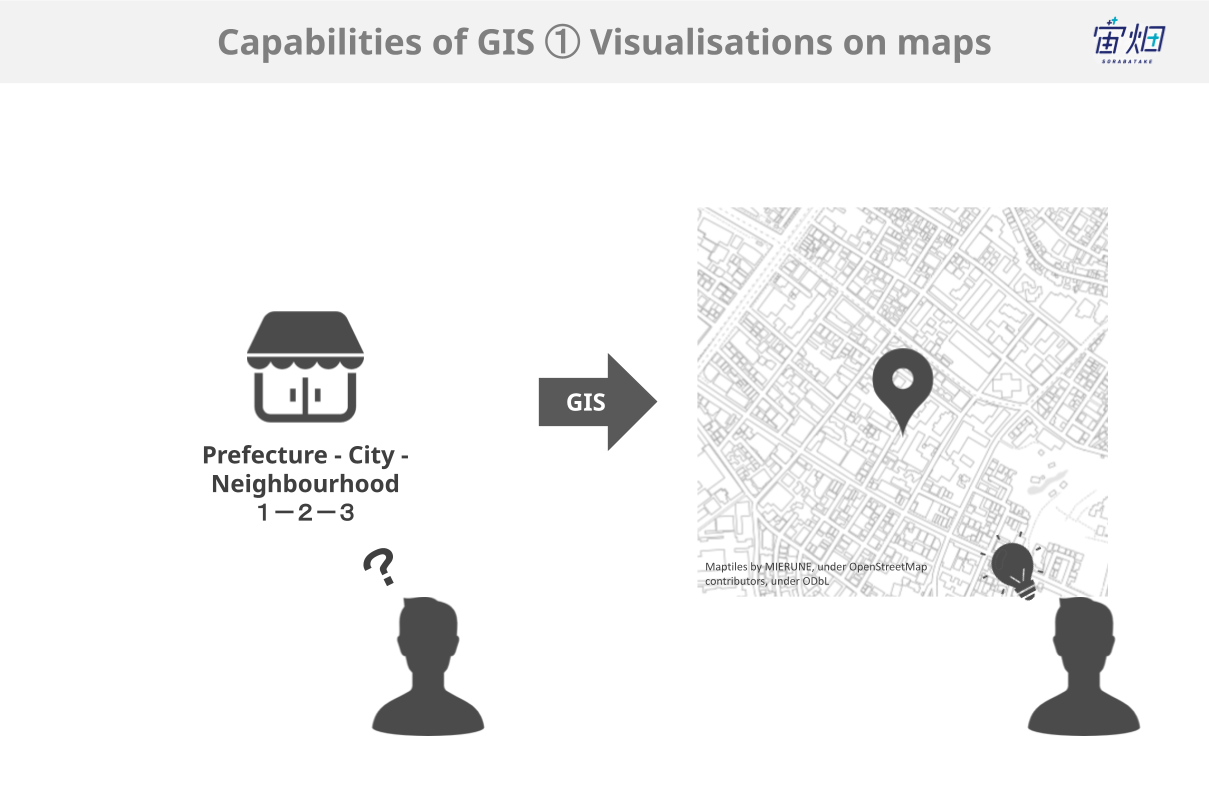
For example, when trying to find the location of a convenience store, it can be challenging to comprehend its whereabouts just by looking at the address alone. By displaying it on a GIS map, the location becomes easier to understand.
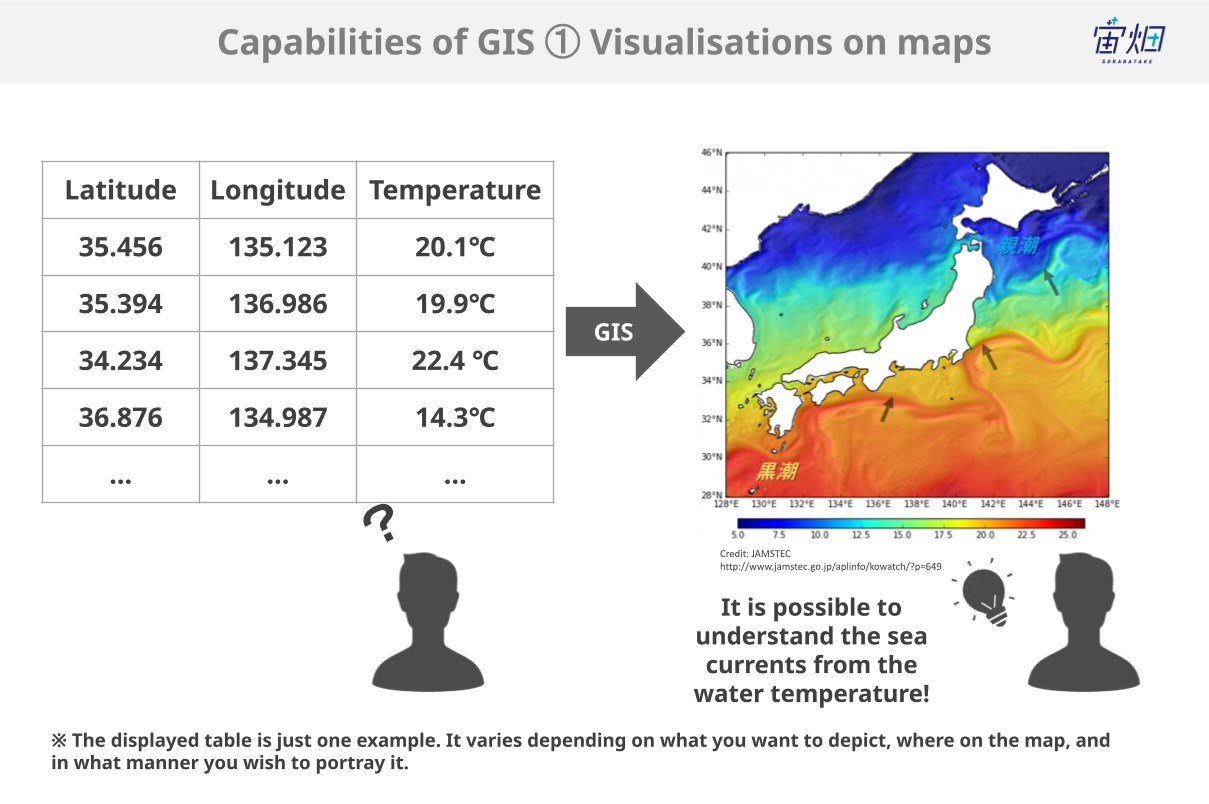
Furthermore, data that covers the Earth’s surface, such as temperature or elevation, can be easily grasped when displayed spatially.
For instance, when visualizing sea surface temperatures, knowing only the temperature data at specific points provides limited information. However, when displayed on a GIS map, the surrounding temperature distribution can be observed, enabling inferences about ocean currents or fish populations.
Overlaying Multiple Layers of Information on a Map
In GIS, multiple datasets can be overlaid based on their spatial coordinates.
By combining unrelated sets of information on a map, deeper insights can be obtained.
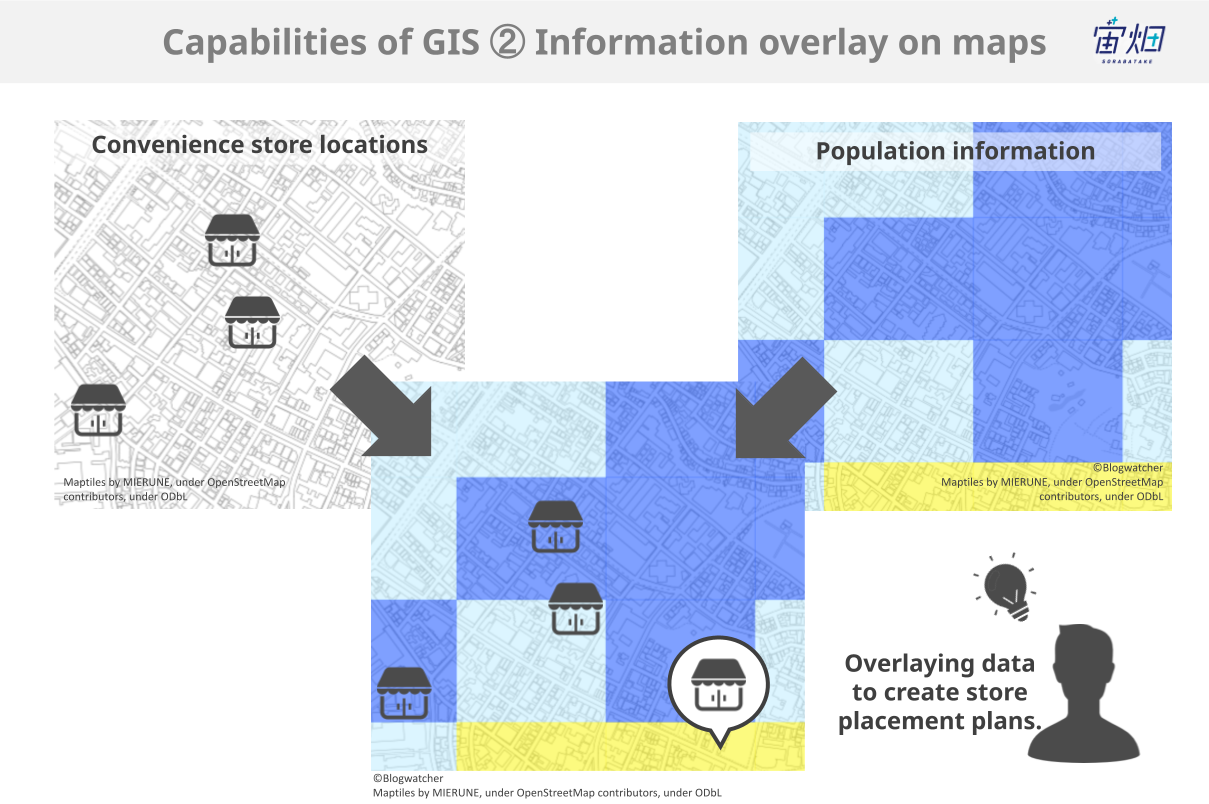
For example, overlaying the location data of convenience stores with population information can visualize the number of convenience stores per capita, which can be helpful for planning new store openings.
AI’s use of big data can predict the demand for cabs in the next 30 minutes!
https://sorabatake.jp/6015/
Analysis of Information on a Map
As mentioned earlier, by displaying data on a map, various insights can be obtained.
While visualization alone can provide valuable information, here are some commonly used analytical techniques:
Creating Areas from Line and Polygon Features: "Buffer Analysis"
Buffer analysis is a method used to create areas based on linear features such as roads or polygon features such as parks.
In GIS, a region within a specific distance from an object is referred to as a “buffer.”
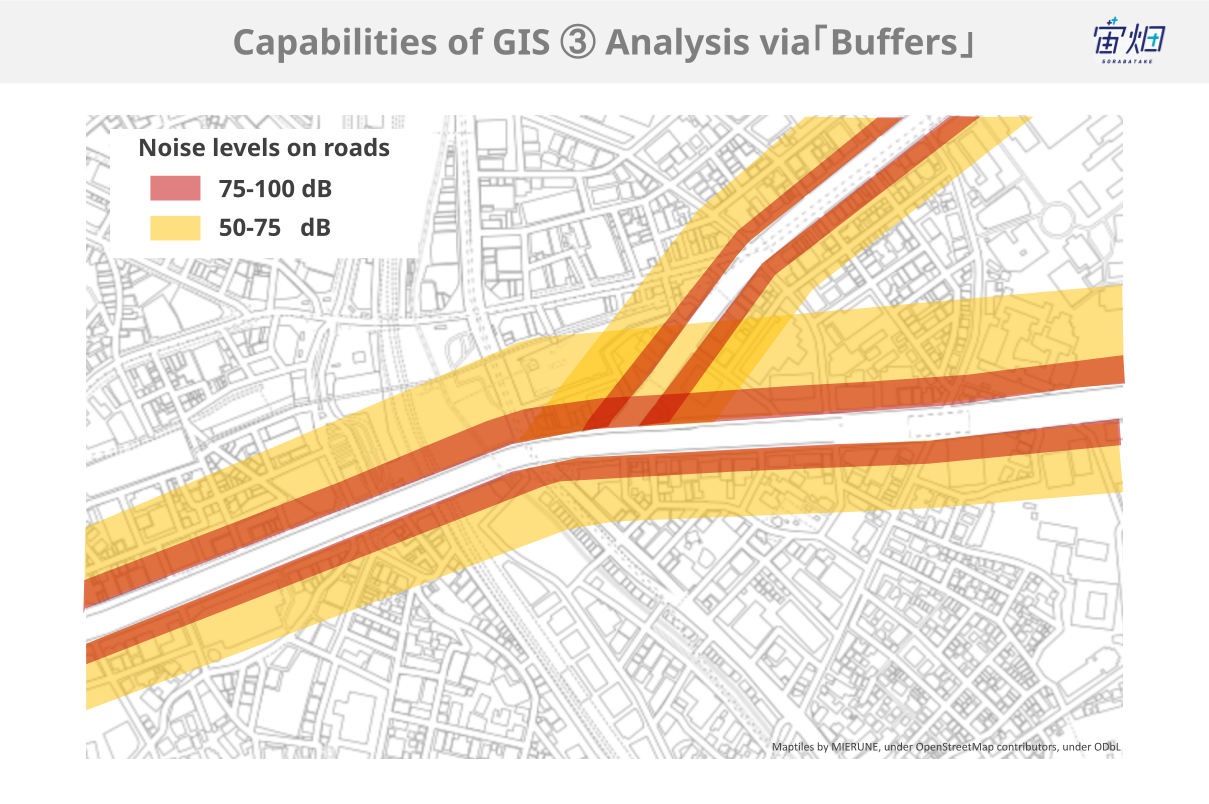
For example, when analyzing noise areas around roads, regions are created based on the distance from the road.
https://club.informatix.co.jp/?p=1171
Dividing Areas based on Point Features: "Voronoi Diagram"
The Voronoi diagram is a technique used to analyze phenomena influenced by distance.
It can be useful for local governments to determine the placement of elementary schools or evacuation centers or for private companies to plan the opening of convenience stores or supermarkets.
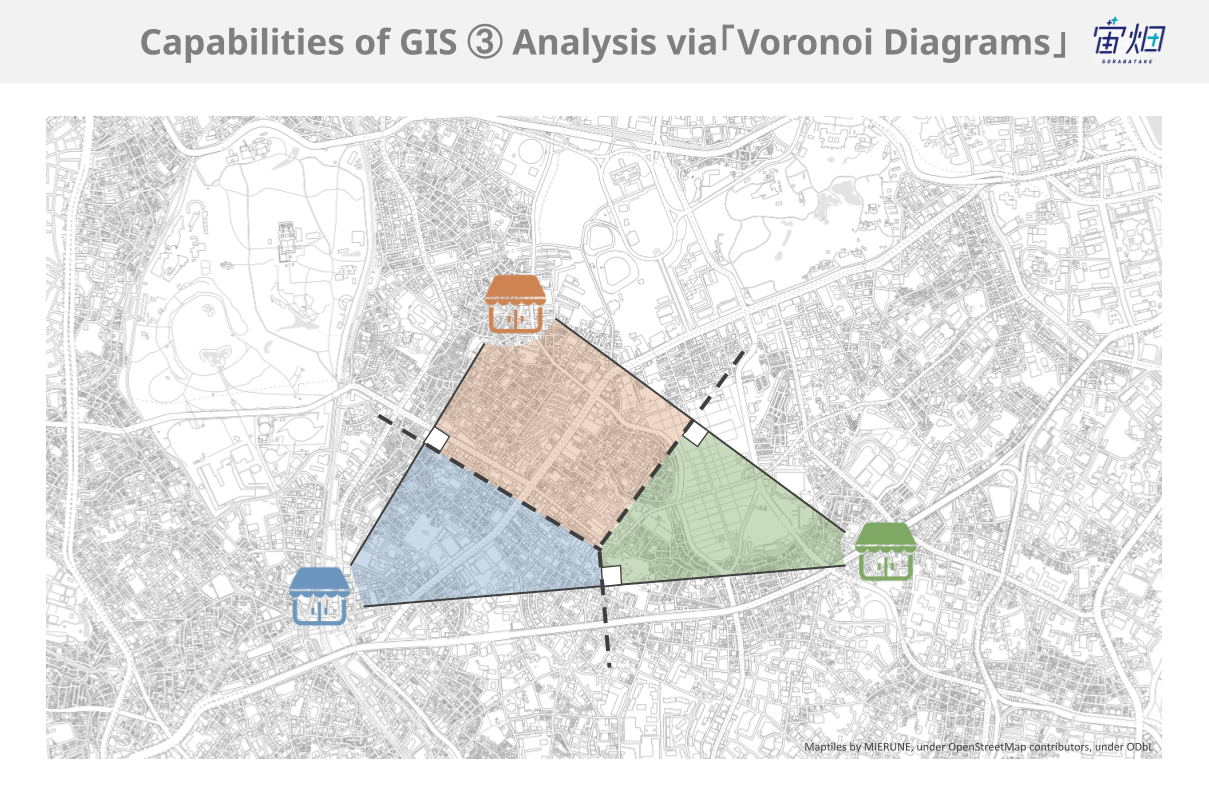
The method is straightforward: multiple facilities are connected by straight lines, and the perpendicular bisectors of these lines divide the area.
In practice, different weights can be assigned for each facility based on factors like capacity, resulting in weighted analysis.
https://www.mlit.go.jp/kokudoseisaku/gis/gis/webguide/giswg_solsht/319/#sol-fld-title%201269
Visualizing Regions with Higher Event Occurrence: "Kernel Density Estimation"
Kernel Density Estimation (KDE) is used to estimate the likelihood of event occurrence in different areas based on plotted points on a map.
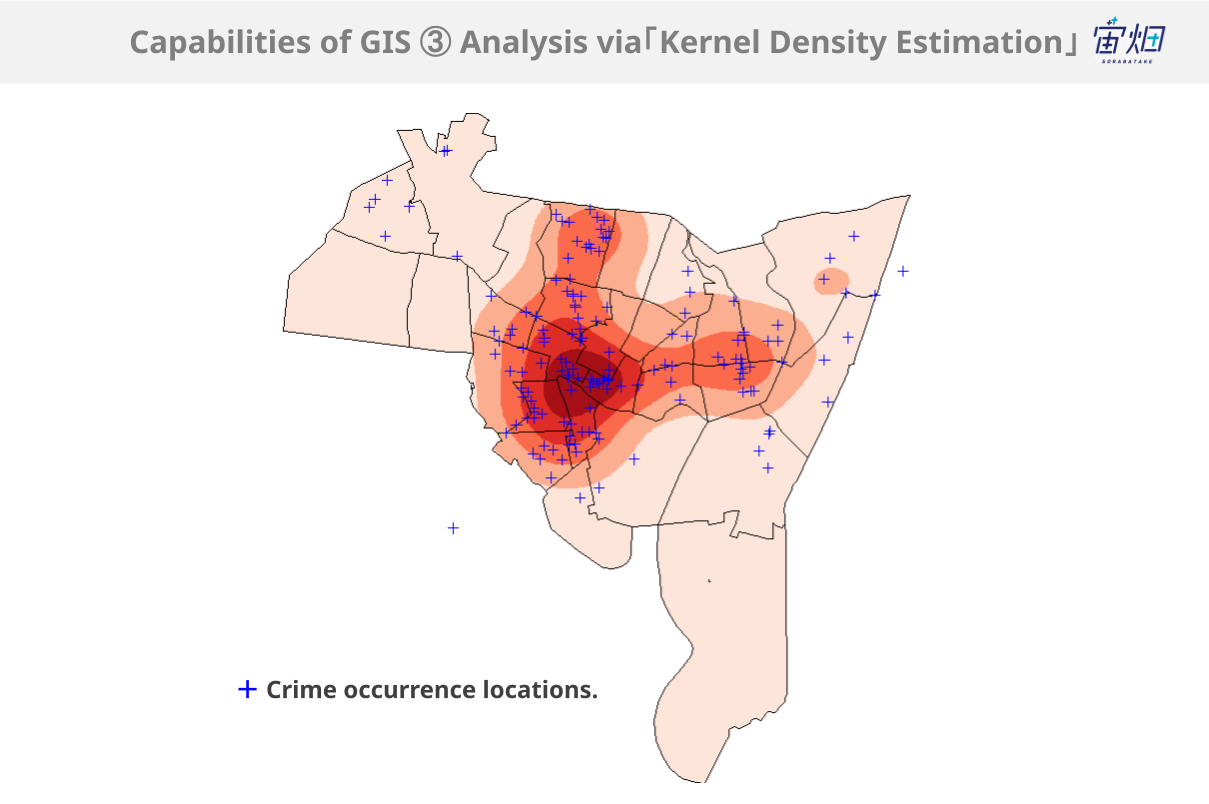
For example, by plotting crime locations on a map and conducting kernel density estimation, it is possible to estimate areas where crimes are more likely to occur.
In the field of epidemiology, it is used to create maps of disease spread based on the distribution of infected individuals.
KDE is a statistical method that estimates the overall distribution based on a limited sample (in this case, the crime occurrence points).
For a more detailed understanding, please make use of a statistics book.
https://www.mlit.go.jp/kokudoseisaku/gis/gis/webguide/giswg_solsht/319/#sol-fld-title%201272
https://club.informatix.co.jp/?p=1176
Finding Shortest Routes or Optimal Travel Paths: "Network Analysis"
Network analysis, a familiar technique used in GPS navigation systems or route planners like Google Maps, is widely used in our daily lives.
This analysis utilizes graph theory, a branch of mathematics that studies systems composed of nodes (points) and links (lines connecting points).
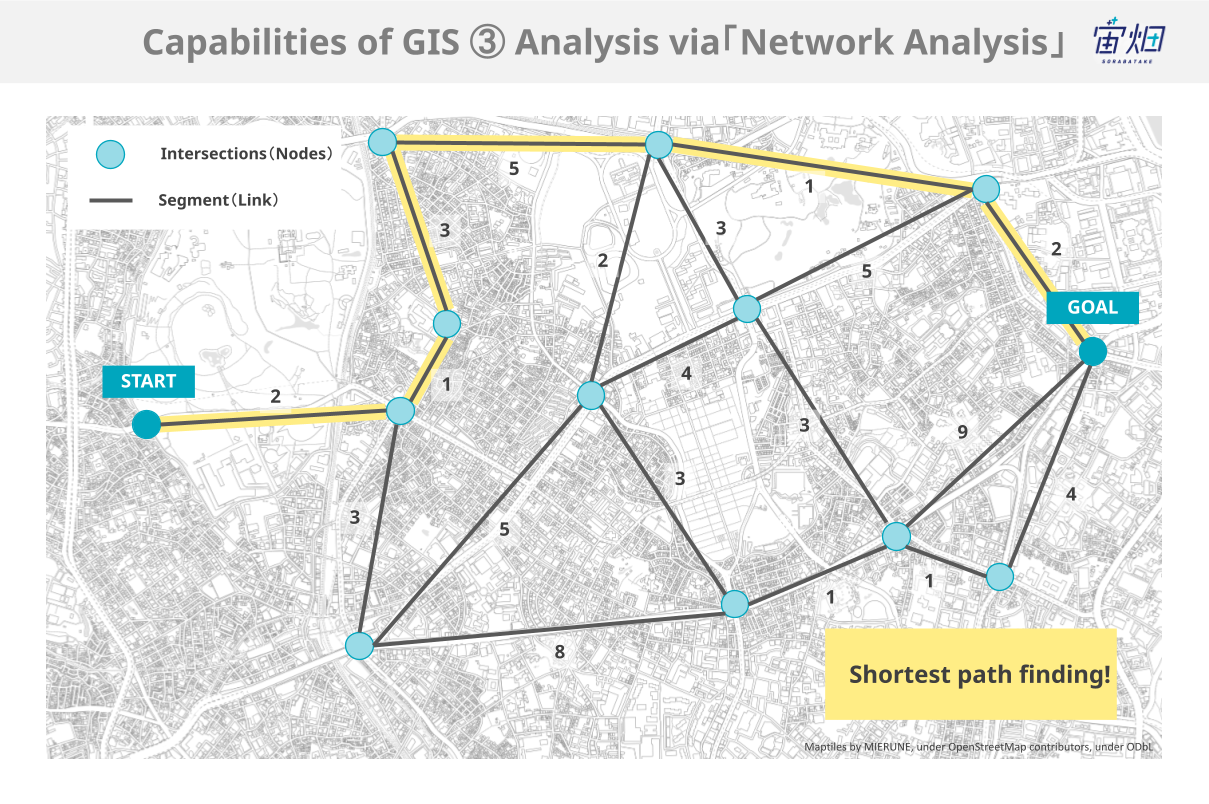
In GIS, intersections serve as nodes, and the road segments between them serve as links. Distance or congestion values can be associated with these segments, enabling tasks such as finding the shortest route.
https://www.mlit.go.jp/kokudoseisaku/gis/gis/webguide/giswg_solsht/319/#sol-fld-title%201272
https://www.esrij.com/gis-guide/spatial/network-analysis/
Replicating Landscapes in 3D: "3D Visualization"
By combining elevation data with information about features on the ground, such as forests, fields, or residential areas, GIS can recreate the view from a specific point in a specific direction.
For example, it can be used to assess how a large-scale housing development would appear from the surrounding area.
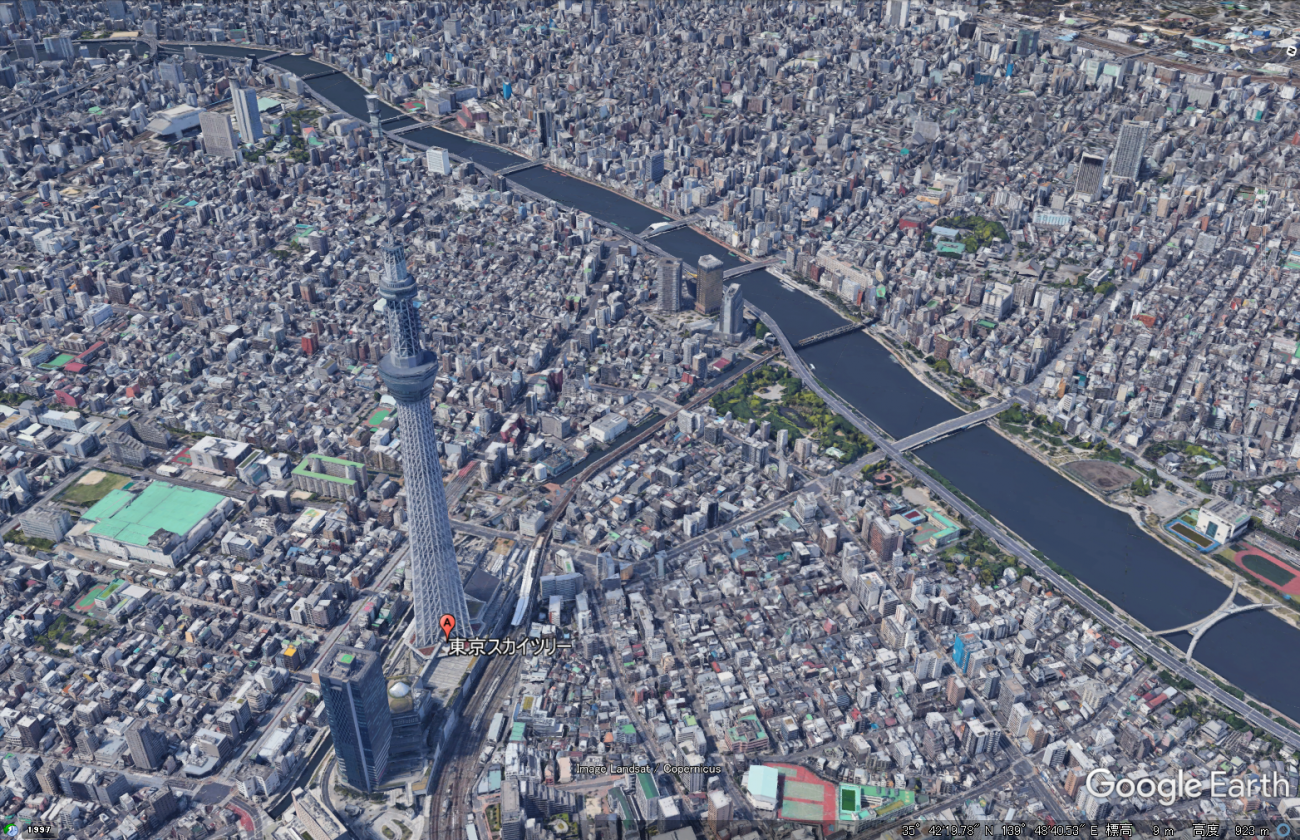
Google Earth allows you to see the city in three dimensions.
(3) GIS Data (Geospatial Information)
So far, we have introduced what can be done with GIS. To perform these tasks, GIS data, also known as geospatial data, needs to be incorporated into GIS.
Definition of GIS Data (Geospatial Data)
According to the Geospatial Information Authority of Japan (GSI), geospatial data refers to the following:
Geospatial information refers to information that indicates the location of specific points or areas on the earth's surface (location information), information related to various events associated with the location information, or information consisting only of location information.
The terms used were rather difficult, but in essence, it refers to data with location information.
For more details, please refer to the following article by Sora Batake (in Japanese):
Things to Know About Geospatial Data Before Working with It
Introduction to GIS Data
Since GIS data consists of information with associated location coordinates, there is a wide variety of GIS data available.
In this article, we will introduce some representative GIS data sources.
Ministry of Land, Infrastructure, Transport and Tourism GIS Website (Kokudo Suuchi Joho)
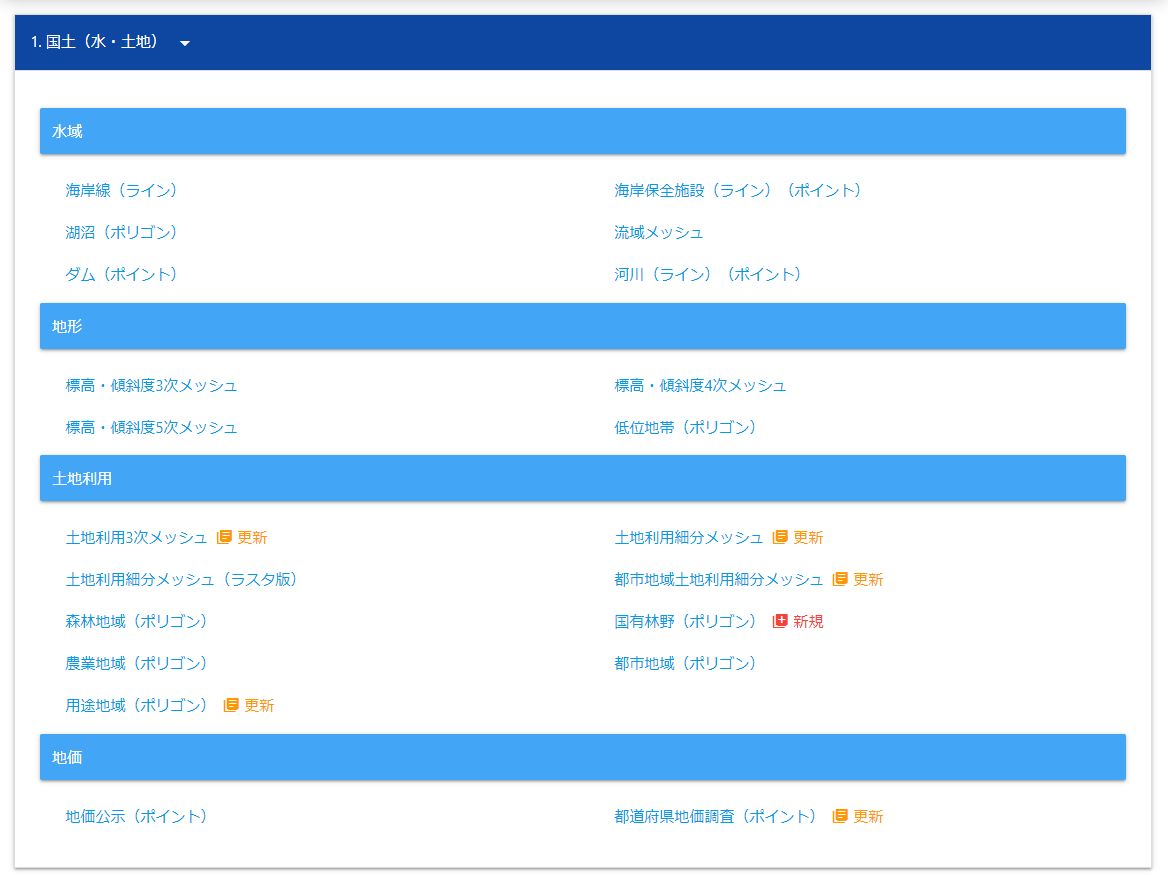
As the name suggests, this website provides GIS data published by the Ministry of Land, Infrastructure, Transport and Tourism (MLIT).
Basic information about the country, such as river networks and elevation, as well as regional information about schools and world heritage sites, and transportation-related information like railway and bus stops can be obtained from this site.
Regional Economy Analysis System (RESAS)

RESAS (Regional Economy Analysis System) is provided by the Ministry of Economy, Trade and Industry and the Cabinet Office (Secretariat of the Headquarters for Creating Dynamism through Regulation Reform).
While RESAS itself is a GIS, it also provides data through APIs. As the name implies, RESAS focuses on regional economic and industry-related data, providing numerous datasets for each region.
Statistical GIS (jSTAT MAP)
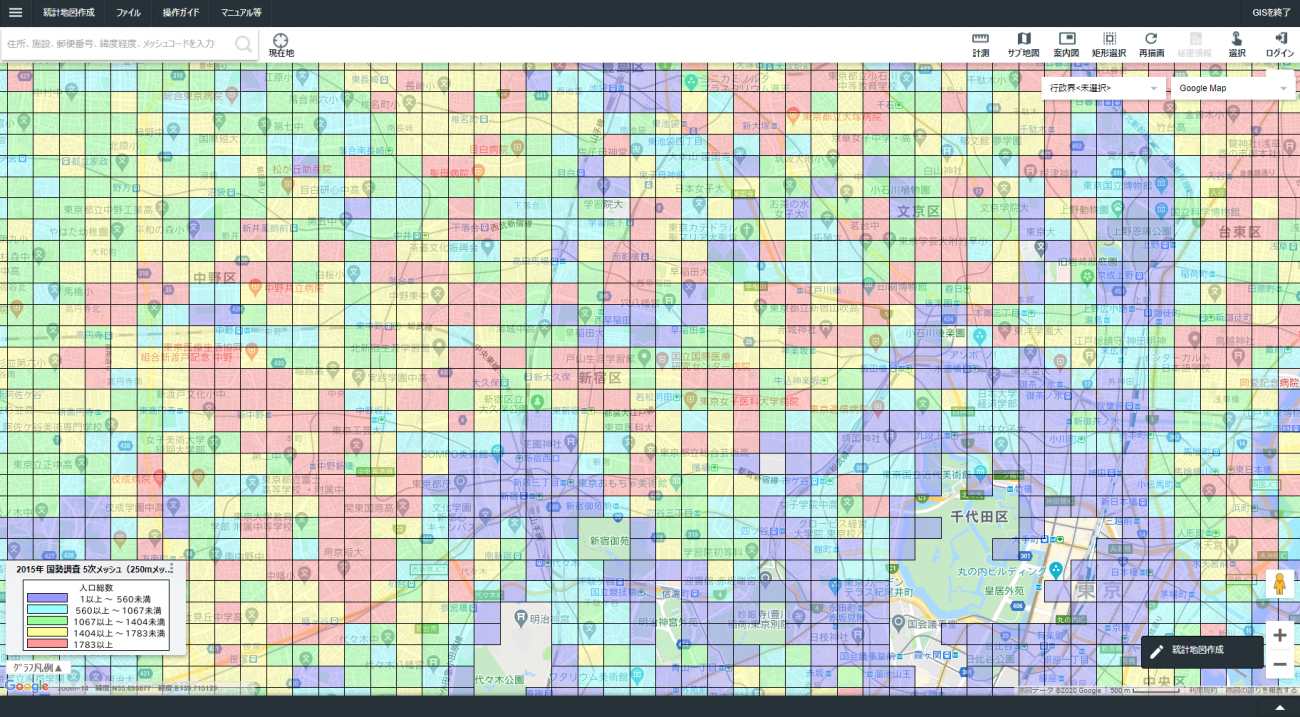
Statistical GIS (jSTAT MAP) is a user-friendly web-based geographic information system. It allows users to visualize statistical results at the prefectural, municipal, small-area, and regional mesh levels.
In addition to visualization, it offers the following features for regional analysis:
1.Analyzing user-imported data
2.Calculating statistics for specified areas
3.Generating regional analysis reports
Geospatial Information Center (G-Spatial)
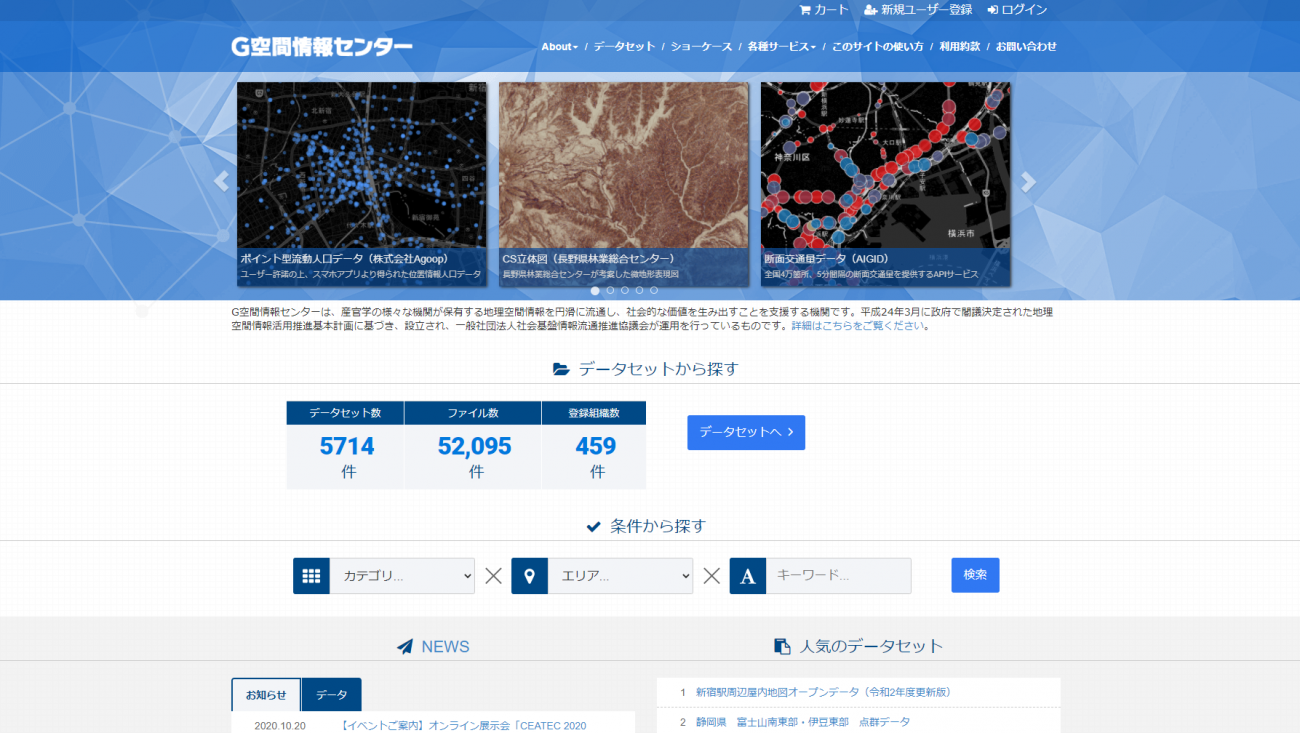
G-Spatial is a platform for promoting the effective use and distribution of geospatial information. It also supports the back-end needs of actors aiming to solve societal challenges.
In addition to free data, G-Spatial includes paid GIS data from private companies, such as mobile population data and road traffic volume data.
Satellite Data Platform Tellus
Tellus, which serves as the official media for Sorabatake, offers satellite data as one type of GIS data.
Tellus provides free access to satellite data owned by the Japan Aerospace Exploration Agency (JAXA) and the Ministry of Economy, Trade and Industry (METI).
(4) Examples of Business Applications of GIS
There are already numerous examples of GIS being used in various business fields. For industry-specific examples, we recommend visiting the case study website of Esri Japan for more detailed information.
In this article, we will provide examples of how GIS is utilized in different business areas, categorized by analysis methods.
Visualization
Simply representing numerical data on a map can greatly enhance understanding, which is commonly used in media such as television and newspapers.
COVID-19 Infection Status
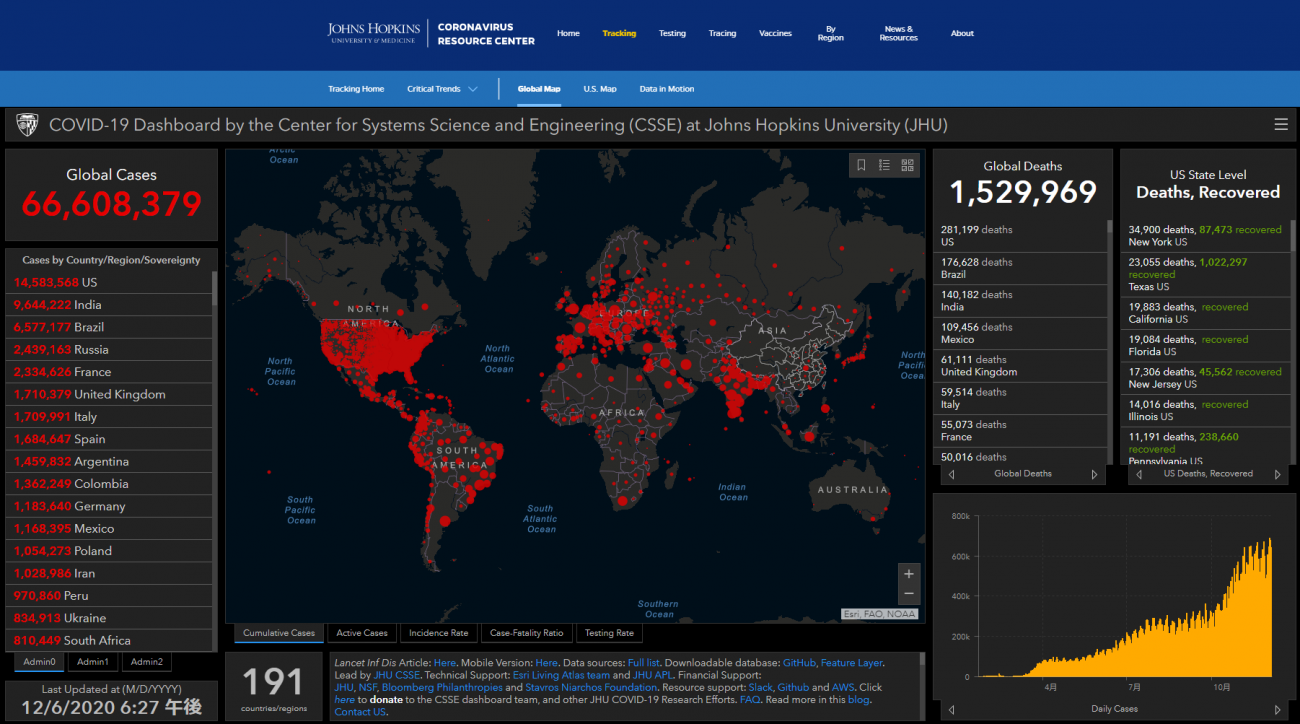
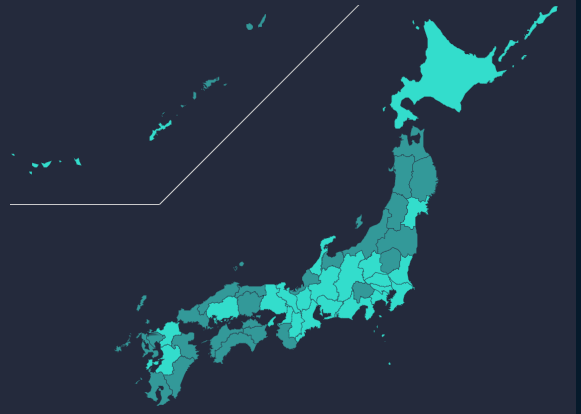
In 2020, the global impact of the COVID-19 pandemic led to the use of maps by academic institutions and news agencies to visualize the infection status.
By using maps to represent the data, it becomes easier to see which regions are experiencing a high number of infections.
Trade Area Analysis
Combining multiple datasets to identify locations where a company’s products or services are likely to sell well is a common practice.
AI Taxi
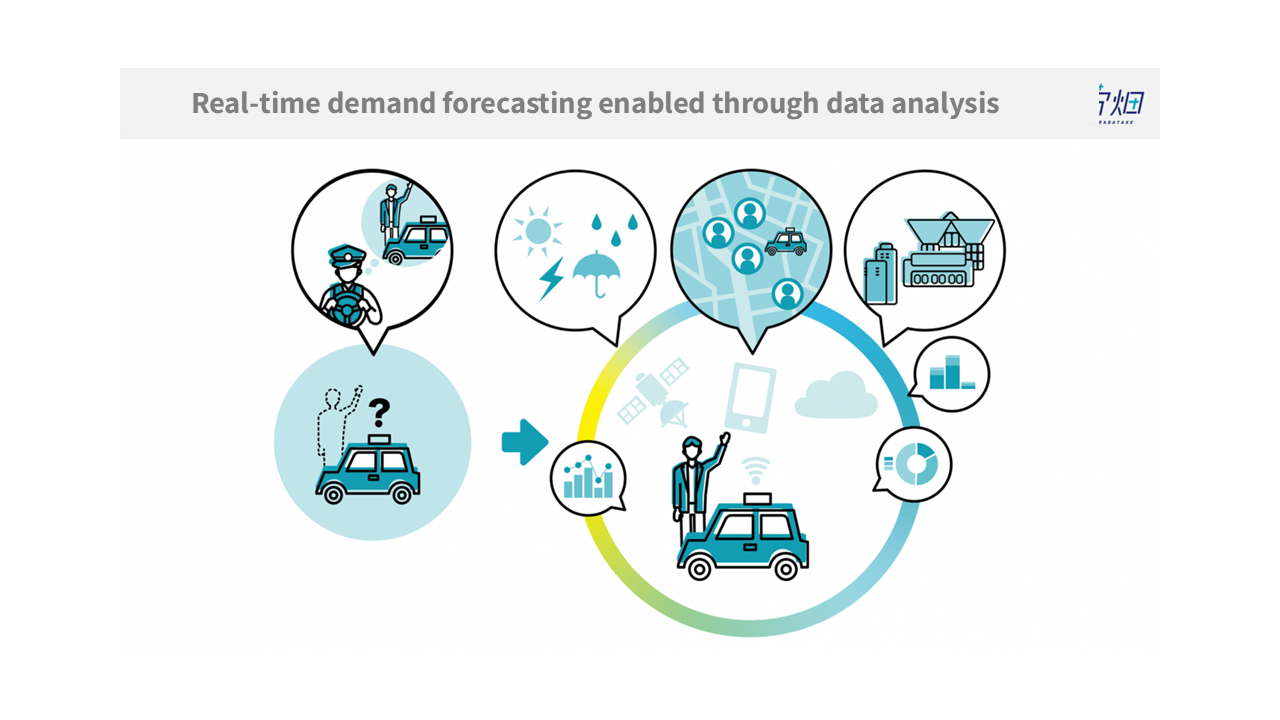
NTT Docomo, whom we previously interviewed at Sorabatake, has developed an “AI Taxi” service that predicts and dispatches taxis to locations where demand is expected to increase based on factors such as weather, crowd density, and events.
Predicting Taxi Demand 30 Minutes Ahead Using Big Data and AI!
https://sorabatake.jp/6015/
Site Selection
Analyzing and identifying land that meets multiple criteria is another common application in the business world.
Fruit Site Selection "Tenchi-Jin"
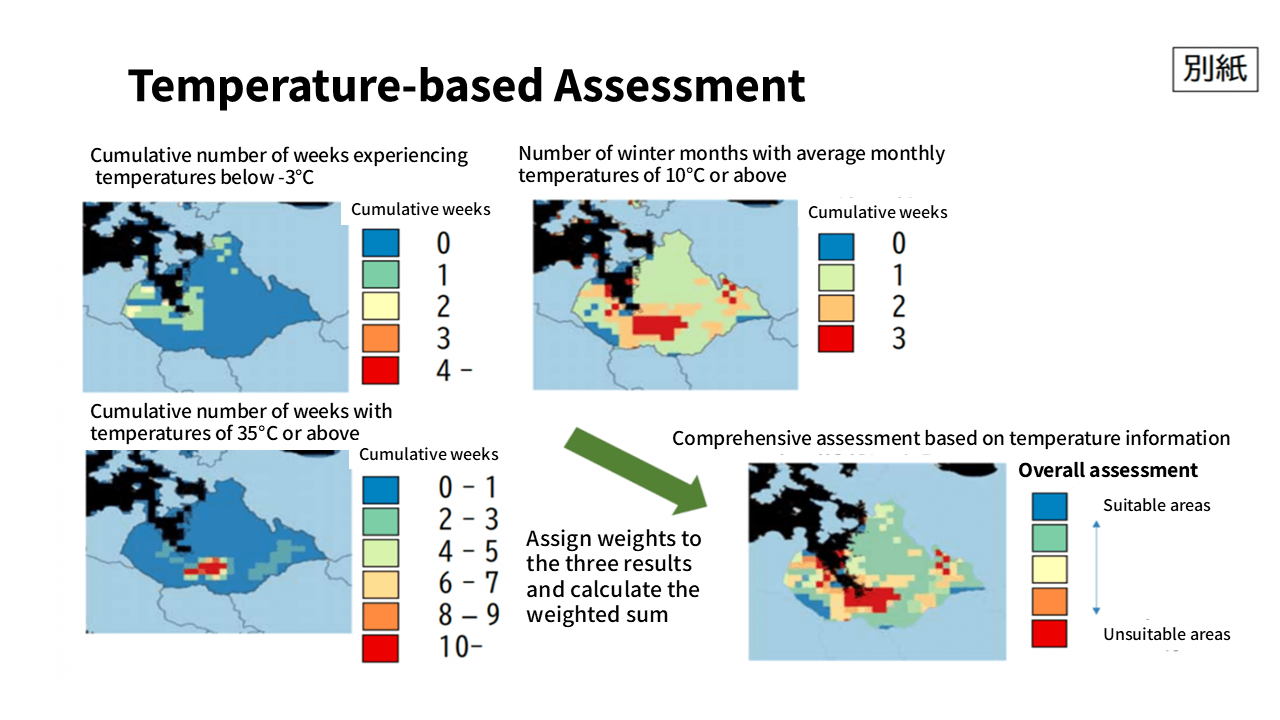
When selecting suitable locations for growing fruits and vegetables, factors such as temperature, sunlight hours, and soil composition need to be considered.
By overlaying these factors on a map and narrowing down potential sites in advance, the process of selecting suitable land for farming can be more efficient.
Discover Profitable Land! Discover Potential Specialty Regions Using Space Technology and Expertise!
https://sorabatake.jp/6223/
Wind Power Generation Sites
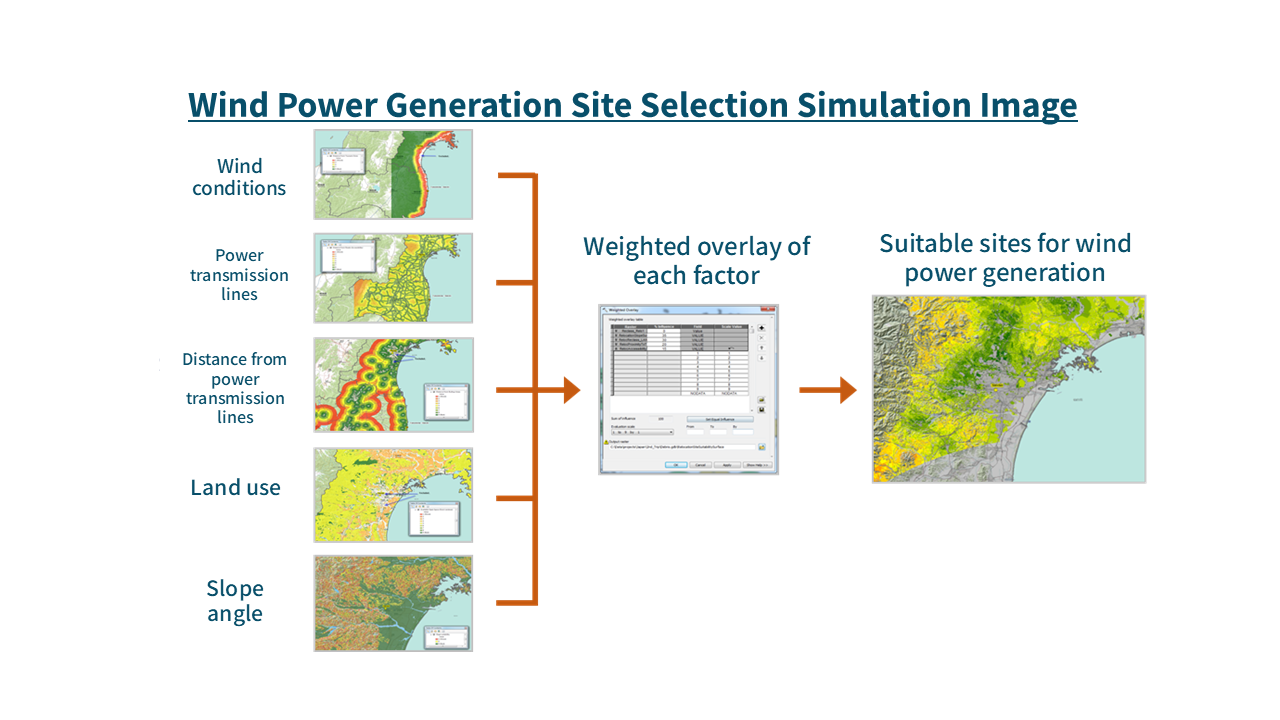
Site selection analysis is also used in choosing locations for renewable energy generation, such as wind power.
Event Prediction
Malaria Potential Map
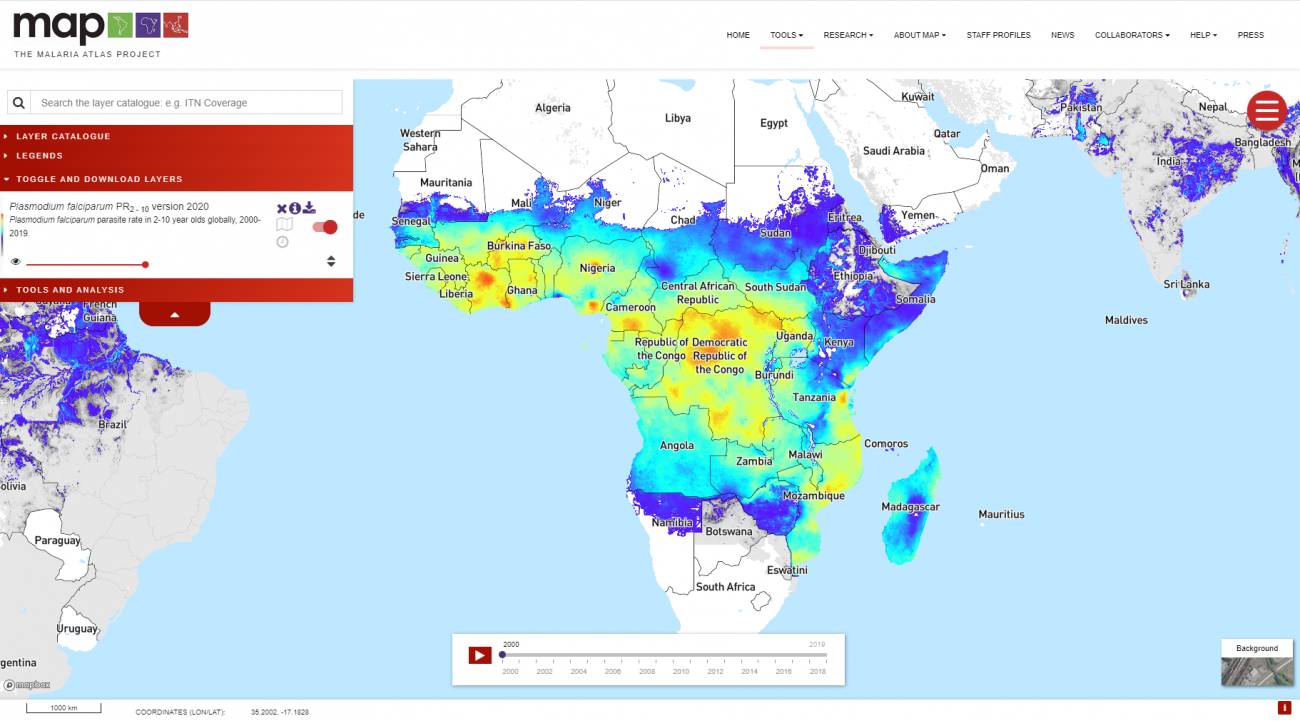
Although slightly outside the scope of business examples, this case involves the creation of a malaria infection prediction map.
Route Planning to a Destination
Route planning, a familiar feature of car navigation systems and Google Maps, is also being applied to analyze routes beyond urban areas.
"YAMAP"
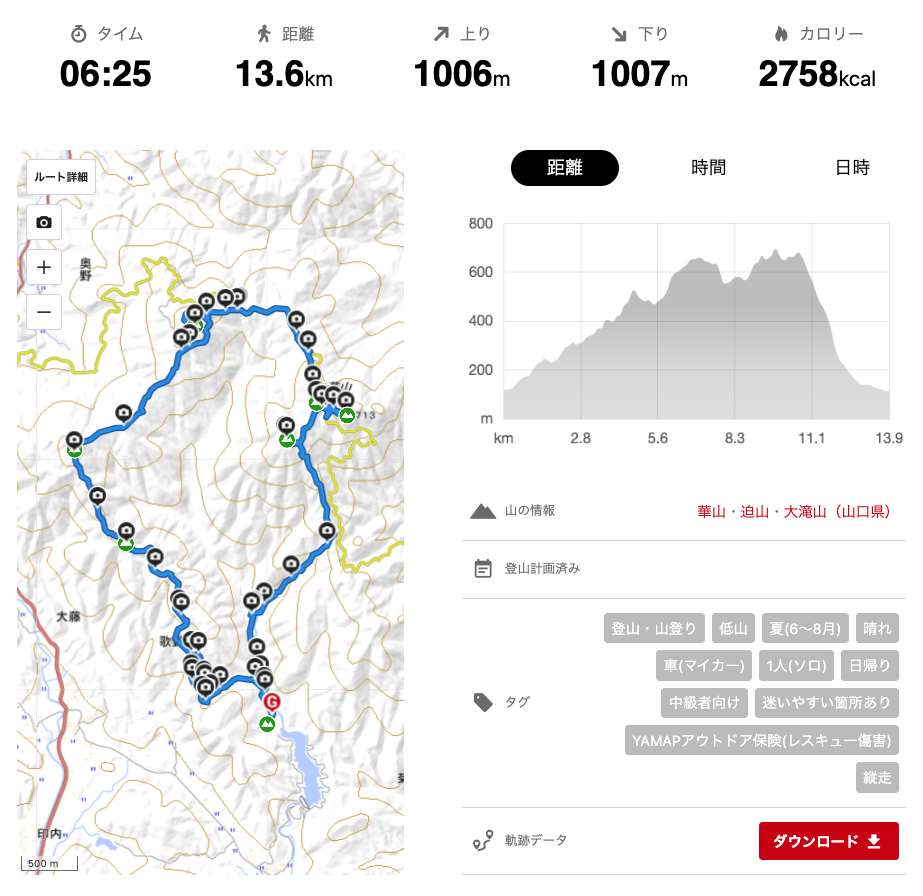
YAMAP is an app that allows route planning and information gathering for mountain treks.
By analyzing data from previous climbers, the app provides information on the time required for different routes.
The YAMAP Way! Tips for Releasing New Features Using Data to Capture Users’ Hearts
https://sorabatake.jp/16439/
3D Visualization
With the advancements in VR and AR technologies, the use of 3D visualization to recreate cityscapes is expanding.
Drone Flight Path Planning
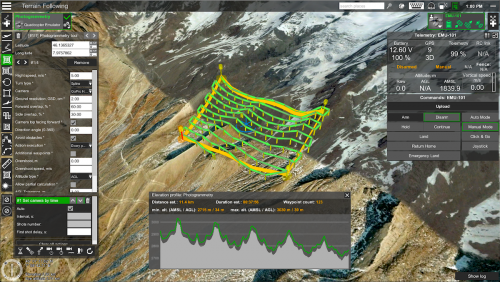
This case involves creating a 3D map using elevation data and infrastructure information, such as power transmission lines, to plan drone flight paths.
(5) Getting Started with GIS (Introduction to Software and Open Source)
As mentioned earlier, GIS is being widely used in various industries and fields, and it may have applications in your industry or business as well. In this chapter, we will introduce tools that can be used to start GIS activities.
Application Software (GUI Tools)
First, let’s start with tools that allow you to operate GIS through a graphical user interface (GUI) using a mouse. These tools include both paid and free options.
ArcGIS
URL:https://www.esrij.com/products/arcgis/
ArcGIS is the most well-known paid GIS software. It is developed by Esri, the company that has been mentioned multiple times in this article.
Originally, it was software installed on users’ PCs, but it has now evolved into a cloud-based service in line with the current trend of cloud computing.
Recently, ArcGIS has partnered with Planet Labs, a U.S. space venture, to provide access to satellite data captured by small satellites through ArcGIS. This partnership aims to promote the utilization of satellite data.
QGIS (Free and Open Source)
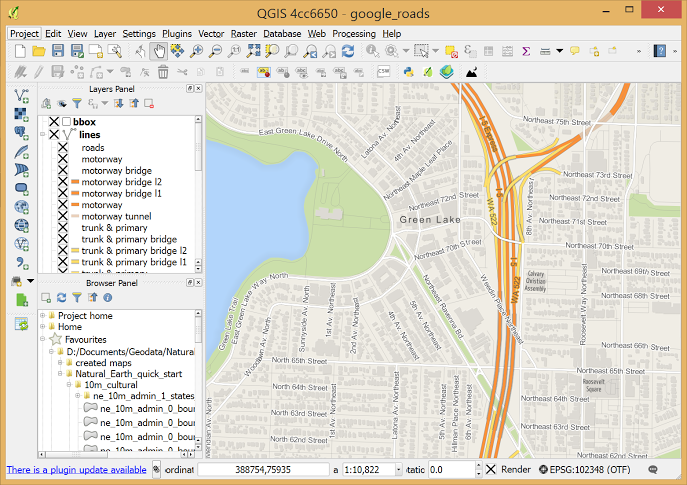
QGIS is the most commonly used free and open-source GIS software.
It is an open-source software with a large community of users who have developed various add-on tools, enabling a wide range of analyses.
Google Earth Pro (Free)
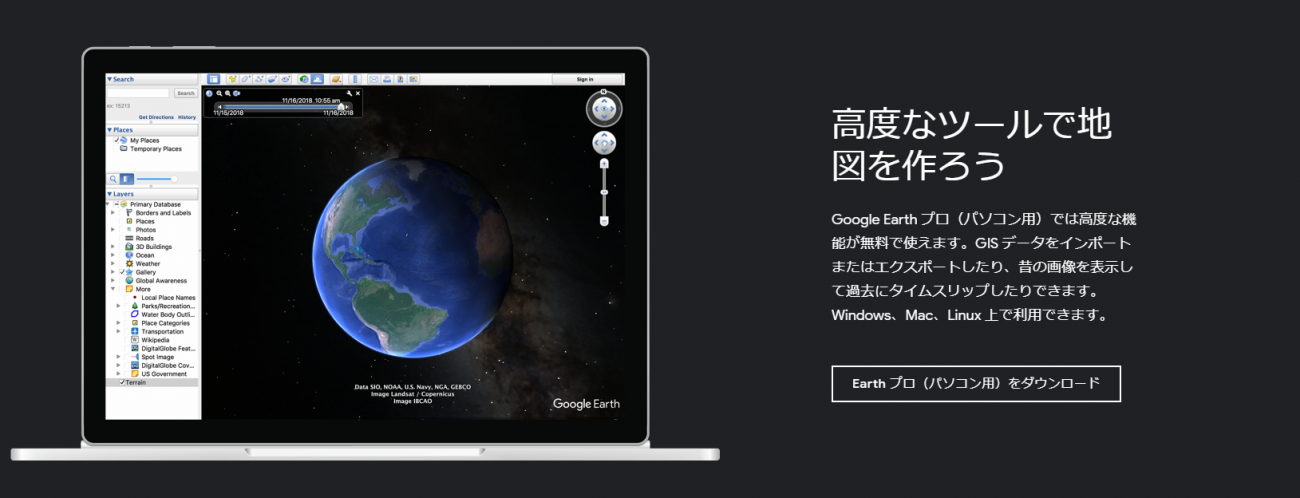
Google Earth Pro is a GIS tool provided by Google.
It allows users to view locations worldwide using high-resolution satellite imagery and 3D maps, making it an attractive option. It also allows users to import and display GIS data.
Google Earth Pro is more focused on data visualization and viewing, rather than analysis. For analysis purposes, Google tends to emphasize the use of Google Earth Engine’s Code Editor.
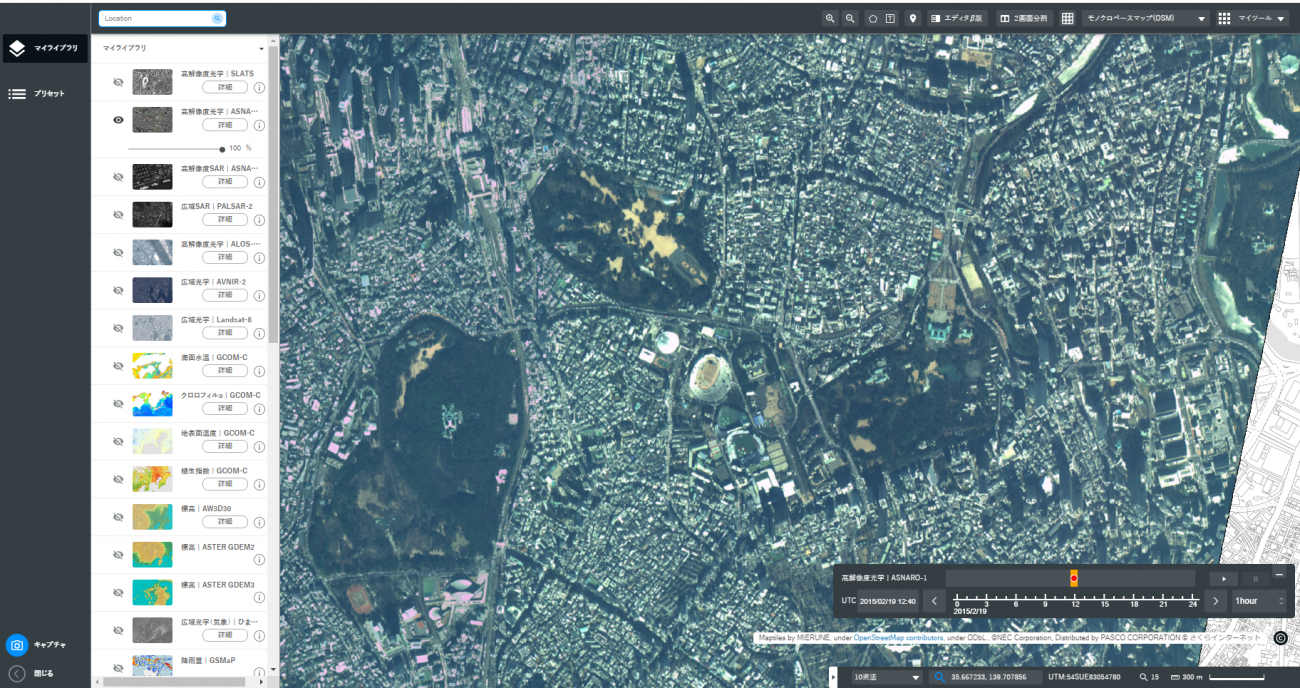
Tellus (Free)
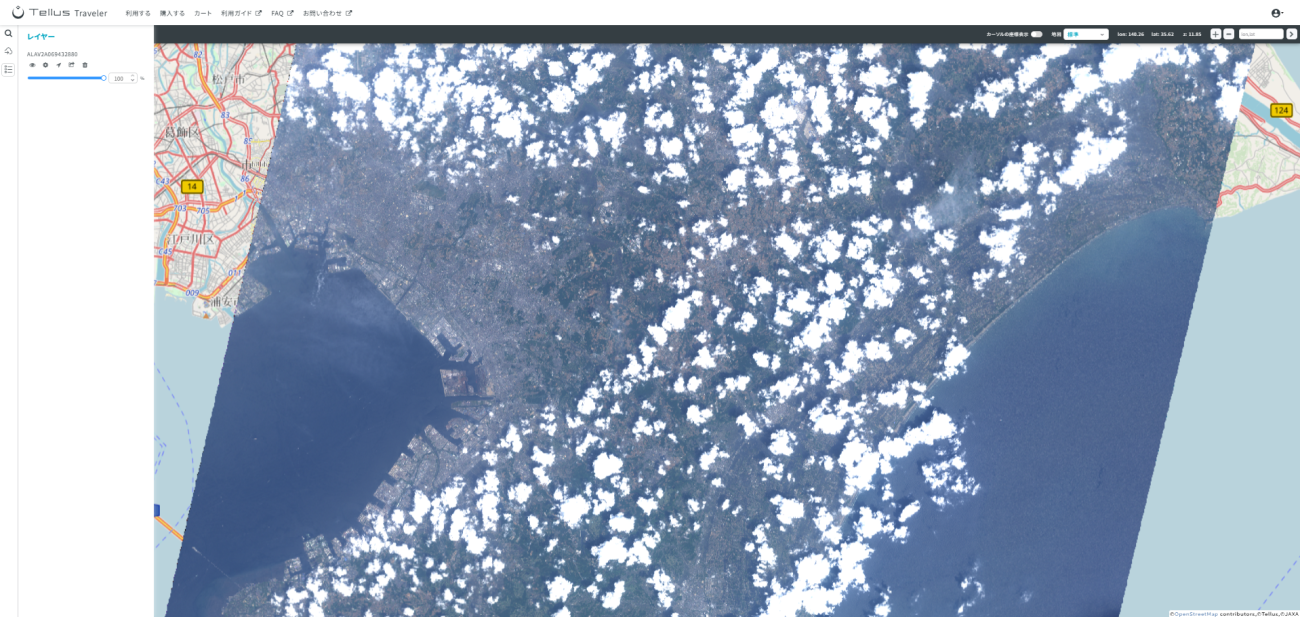
Tellus, a satellite data platform developed in Japan, provides a web-based GIS data visualization tool called “Tellus Traveler.”
Tellus Traveler is primarily designed for data search and visualization, Tellus also offers a separate development environment that allows users to perform GIS analysis using Python and QGIS.
Programming Languages and Libraries
For those with programming experience, using code for GIS analysis may be preferred over GUI-based tools. There are several open-source GIS libraries available for programming languages like R and Python.
R
R, a popular programming language for statistical analysis, also has many packages available for GIS analysis.
Here are some examples of packages, but please choose the appropriate packages based on the specific analysis you want to perform:
| Package name | Description |
| GIS Tools | Package for manipulating spatial data and mapping. |
| sf | Package for manipulating vector data. |
| raster | Package for manipulating raster data. |
| spatstat | Package for conducting spatial statistics. |
There are many books and reference websites available, which can serve as a guide for further exploration:
– “Spatial Data Analysis with R”
http://www.asakura.co.jp/books/isbn/978-4-254-12815-4/
– “Introduction to Geospatial Data Analysis with R” by Kyoritsu Publishing
https://www.kyoritsu-pub.co.jp/bookdetail/9784320124394
– “GIS in R”
http://www.okadajp.org/RWiki/?%EF%BC%B2%E3%81%A7%EF%BC%A7%EF%BC%A9%EF%BC%B3
Python
Python, a versatile programming language used for various purposes including machine learning, also offers several GIS libraries.
Here are some examples:
| Package | Description |
| GDAL | Basic GIS operations. |
| GeoPandas | An extension of the Pandas library that allows manipulation of geospatial data. |
| rasterio | Operations on geospatial data. Can handle GeoTIFF and other formats. |
| shaply | Operations of vector data |
Here are some resources to get started with Python for GIS:
– “Introduction to Python for GIS Beginners and Intermediate Users”
https://gis-oer.github.io/gitbook/book/materials/python/
– “Useful Libraries for Handling GIS Data in Python”
https://www.gis-py.com/entry/2018/12/26/170327
Base Maps
Open Street Map(OSM)
OpenStreetMap (OSM) is a project that allows anyone to freely use and contribute to open geospatial data, creating a collaborative mapmaking community.
You can embed OSM maps on websites or display them in desktop GIS software like QGIS. To display OSM maps on websites, JavaScript libraries such as Leaflet or OpenLayers are commonly used.
Leaflet
Leaflet is an open-source JavaScript library widely used for web mapping services. It enables the creation of interactive maps and is known for its lightweight file size and various map representations.
With its simple interface, extensive documentation, and large community, Leaflet provides numerous resources for map development. However, one challenge is that its development has stagnated over time.
OpenLayers
OpenLayers is another open-source JavaScript library that allows easy creation of dynamic web maps. Similar to Leaflet, it supports various map operations, vector layers, and tile loading.
OpenLayers is popular among GIS users and allows for not only visualization but also analysis of geospatial data. It may be slightly more challenging for beginners, but it becomes a powerful development library once mastered.
MapTiler
MapTiler is a global map distribution service provided by Klokan Technologies based in Switzerland. In Japan, it has been localized by MIERUNE Corporation by combining various open data sources.
MapTiler provides vector-based maps, allowing for flexible customization.
Mapbox
Mapbox is another global map distribution service provided by Mapbox Inc. based in the United States. They started their business in the Japanese market in 2019 and announced a partnership with Zenrin, a map data provider in Japan.
Reference:
Map libraries popularity: Leaflet vs Mapbox GL vs OpenLayers
(6) Conclusion
In this article, we have summarized GIS, which is closely related to satellite data analysis.
As digital transformation (DX) accelerates, the integration of geographical space and digital technology is inevitable, and it is expected that the use of GIS in business will continue to grow.
We encourage you to try your hand at GIS using free software and programming languages.
Why not start by exploring satellite data with "Tellus," an open and free data platform?
★Register for Tellus here
References and Resources:
– GIS Practical Open Educational Resources (GIS実習オープン教材)
https://gis-oer.github.io/gitbook/book/
– Web Guidebook on Geospatial Information for Local Governments (国土交通省国土政策局国土情報課による地方公共団体向け地理空間情報に関するWebガイドブック)
https://www.mlit.go.jp/kokudoseisaku/gis/gis/webguide/giswg_solsht/319/
– Getting Started with GIS (Esri Japan)
https://www.esrij.com/getting-started/what-is-gis/
– Spatial Information Club (空間情報クラブ)
https://club.informatix.co.jp/