The 4th Tellus Satellite Challenge! Explanation of approaches taken by the winners
"Coastline extraction" was the theme of the 4th Tellus Satellite Challenge. In this article, we will look at the approaches taken by the winners, make comparisons, and summarize their methods so that they can be applied to other (satellite) image data competitions.
“Coastline extraction” was conducted as the 4th Tellus Satellite Challenge. In this article, we will look at the approaches of the winners in a comparative manner and summarize their methods so that they can be applied to other (satellite) image data competitions.
This time, Kenta Tagami, who participated in the competition, contributed to the article.
(1) What is the Tellus Satellite Challenge?
“Tellus” is a satellite data platform intended to support industries across the globe. It is a project undertaken by the Japanese government as a part of their “2030 Space Industry Vision” with the goal of doubling the scale of the space industry by early 2030. As a part of the Tellus project, the “Tellus Satellite Challenge” is a series of data analysis contests held to promote the use of Tellus, increase awareness of satellite data, discover new talent in field data science, and visualize examples of satellite data.
The last three Tellus Satellite Challenges were held on the themes of
landslide detection (1st),
vessel detection (2nd), and
sea ice extent detection (3rd).
The results were published in previous articles (the 1st, 2nd, and 3rd challenges).
Talent from around the world in the AI industry participated in the challenges, taking on issues using tools such as SAR and high-resolution optical data. We received the best practice for utilizing satellite data.
In the 4th Tellus Satellite Challenge, “coastline extraction” was conducted by participants.
(2) Summary of the 4th Tellus Satellite Challenge
The theme of the 4th challenge is “coastline extraction.”
The significance of the theme and the SAR data used in this challenge are summarized in this article.
The 4th Tellus Satellite Challenge is now underway! The theme is “coastline extraction.”
A particular aspect of satellite data is that SAR data is often of higher resolution than optical data and is less affected by weather. So, looking back at this competition will be useful for other satellite data competitions and when using satellite data.
In the 4th Challenge, the number of participants was 803 (+246 from the previous Challenge) and the number of submitted models was 2,783 (+709). These increases are probably due to the Tellus SPACE xData Fes. -OnlineWeeks 2020-, an event held by Tellus in the summer of 2020. Another reason is the popularity of satellite data competitions are also on the rise.
(3) Summary of the Challenge
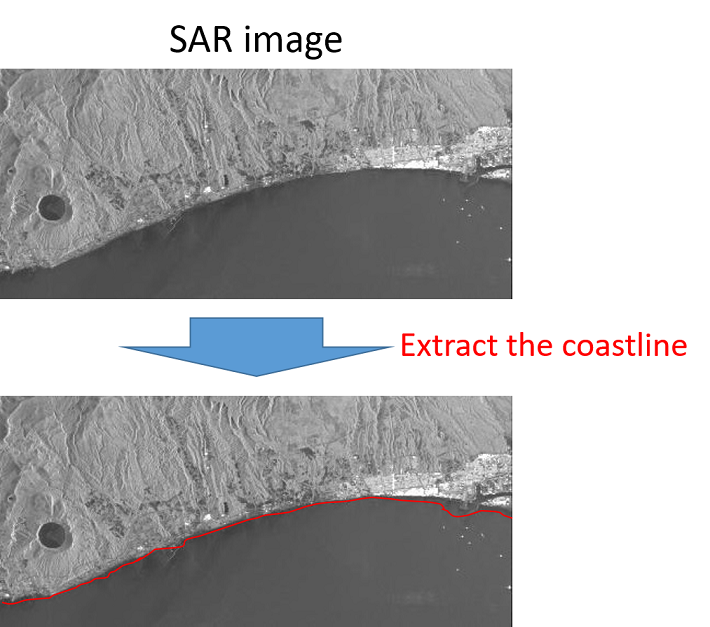
The challenge is to extract coastline from a SAR data grayscale image and teaching data of the coastline.
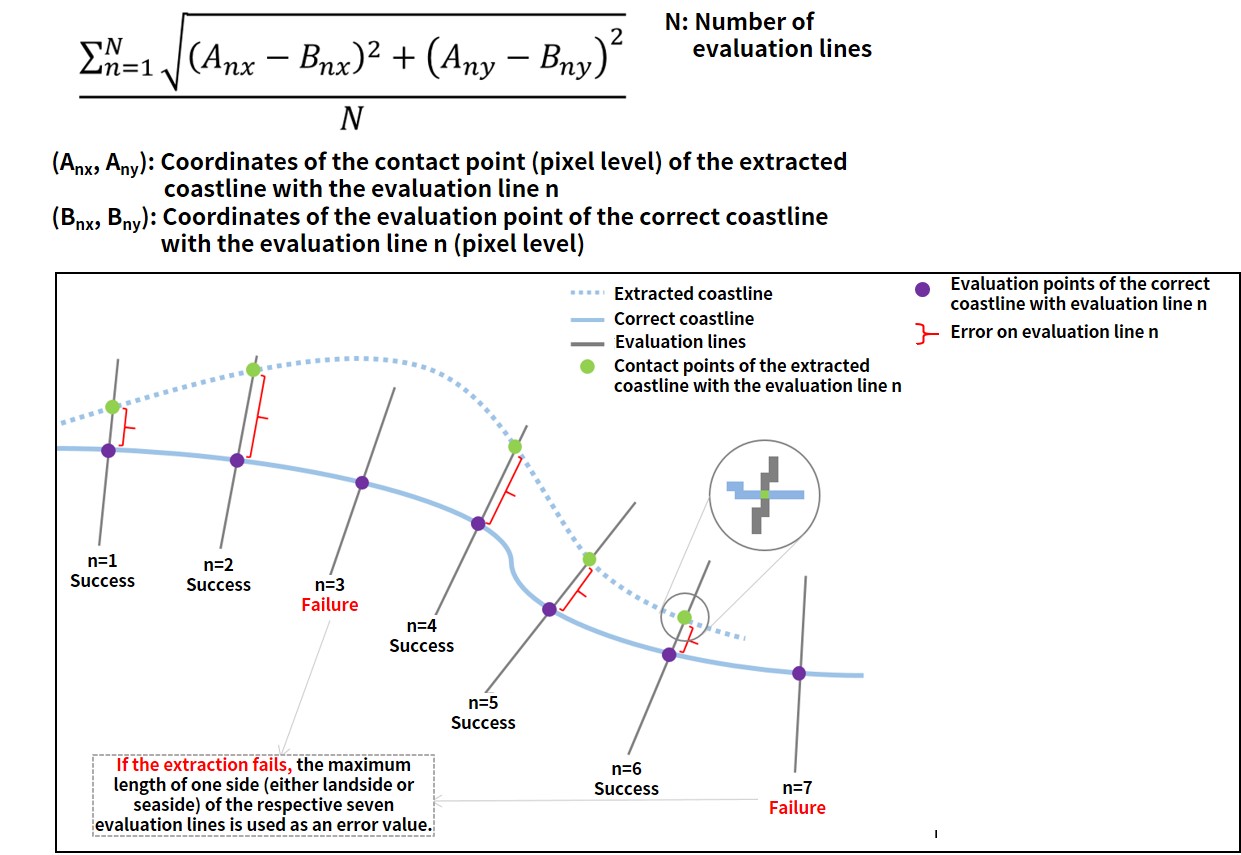
Evaluation Indicator
As shown below, the correct coastline data has evaluation lines perpendicular to the coastline at regular intervals, and participants will try to predict the coastline with as little error as possible.
(4) Winners
Here is some information about the top three winning teams.
1st
Team BloodAxe
As of January 2021, they are ranked number one in the entire SIGNATE.
https://signate.jp/users/25647
They also hold the title of Competition Grandmaster on Kaggle, and won third place in the 1st Tellus Satellite Challenge.
This time, they were the solo victor.
2nd
Team IRAFM-AI
This team won second place in SIGNATE’s 3rd AI Edge Contest. A video interview of that time is also available.
They also placed sixth in the last Tellus Satellite Challenge.
This time, they participated as a group of three, including a newly joined Japanese member.
した。
3rd
Team aknk
The team is made up of employees of INTEC Inc.
Their solution is published in a Qiita article, which will help you better understand the methods they use.
[SIGNATE] Review of the 4th Tellus Satellite Challenge [3rd place] – Qiita
(5) Approaches taken by the Winners
Here is a summary of the approaches taken by each of the three winning teams.
Overview of the process
処理全体を次の順番に見ていきます。
- Preparation
- - Image data processing
- - Label data creation
- Learning
- - Used models
- - Augmentation
- Post-processing
- - Prediction
- - Coastline extraction
Preprocessing
Image data processing
| Team BloodAxe | Team IRAFM-AI | Team aknk |
| Divide the images by 65,535 (value of 16bit -1), then deduct the square root, and normalize it to the range [0-1]. | To make the images in the range [0-1], perform: – Linear transformation (divide by 65535) – Nonlinear transformation (utilizing log). Images are used separately. |
Crop the area around the coastline so that the images are of the same size. Convert data to 8bit. For training data, crop the annotated coastline area. For test data, process the images to find the coastline area. |
As you can see, each team is approaching the challenge quite differently.
As shown in the Qiita article by Team aknk, unprocessed data is completely dark and therefore differences are difficult to make out, it was necessary to conduct some kind of processing to make the data easier to handle.
Also, since all the images have the same physical resolution, Teams IRAFM-AI and aknk basically just crop the images instead of resizing them.
Label data creation
| Team BloodAxe | Team IRAFM-AI | Team aknk |
| Binary classification – Coastline: 1 Others: 0 If the value is set to 0 or 1, the data will be biased, so the heatmap should be used to find the range [0-1] from the coastline. |
Create two types of training data Binary classification – Coastline: 1 Others: 0 Since the data is biased, the label smoothing process is applied to make it in the range of [0-1]. 3-class classification – Sea: 0 – None (no-data): 1 – Land: 2 |
Binary classification
– Land: 1 – Sea: 0 Since the area around the coastline has already been extracted in the preparation, only the extracted area is divided into land and sea. Use labels. If there is a missing value, it is set to 0. |
In the data used for this Challenge, some information is missing in the image. Therefore, the top two teams use “coastline” or “others” as a label, and Team IRAFM-AI classify the missing data (no-data).
Team aknk is dealing with this by extracting the data near the coastline in preparation, avoiding the missing parts as much as possible.
In addition, since most of the data in the image is “others” by classifying it into either “coastline” or “others,” the teams reduce the bias of the distribution by adding heatmap and using a label smoothing process.
According to Team BloodAxe, the annotation data, which is the teaching data, is also not perfect because it is manually generated, and the heatmap makes it easier for the model to be flexible even if the actual annotations are not completely correct.
Learning
Used models
| Team BloodAxe | Team IRAFM-AI | Team aknk |
| UNet
EfficientNet B4 |
UNet
EfficientNet |
UNet++
EfficientNet B5 |
All teams use a combination of UNet(++) and EfficientNet.
UNet is also mentioned in an article on the 3rd Challenge. It is a commonly used technique in segmentation tasks.
The Team IRAFM-AI also talked about the loss function and the optimization method; they use a combination of Dice Loss and Focal Loss, and Binary Cross Entropy for the loss function in several models, and Adam and AdaDelta for the optimization method.
On the other hand, Team IRAFM-AI referred to benchmarks in https://paperswithcode.com/task/semantic-segmentation and other sources to decide which model to use. The website, Papers with Code, lists the URLs of both the papers and the published code together, allowing you to compare them by task and research the latest models.
Augmentation
Since only 25 images are provided as the training data for this Challenge, all teams used augmentation to increase the number of training data.
| Team BloodAxe | Team IRAFM-AI | Team aknk |
| Used Albumentations library – random rotation by 90 degrees – random transpose – grid shuffle – coarse dropout – affine shift – rescale – rotation – elastic transformation – grid distortion – perspective distortion – random change of brightness & contrast – gaussian blur & noise |
Strengthen enhancement – multiplicative intensity shift – cutout Space enhancement – flip – rotation – rescale – random crops – multi-sample mosaicing |
– random crop – rotation – salt-and-pepper noise – random erase – random flip |
It would take too long to explain all the methods in detail here, but the one used by Team BloodAxe , Albumentations, is capable of various image processing, so you can easily understand what it can actually do by looking at the official sample code.
“Multi-sample mosaicking” used by the Team IRAFM-AI, is an originally developed method that divides the data sample into n rectangles and replaces some of them with the same part of the image from a different training set to prevent overtraining.
Post-processing
Prediction
| Team BloodAxe | Team IRAFM-AI | Team aknk |
| Using Pytorch-toolbelt, a self-made open-source library, split a large image into pieces with overlapping parts and then use TTA to predict. | Create overlapping prediction data using a method called Floating Window. | Use the cropped images based on the coastline extracted by image processing. Make sure that the images have overlapping parts and average each prediction by using TTA. |
Every team basically crops the test image data with some overlapping parts and gives their respective predictions. TTA (Test Time Augmentation) is a method that also performs augmentation at test time and is often used in recent image competitions. It can be used for the prediction of overlapping areas. In addition, by performing TTA, prediction can be performed under different conditions, and the effect of outliers in prediction can be reduced by overlapping the prediction results, or the accuracy can be increased as in ensemble processing.
Coastline Extraction
| Team BloodAxe | Team IRAFM-AI | Team aknk |
Using a computer vision system library, perform the following steps:
|
In the case of the binary classification model, look for the column with the largest probability in each row and use that as the coastline.
In the case of the 3-class classification model, look at the prediction for the surrounding 3 x 3 pixels, and if the surrounding area contains both ocean and land, then consider it a coastline. Create a weighted average of all models as the final prediction. For weighting, refer to the model’s public leaderboard score. |
Since the data is labeled as land or sea, binarize the data at a threshold value and then adopt the edge of the data as the final coastline. |
For the final output, all but Team IRAFM-AI uses computer vision-based processing.
Although no specific library was mentioned, you can refer to https://scikit-image.org/docs/dev/auto_examples/edges/plot_skeleton.html for image thinning, and http://labs.eecs.tottori-u.ac.jp/sd/Member/oyamada/OpenCV/html/py_tutorials/py_imgproc/py_canny/py_canny.html for edge detection.
(5) Factors That Contributed to the Victory
We have summed up what was particularly important in winning the competition for the first-place winner,Team BloodAxe.
Elaborate data augmentation
In this case in particular, since the training data was limited, it was necessary to artificially increase data. In addition, augmentation was also necessary to robustly respond to spotted noise. However, we did not apply any noise-removal (Lee, etc.) filters.
Appropriate cross validation
We prepared and submitted the data based on the best final CV score obtained in the 5-fold CV.
Good segmentation model
The combination of UNet and EfficientNet B4 is known as SOTA (state of the art) for binary image segmentation, and it produced the highest CV score amongst those validated by transfer learning using pre-learned weights in Image-Net.
TTA and Ensembling
During the prediction, augmentation was performed by combining upside-down and left-right flipping and expansion to various scales. By taking the average of five models, the effect of spotted noise was reduced, which led to a smoother prediction of the coastline.
(6) After the Competition
I participated in this competition, but regrettably, I was just a step away from winning a medal.
Especially in this competition, we struggled in creating label data from annotated data and creating data for submission from predicted results more than the machine learning part of it.
I learned about solutions that I had never thought of before, such as the use of heatmap to make it easier to handle annotation data of coastlines as a segmentation task. When I take on another image data competition, I will apply what I have learned here.
I am looking forward to the next Tellus Satellite Challenge and other competitions using satellite data in the future.
(7) Explanation of the Methods by the Winners (original)
Please see below for explanations (original) of the approaches taken by each winner.