The 4th Tellus Satellite Challenge is now underway! The theme is “coastline extraction.”
Here is an overview of the 4th Tellus Satellite Challenge, a competition for segmentation using satellite images, with details of the competition, helpful papers, and material.
We are pleased to announce the Tellus Satellite Challenge will be held again this year. The 4th theme is “coastline extraction using SAR data.”
This article provides an overview of the contest and the significance of the theme, including what coastline extraction actually entails and what can be done with it.
1. Contest Overview
First, here’s an overview of the contest.
[Task]: Extraction of coastline from satellite images
[Data]:
– L-band SAR images
– Satellite: ALOS2 (JAXA)
– Size (H x W): 600 x 600 – 10,000 x 10,000
– Number of images: 25 (for learning), 30 (for evaluation)
– Polarization: HH
*Polarization is an indicator of the nature of radio waves and shows the vibration direction of the electric field. HH transmits and receives with horizontal polarization.
– Wavelength: Approx. 24cm
– Resolution: 3 m x 3 m
– Area: 17 coasts (55 scenes)
– Annotation
– Format: JSON
– Set of pixel coordinates where the coastline exists
[Prize]:
– 1st place: 1,000,000 yen
– 2nd place: 600,000 yen
– 3rd place: 400,000 yen
[Period]: from Thursday, August 6 to Friday, November 6
Details of the contest can be found below.
The 4th Tellus Satellite Challenge: Coastline Extraction
https://signate.jp/competitions/284
2. The Significance of "Coastline Extraction"
What is coastline?
The coast plays a role in preventing tsunami damage by reducing the force of waves. It also affects the flora and fauna that grow on the coast.
Coastal erosion, which is becoming more serious in Japan, is caused by disruption of the normal cycle of sand supply due to disasters such as earthquakes and typhoons, changes in wave and wind directions due to weather changes, sea-level rise due to global warming, and anthropogenic factors such as port and dam development.
Japan, an island nation surrounded by sea, has a coastline of about 35,000 km in total length. It is the sixth longest in the world and second only to the Philippines in terms of length per national land area.
The area of the sand beach is considered to be about 19,000 ha in the whole country, but about 13% of the beach, 2,400 ha, has disappeared due to erosion in these 15 years, and it is said that 160 ha will be lost every year in the future. If a sandy beach is nearly lost, its regeneration will be enormously expensive.
The significance and expectations of extracting coastlines
Currently, the National Institute for Land and Infrastructure Management is monitoring the health of the nation’s beaches by artificial satellite and conducting research to detect early signs of sand beach erosion so that action can be taken before it is too late. To understand long-term trends and short-term variations of the coastline, wide-area and high-frequency observations are necessary. Artificial satellites allow us to monitor wide areas of coastline at a high frequency.
However, it requires a high level of skill to make out coastlines from satellite data. Therefore, in this challenge, the goal is to develop an algorithm to extract the coastline from SAR data with a higher accuracy.
3. Introduction and Notes on the Use of SAR Images
What is a SAR image?
The satellite data used in this contest is called SAR data.
It is generated by the reflection of the electric waves actively emitted by the satellite. (For more detail, please refer to “The fundamentals of synthetic-aperture radar (SAR): cases, obtainable information, sensor, satellite, and wavelength“)
Unlike an optical image that captures the reflection of sunlight, the SAR image can grasp the situation of the ground surface even at night or if covered by cloud.
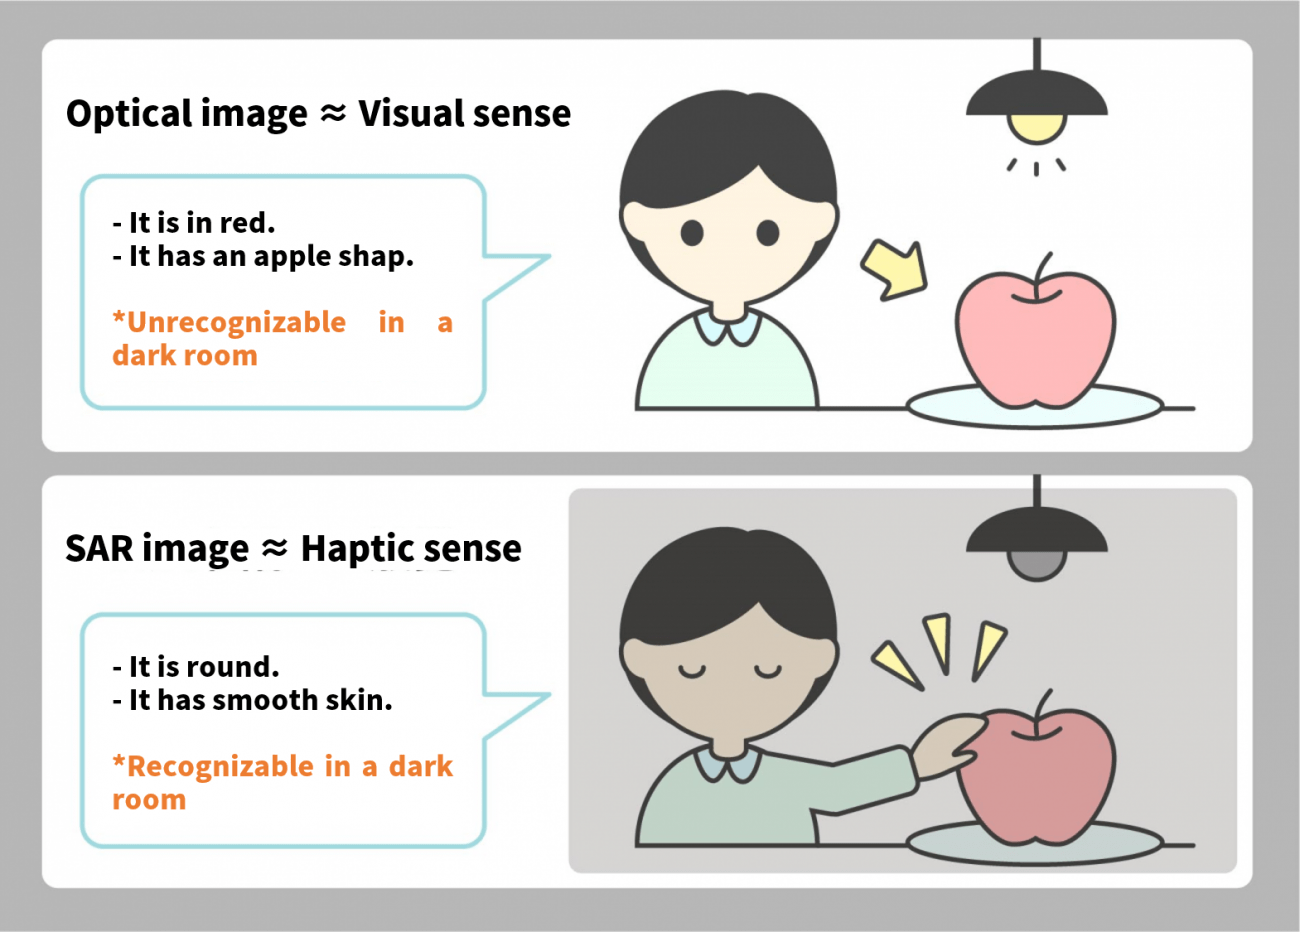
In the case of coastline detection, optical images can of course be used, but it is not possible to take images under cloudy conditions, so the use of SAR images has been attracting attention to increase the frequency of observations.
If you would like to learn more about SAR, please take a look at the article below.
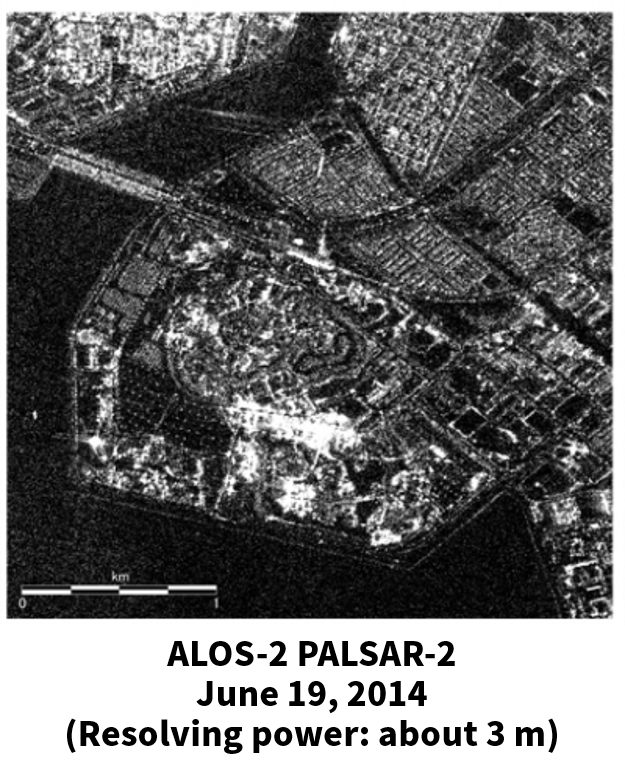
PALSAR-2 sensor mounted on Daichi-2 (ALOS-2)
The data to be used in this contest is acquired from some coastal areas of Japan by the PALSAR-2 sensor mounted on Advanced Land Observing Satellite 2 (ALOS-2), Daichi-2.
The PALSAR-2 is a synthetic-aperture radar (SAR) that reflects electro-magnetic waves off the surface of the earth to collect information on it. The SAR has the advantage of being able to photograph the earth’s surface at any time of the day or night, regardless of the weather.
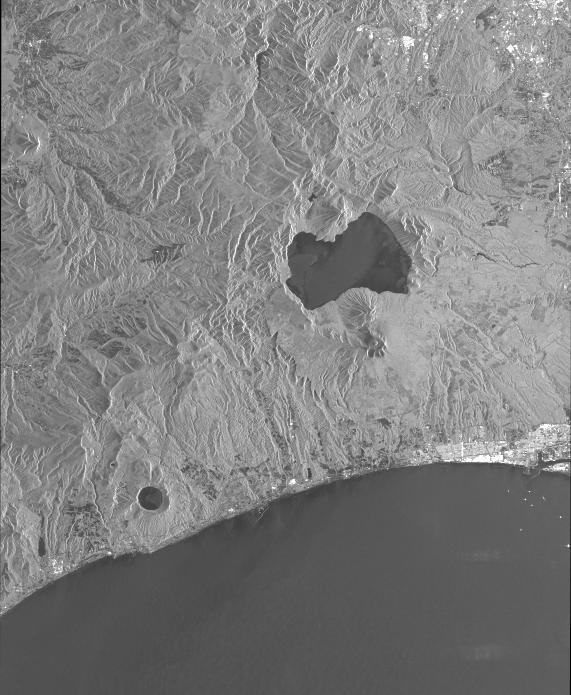
The Earth's surface as seen in a SAR image
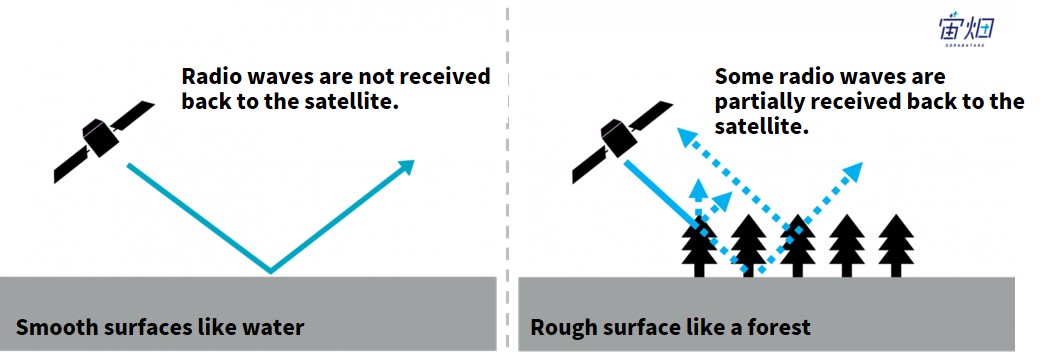
With SAR data, a rougher surface looks white as it scatters the electric waves and only some are reflected back to the satellite, and a smoother surface looks black as it reflects the waves more completely .
Also, we have to be careful when the sea surface becomes rough.
It seems likely that it will get difficult distinguishing land from sea surface as it obviously gets brighter as it becomes rough from strong wind and tidal waves.
What is HH polarization?
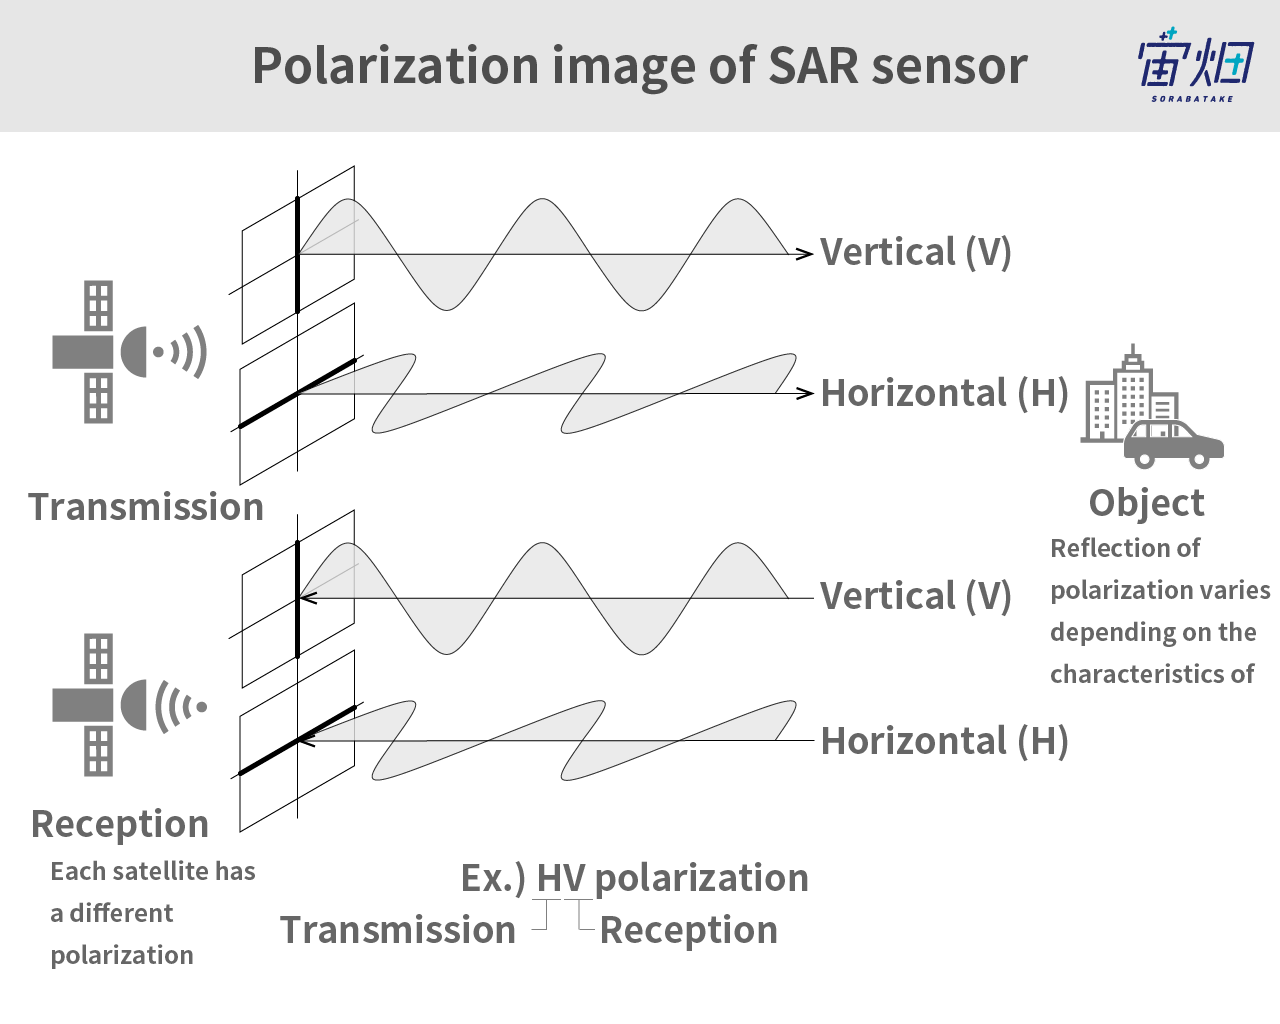
As shown in the figure above, electric waves of the SAR sensor are divided up by the direction of vibration: horizontal polarization (H) and vertical polarization (V).
For example, if an electric wave emitted as horizontal polarization is received horizontally, it is called HH, and if received vertically, HV. Likewise, for an electric wave emitted as vertical polarization is received vertically, it is called VV, and if horizontally, VH.
The details within this are beyond the objectives of this article. In short, the reflection intensity of polarization depends on the characteristics of objects (surface characteristics, salt content, etc.).
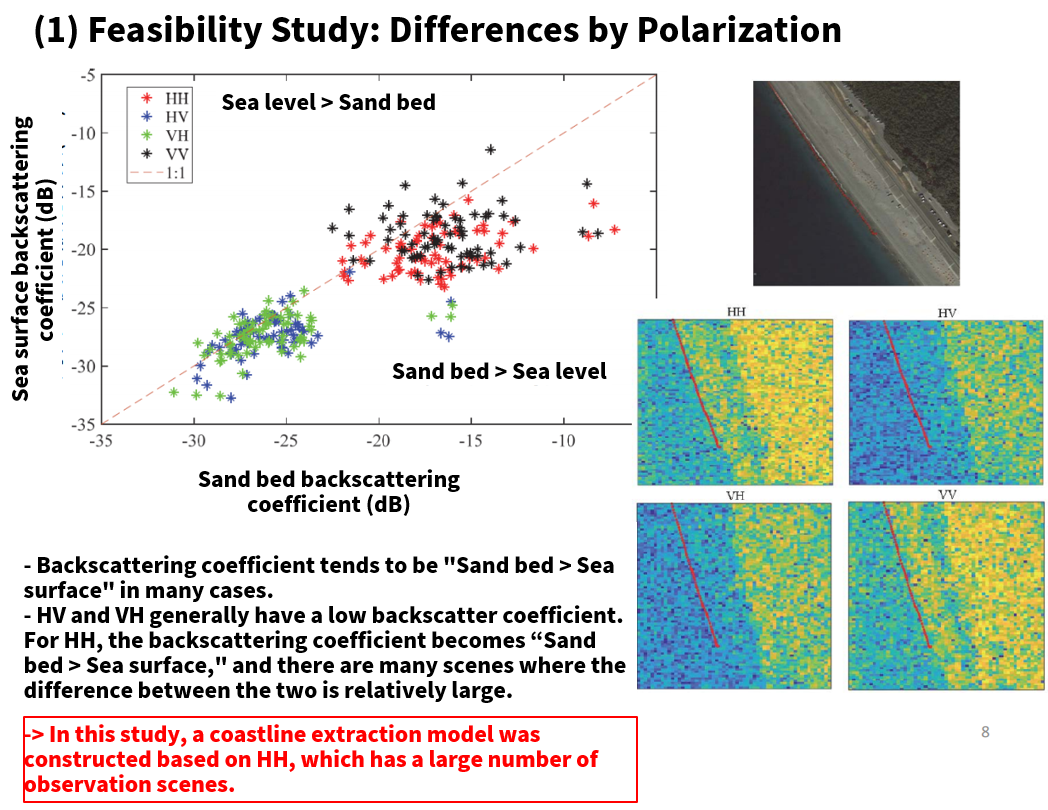
As shown in the four pictures in the lower right, HH or VV is considered easiest in extracting coastline. Source : https://www.mlit.go.jp/river/shinngikai_blog/tsunamiKondankai/dai06kai/pdf/doc_4-2.pdf
Based on previous studies, the HH polarization is used in this competition as it is considered to be the easiest way in distinguishing the coastline and has the largest number of images.
Differences between general and satellite images and notes
Differences between general and satellite images and notes
In previous Tellus competitions and machine learning approaches, we have seen that satellite images are closer to raw data and noisier than general images.
For example, many participants in previous challenges have downscaled the images as a preparation process. To downscale an image is to remove some of the finer parts of the data and the noise it contains.
(2) The number of satellite image datasets is limited.
For satellite images, data for training is not yet sufficiently available, so the key point is how to make the learning process more accurate using a small data set.
In the previous challenge, many winners applied transfer learning with ImageNet due to the lack of data for training. This involved using a SOTA (state of the art) segmentation model. Furthermore, in order to increase accuracy, there was a tendency for teams to use ensemble learning.
4. Competitions and Papers for Reference
The following are some of the competitions and papers that may be useful for this challenge.
- Papers on boundary extraction technology
A non-local algorithm for image denoising
https://www.iro.umontreal.ca/~mignotte/IFT6150/Articles/Buades-NonLocal.pdf
This paper proposes a filter to remove noise called Non Local means (NL-means).
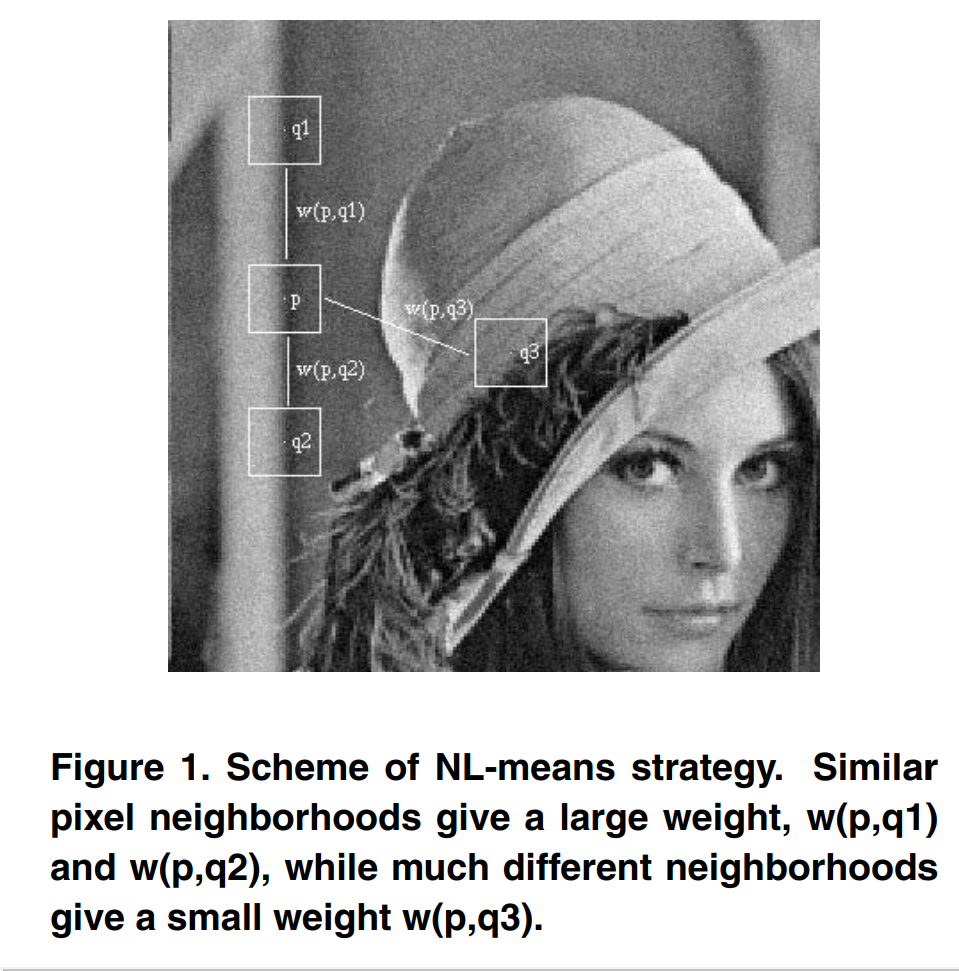
Denoising is a technique to smooth out the noise by mixing and blurring surrounding values.
The NL-means filter adjusts the mixing; if the target point and the surrounding area are similar, the weight is increased, and if they are not, the weight is decreased.
For example, in the above figure, the three vertical squares on the left side are similar and so the weighting is large, but these and the area enclosed by the square on the right side are not similar and so weighting is small.
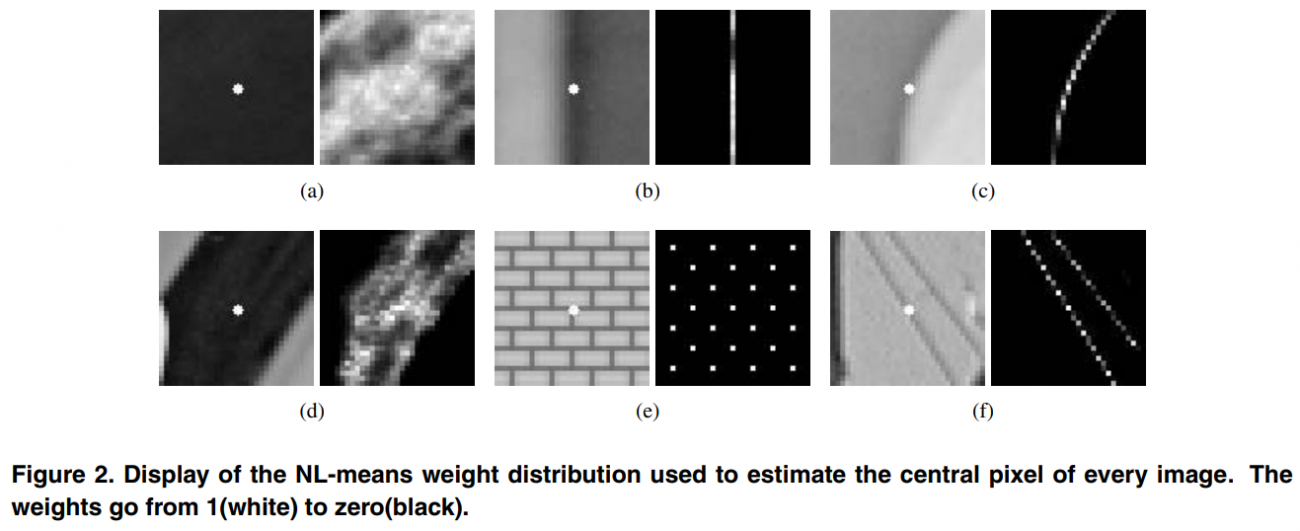
In these images, the left sides show the original images and the right sides show the weights (the white color means more weight and black color means less weight).
In this way, the NL-means filter adjusts the distribution of weighting in the smoothing process based on whether or not the target point is similar to the surrounding area.
Interactive Graph Cuts for Optimal Boundary & Region Segmentation of Objects in N-D Images
https://www.csd.uwo.ca/~yboykov/Papers/iccv01.pdf
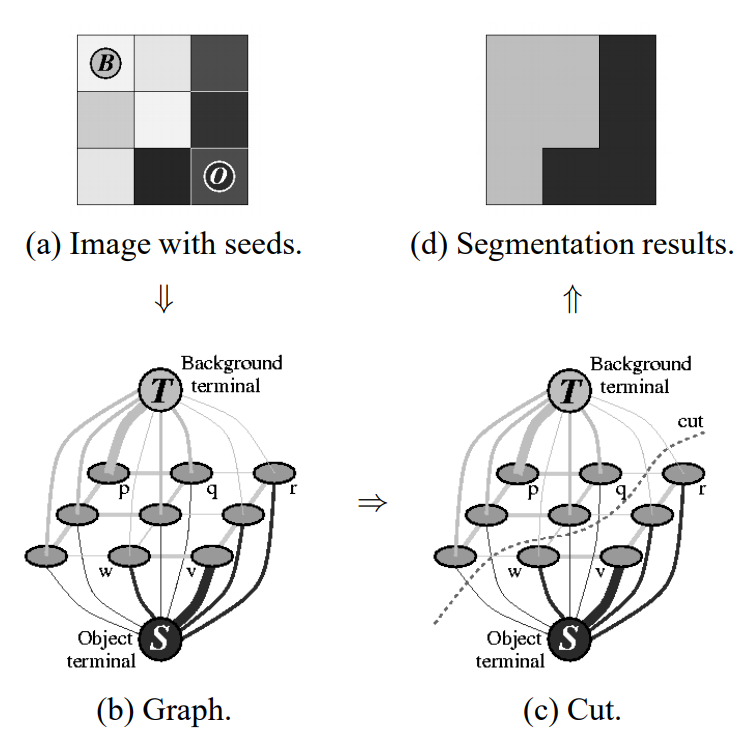
Graph cutting is a technique for dividing areas of an image (segmentation), which also appears in the following reference.
This is a technique used in Adobe’s Photoshop and other software to remove the background and hollow out only the subject.
As shown in the figure above, this method divides the image into pixels, calculates the cost between pixels based on color differences and other factors, and then divides the area so that the cost is minimized.
- Papers/documents on coastline extraction using satellite SAR images
The material for the 6th Roundtable Discussion on the Creation of a Tsunami Disaster Prevention Community and the Preservation of Beaches 4-2 Technological Development of Coastal Monitoring Utilizing Satellite Images
This material summarizes the feasibility study for coastline extraction using SAR imagery.
It has been pointed out that as the resolution of the SAR image has increased, the coastline may be mistakenly extracted due to the noise specific to SAR and the pattern of the wave crest line (a line with a series of waves) and the sand beach.
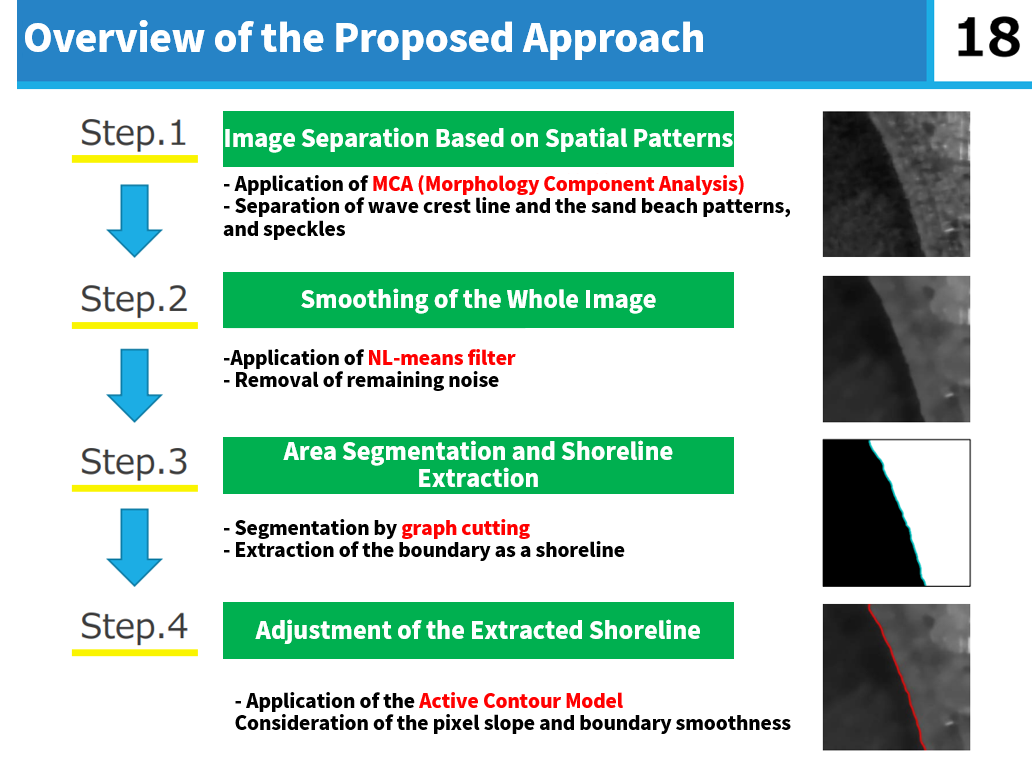
Therefore, in this study, an attempt is being made to extract the coastline with high accuracy by focusing on the differences in spatial patterns.
As we already mentioned about polarization in the previous section, this study shows that the accuracy of the coastline extraction depends on the following parameters.
(1) Polarisation
As shown in the four pictures in the lower right, HH or VV is considered to be the easiest to extract the coastline. Source : https://www.mlit.go.jp/river/shinngikai_blog/tsunamiKondankai/dai06kai/pdf/doc_4-2.pdf
(2) The angle of the satellite when shooting
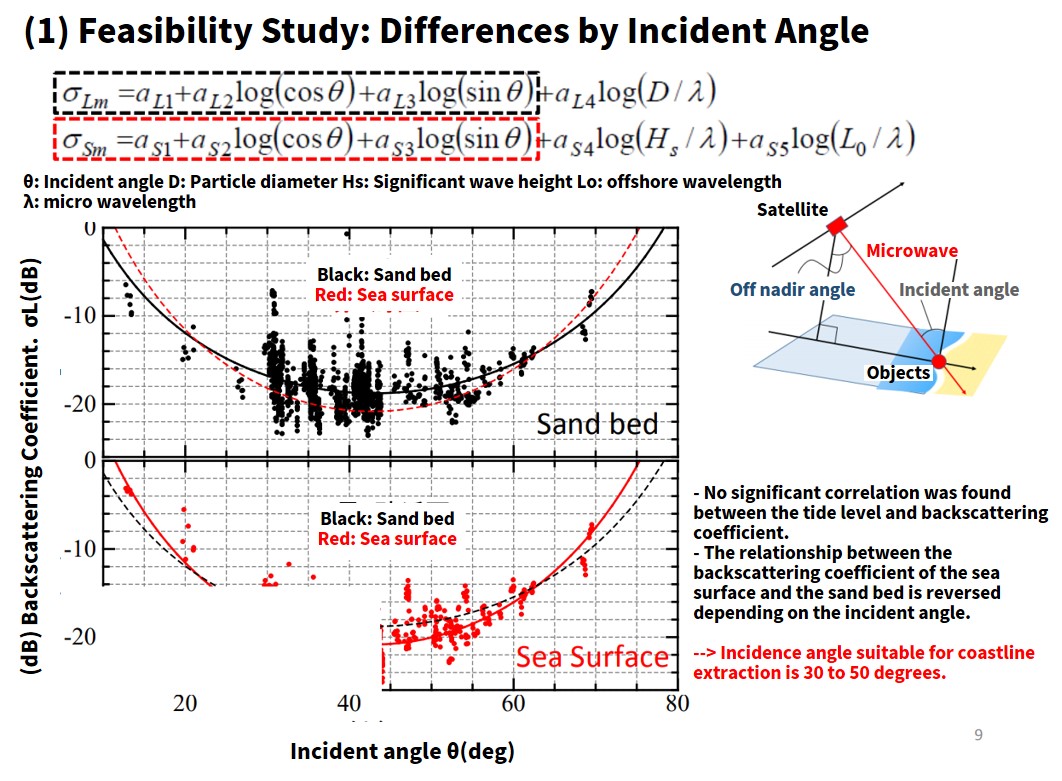
The SAR satellite, due to its shooting principle, constantly shoots at an angle, not right under itself. It is stated that the appropriate angle for this is 30 to 50 degrees.
(3) The grain size of the sand beach and wave height
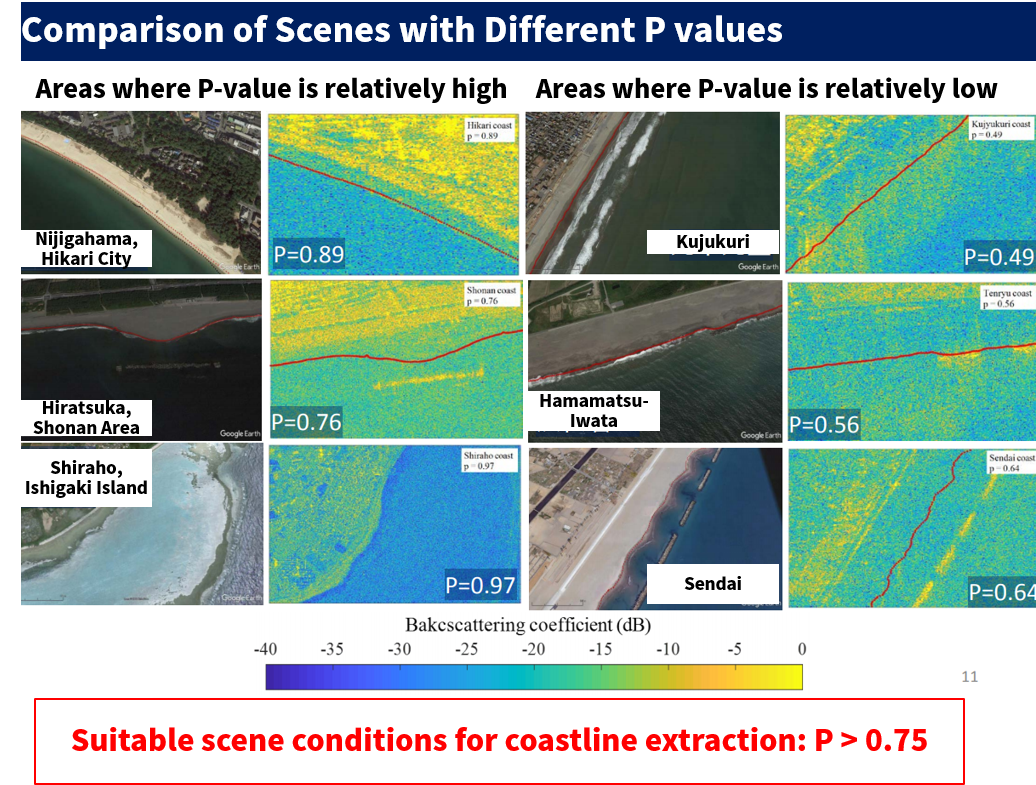
It also defines an index called P value, which is a parameter of the grain size of the sand beach and the height of the waves, and states that images with this P value greater than 0.75 are suitable for coastline extraction.
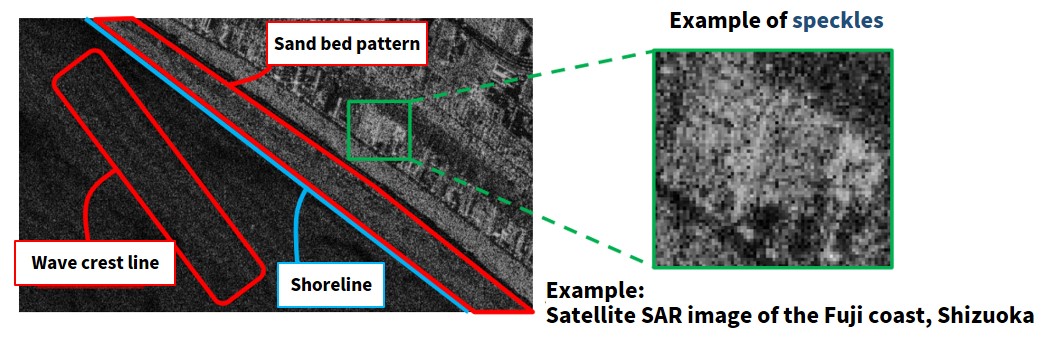
"Speckle" refers to the noise unique to SAR. Source : https://www.mlit.go.jp/river/shinngikai_blog/tsunamiKondankai/dai06kai/pdf/doc_4-2.pdf
If you would like to learn more, check out the following papers.
Study on characteristics of SAR imagery around the coast for shoreline detection, Coastal Engineering Journal, 61:2, 152-170,2019.
https://doi.org/10.1080/21664250.2018.1560685
Study on the shoreline monitoring system based on satellite SAR imagery, Yoshimitsu Tajima, Lianhui Wu, Takashi Fuse, Takenori Shimozono & Shinji Sato, Coastal Engineering Journal, 61:3, 401-421, 2019.
https://doi.org/10.1080/21664250.2019.1619252
Analysis of applicability and error factors of automatic coastline extraction from satellite SAR images
Applicability of automatic coastline extraction from satellite SAR images, Kunihiro Watanabe, Fuminori Kato, Takio Sano, Journal of Japan Society of Civil Engineers, ol.75, No. 2, I_1285─I_1290, 2019
https://doi.org/10.2208/kaigan.75.I_1285
In this paper, coastlines are extracted using satellite SAR images for 18 representative coasts in Japan.
The method of coastline extraction is as follows.
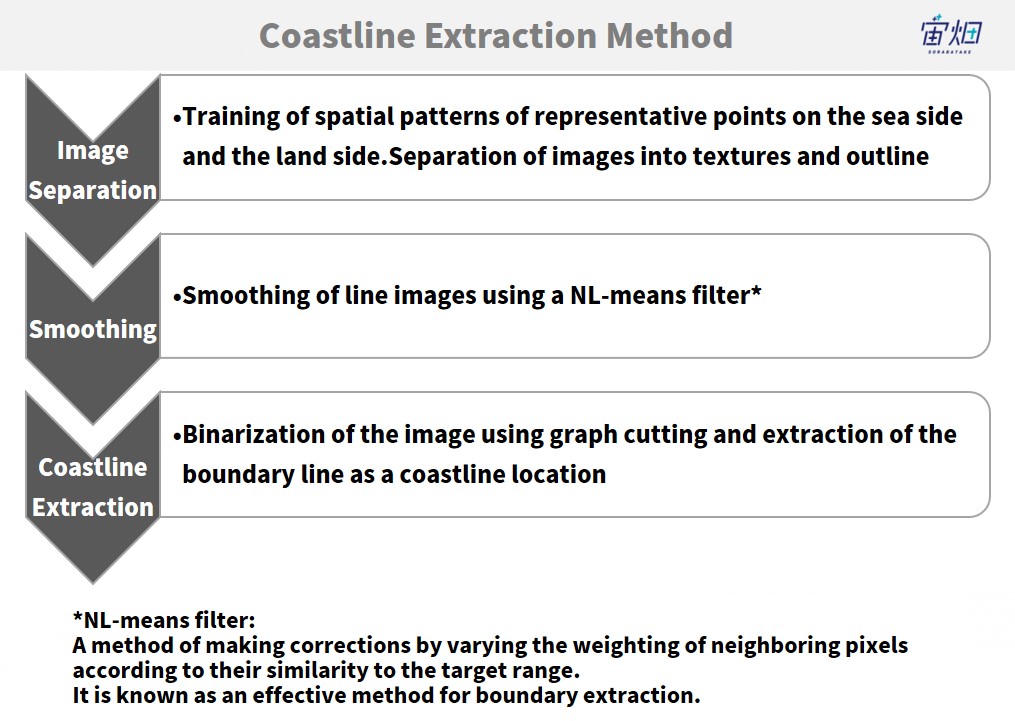
Like the material in the previous section, the paper also states that the angle of incidence at the time of shooting and the grain size of the sand beach are the factors contributing to the success rate and errors in extraction.
In addition, other error factors include the following.
(1) Condition of the berm
A berm is one of the micro-reliefs on a sand beach,which is a slightly raised sedimentary landform formed at a point slightly higher than the high tide level. It is eroded during high waves and is gradually deposited when the waves are calm.
It is presumed that the extraction error is biased toward the land side due to the sudden change in pixel values caused by the wet conditions maintained around the berm due to frequent wave action and the accumulation of large gravel grains around the top of the berm on a shingle beach.
(2) Influence of features of the landscape
It is stated that some of the misidentified features extracted largely off land included onshore dissipating blocks and the front edge of marine beach vegetation.
It seems that the key is how to avoid such detection errors.
- Machine learning competition using satellite SAR images
The 3rd Tellus Satellite Challenge: detection of sea ice areas
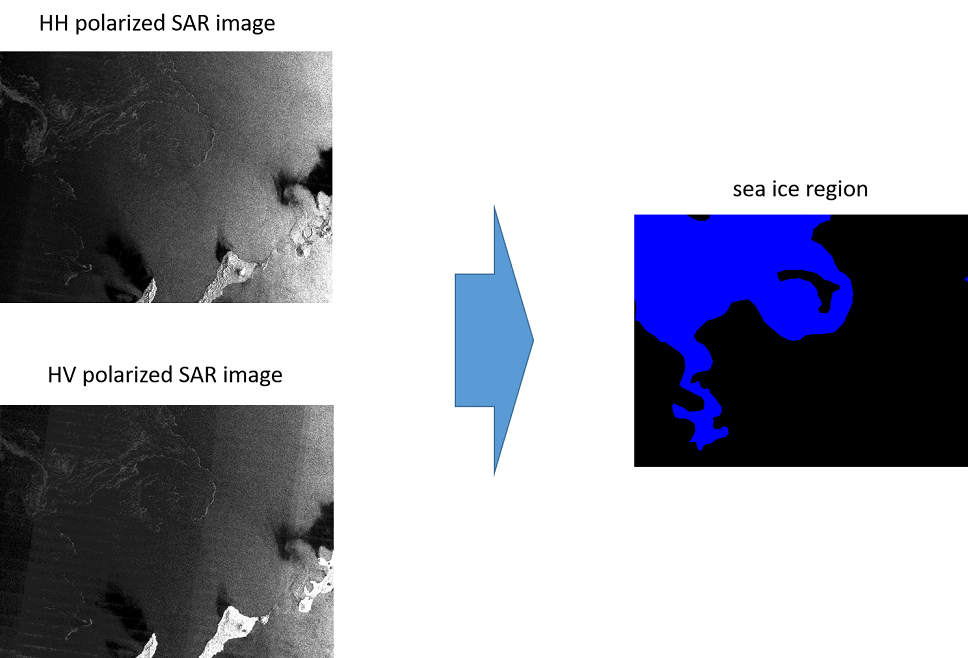
In the previous challenge, SAR images were also used to extract the areas of sea ice.
The approach of the winners is explained in the following article.
The 3rd Tellus Satellite Challenge! ~ Check out the Winners’ Models ~
There were two key points : (1) large image size and (2) low contrast. We think these are also applicable to this challenge.
Statoil/C-CORE Iceberg Classifier Challenge
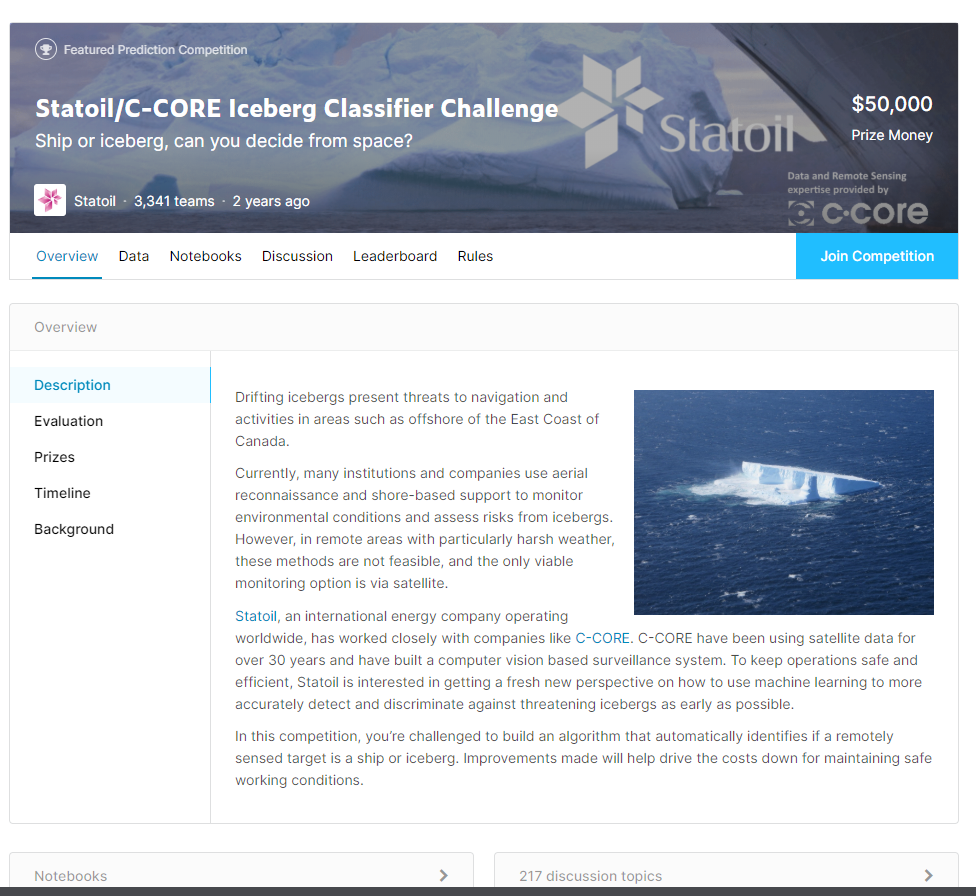
Previous kaggle segmentation-related competitions using satellite SAR images include the Statoil/C-CORE Iceberg Classifier Challenge.
It was a competition to identify sea ice and ships. We have explained this competition in Sorabatake before, so please take a look at it if you are interested.
[Kaggle Competition Commentary Series] Identification of Sea Ice and Ships on Satellite Images
SN6: Multi-Sensor All-Weather Mapping
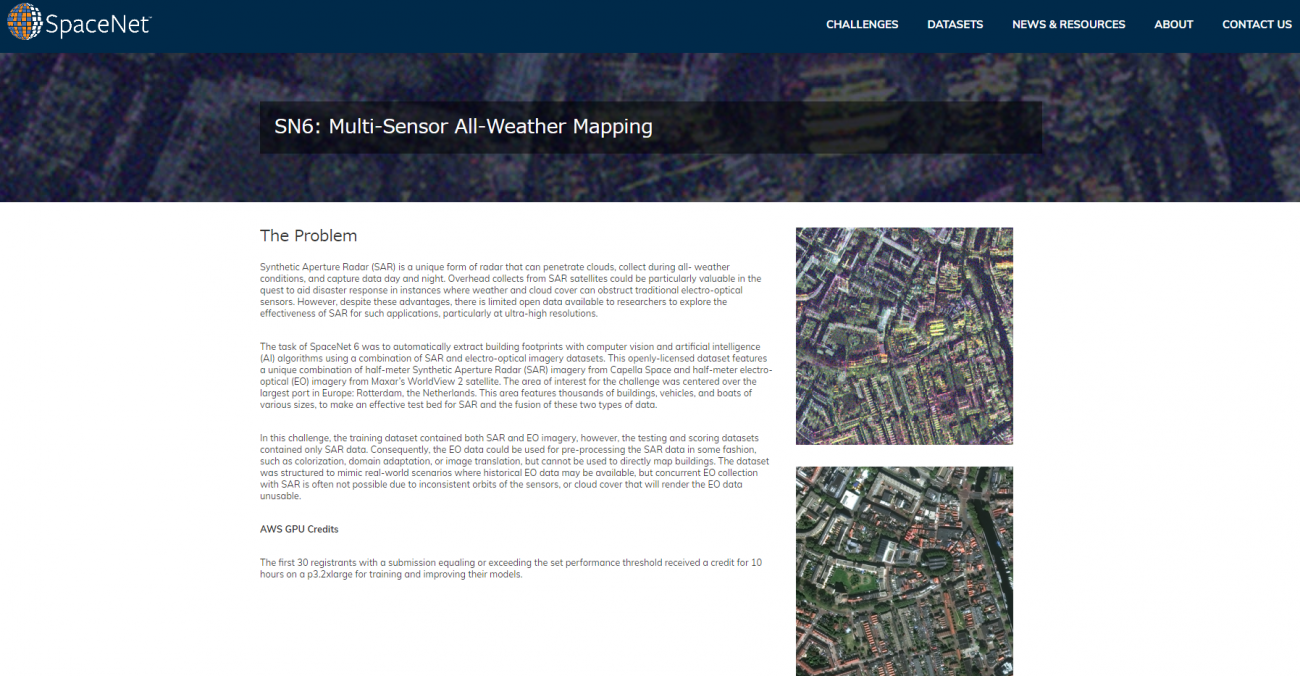
Although SpaceNet has hosted seven competitions using satellite images so far, not many of them have used SAR images.
In the 6th Multi-Sensor All-Weather Mapping, a competition was held to detect buildings using a combination of 0.5-meter resolution satellite SAR images and optical images.
5. Summary
This article has provided an overview of the coastline extraction competition using SAR images, which was launched on August 6, 2020, as well as an overview of the SAR images to be used as a dataset and some competitions and papers for reference.
Compared to optical images, satellite SAR images are still less available, and there are only a few competitions that have been held using them. In addition, it is difficult for the general public to visually understand SAR images due to their characteristics.
But that is why we think there is tremendous potential in SAR image analysis using machine learning.
We are looking forward to many of you joining this competition!
The 4th Tellus Satellite Challenge: Coastline Extraction
https://signate.jp/competitions/284