[Kaggle Competition Commentary Series] Identification of Sea Ice and Ships on Satellite Images
This article explains the analytical approaches that the top three winners took at the data science competition, Kaggle, to identify sea ice and ships from satellite images.
How do you learn data science?
The technology of data science, especially that of machine learning including ones of deep structure, is constantly advancing. Although you need to learn the latest approaches, there is a limit to what you can find on effective approaches to a specific problem from books or through websites. As the saying goes, “Seeing is believing,” we think the shortest way is to actually play around with data.
Recently, data science competitions are held around the world. These are competitions with rules and a reward where data scientists from all over the world compete on their analytical skills. This article introduces some competitions in relation to satellite data. In addition to this, the latter half of the article discusses the approaches employed by winners of a specific competition.
1. Data Science Competition
The most famous data science competition platform would be “Kaggle” owned by Google.
Organizations and enterprises set a challenge and prepare the related data for each competition, and they offer an award to individuals or teams who have achieved the best results within a time frame. Participants can win not only a cash prize but also an honorable title medal, which is an objective guide to their skill level. Some companies accept employees to participate in these competitions as part of their self-improvement program and utilize such competitions to evaluate the capability of candidates when hiring.
2. Kaggle's Satellite Data Competitions
What competitions have been held so far in relation to satellite data? Searching on Kaggle, you will see some competitions that are deeply related to satellites. Here are some of them:
- Understanding Clouds from Satellite Images: a competition that you detect and classify the patterns of cloud shapes
- Draper Satellite Image Chronology: a competition in which you organize satellite images in chronological order
- Airbus Ship Detection Challenge: a competition where you detect ships on satellite images
- Planet: Understanding the Amazon from Space: a competition in which you classify land coverage of satellite images
- Statoil/C-CORE Iceberg Classifier Challenge: a competition in which from satellite images, you classify objects as vessels or icebergs
It is interesting just to read the explanation of these challenges as all of them give a glimpse of the organizers’ expectations. Among them, we would like to take a closer look at the last one, “Statoil/C-CORE Iceberg Classifier Challenge,” which is similar to the ongoing competition on SIGNATE, “Detection of sea-ice using SAR data.”
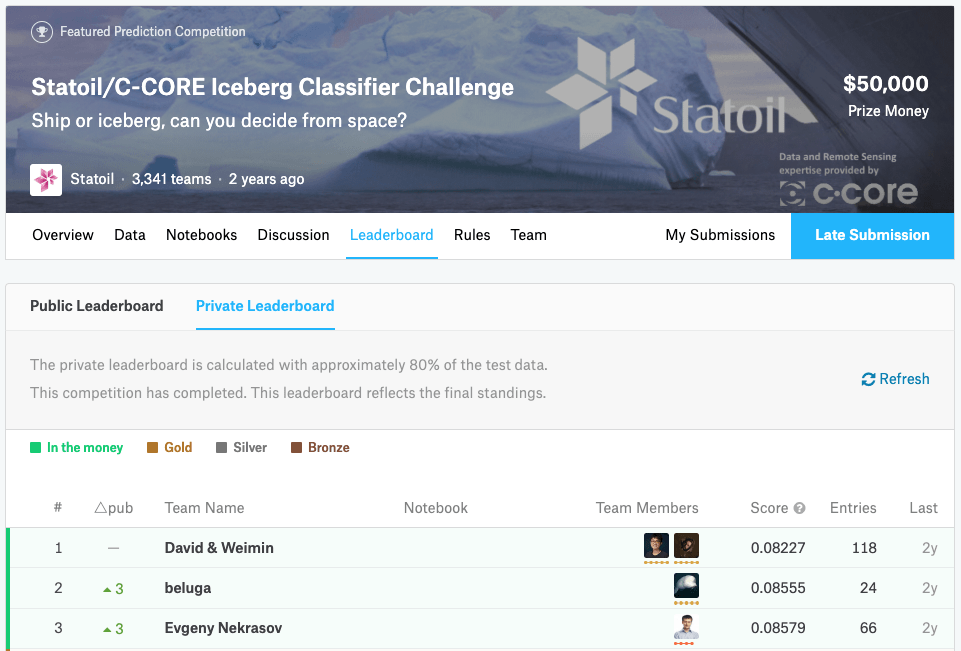
3. Overview of Statoil/C-CORE Iceberg Classifier Challenge
First of all, at the background of this competition lies the issue of navigation safety. It is important for ships on a voyage to detect icebergs for their safety. Crew members are currently physically searching by eye, but it gets difficult when the weather is bad. The organizing energy company, Statoil (current: Equinor) decided to hold this competition on Kaggle to identify icebergs more accurately. For your information, the total amount of prize money is $50,000 (first place: $25,000; second place: $15,000; and third place: $10,000).
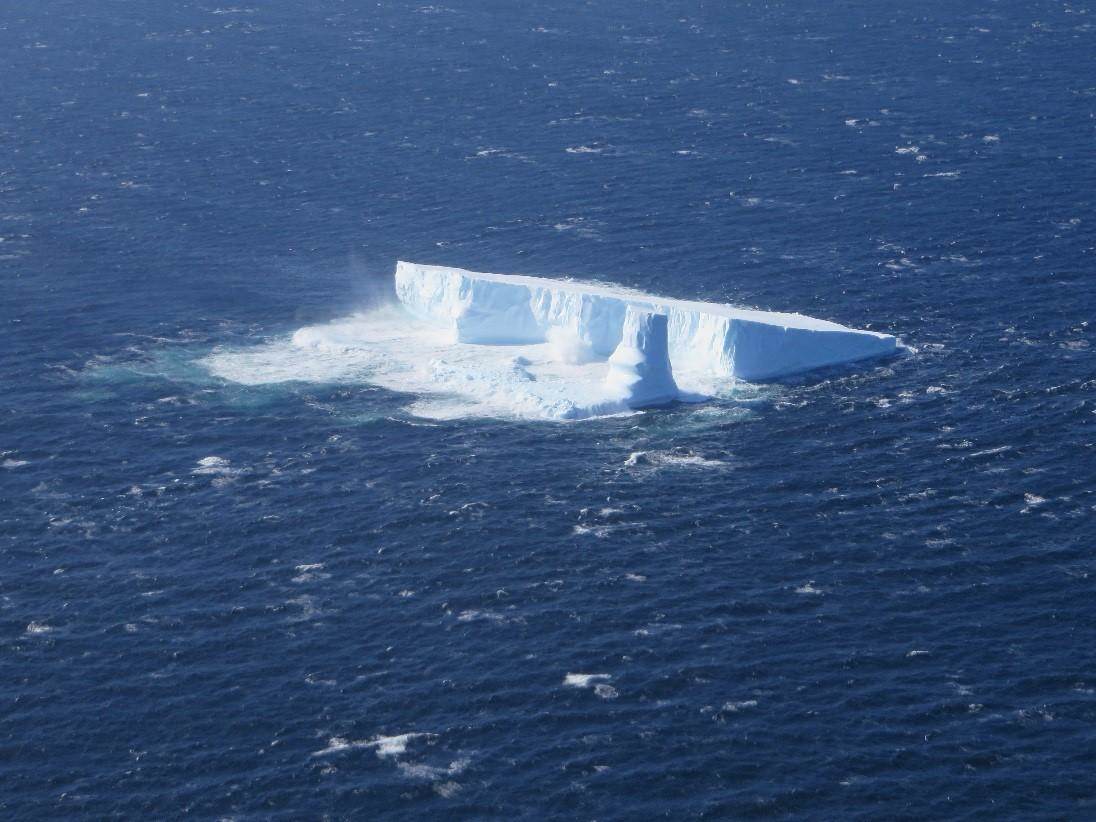
The tip of the iceberg poses a serious threat to navigation safety. Source : https://imgur.com/q7uAjTM
4. Data Provided for the Statoil/C-CORE Iceberg Classifier Challenge
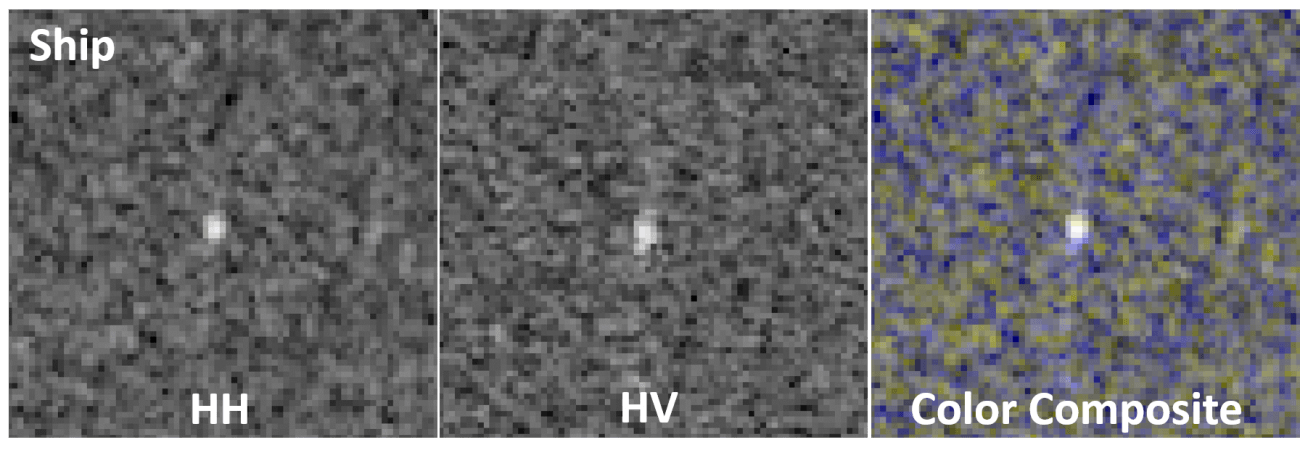
This competition provides radar images (HH and HV) of synthetic aperture radar (SAR) satellite, Sentinel-1, and asks you to observe and predict the probability that icebergs are found in these images. Regarding SAR, HH, and HV, please refer to the above article on SORABATAKE.
Apparently, the images include icebergs as well as ships that are indistinguishable from icebergs. Let’s look at the distinguishable one first.
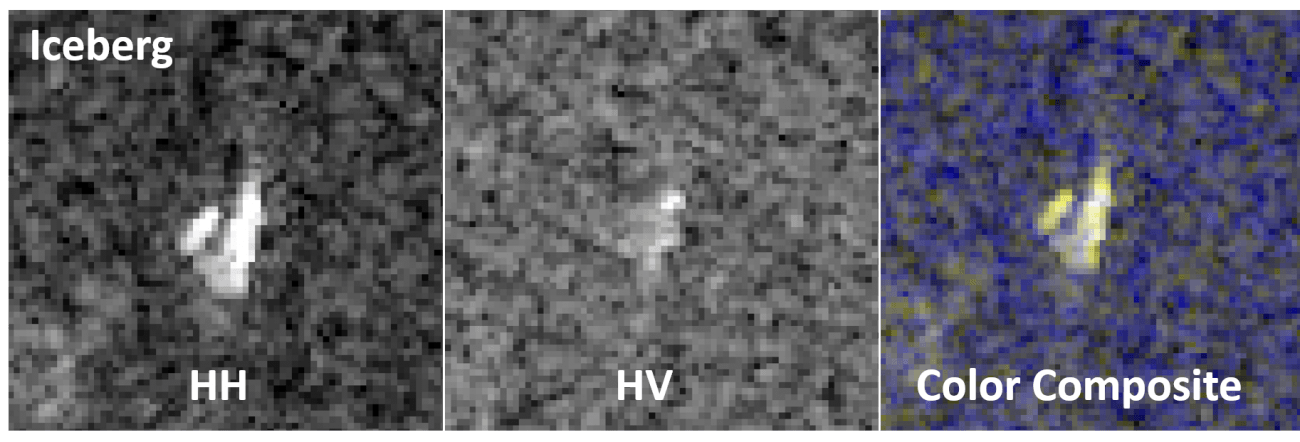
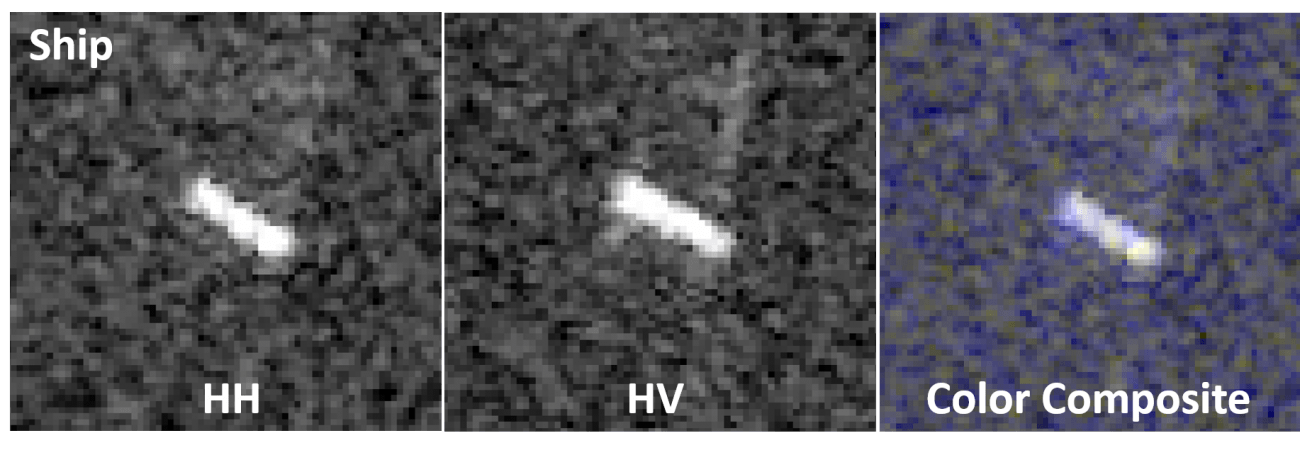
In this case, you can manage to tell the difference as the ship looks like a rectangle while the iceberg is triangular in shape. (though it might be difficult to know this if only one image is shown)
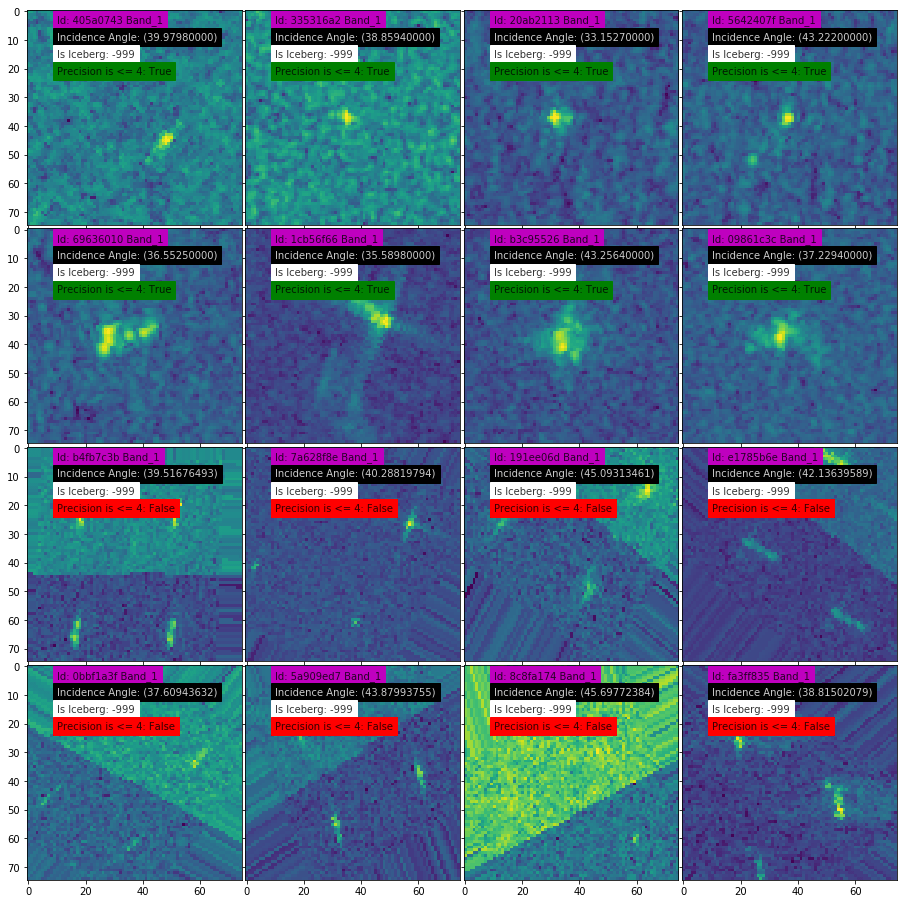
Then, let’s move onto the indistinguishable case.
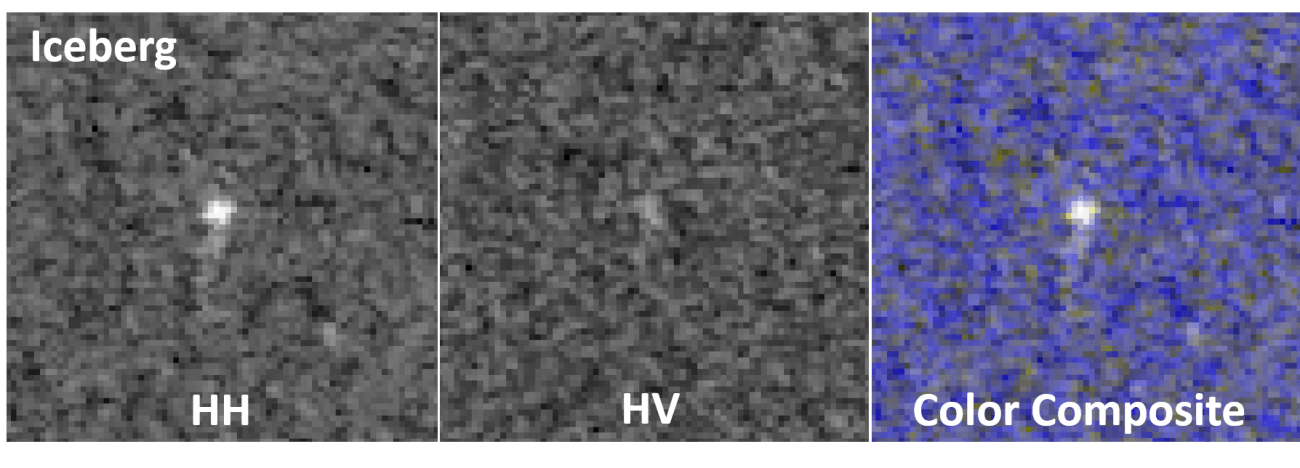
They all just look like dots. It is absolutely impossible to tell what they are. If a machine learning approach such as Convolutional Neural Network (CNN) is employed, it may become possible to detect icebergs that resemble nothing so much as dots because it can learn the characteristics of shapes found in an image and of reflection intensity that is hard to tell with a human eye. A total of 5,625 pieces of such 75 × 75 pixel images with microwave incident angle information are provided to the participants of the competition. Participants learn the probability that icebergs are found in the data and compete on to what extent they can apply it to unknown data.
5. Approaches Employed by Winners at the Statoil/C-CORE Iceberg Classifier Challenge
This competition ended on January 23, 2018, and the top three winners (teams) to whom the prize money is awarded are confirmed.
Approaches taken by the winners are available on the “Discussion” page on Kaggle. Now we are going to look at each of the top three winners approaches in the challenge.
The approach of the third-place winner:
The approach employed by the third-place winner is summarized here.
This winner used seven different models. The reason behind employing multiple models is, just like the saying, “Two heads are better than one” goes, combined results of multiple models are shown to obtain a better predictive performance. This method is called “ensemble learning,” and this winner adopted XGBoost (eXtreme Gradient Boosting) among others. XGBoost is a method that uses (or makes ensemble with) multiple decision trees. It is often used in competitions like Kaggle because of its relatively accurate performance.
Moreover, according to this winner, not only the image data but also the information on what microwave incident angle the satellite used were useful. In addition to the image models, the winner prepared models that deal only with incident angle that has improved the identification accuracy by using the incident angle data with the data included in the image.
The importance of the incident angle was also pointed out in the information shared during the competition. That is, “you can tell whether the image is automatically generated or not by looking at the degree of incident angle.” To be more specific, the organizer augmented data by automatic generation, but you can determine whether each image is augmented or not from the number of decimal places of the degree of incident angle.
Based on this information, the third-place winner further conducted analysis. Focusing on the existence or non-existence of the surrounding objects, the winner has noticed that incident angle can be used as an indicator; it is highly likely to be a ship if there are no objects around or an iceberg if it is surrounded by some objects.
Oddly enough, the incident angle is an observation condition of satellites and is not directly related to the existence of objects. This, I believe, is because if the incident angle becomes greater with respect to the sea surface, the object’s reflective area on the sea surface also gets larger, which therefore increases the possibility of detecting small objects. In short, as the greater incident angle makes it easier to detect the surrounding objects, the more accurate prediction might become possible utilizing the measure of the incident angle.
(Reference: National University of Singapore Website)
The approach of the second-place winner:
The approach employed by the second-place winner is summarized here.
This winner prepared hundreds of CNN (Convolutional Neural Network) models with different random parameters. Instead of using a few deeply-learned models, the winner employed a strategy to prepare and make ensemble with a number of weak models using the following three main models:
- CNNs that directly inputs two channel images (HH and HV). These were trained from scratch.
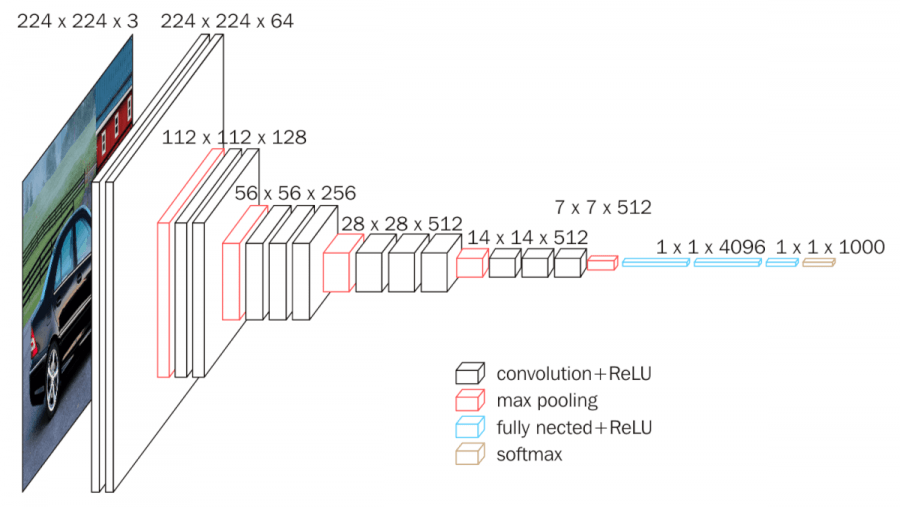
- CNNs that inputs three channel images by adding the average pixel value of HH and HV. The transfer learning of VGG16 (a famous 16-layered CNN model) was conducted.
- A model in which the data was doubled by pseudo labeling (although it was not much help).
Then, the second-place winner excluded data without incident angle and, just like the third-place winner, employed XGBoost to make ensemble with the models. The winner used more models for ensemble than the third-place winner, which led the second-place winner to better accuracy even if the accuracy of each model was low.
This winner commented, “I do not have my own GPU which is actually quite painful in computer vision challenges.” Given such a background, the winner has proved that images can be learned in a CPU environment with some extra effort. There is much to learn from this winner when dealing with large satellite data.
The approach of the first-place winner:
The approach employed by the first-place winner is summarized here.
The overview of this winner’s approach is as follows:
The winner trained more than 100 models including the famous ones such as VGG and GoogLeNet. They include models using incident angle.
- The 100+ CNN models were visualized (as below) and divided into two groups: a group in which the data is easily predictable from an incident angle (Group 1) and a group in which the data is hard to predict from an incident angle (Group 2).
- Then, they are re-trained using the data of a less predictable group (Group 2) to improve accuracy.
As with the second- and third-winners, the first-place winner also ensembled over 100 models to improve accuracy.
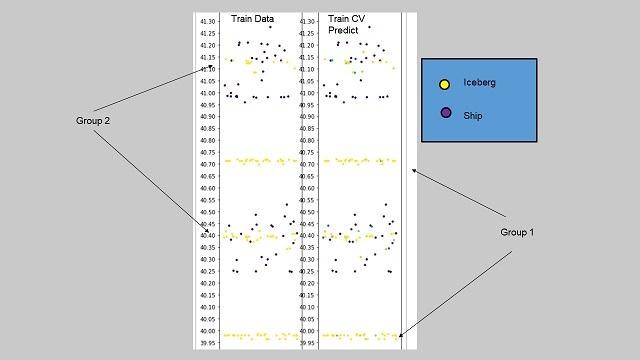
Moreover, the first-place winner focused on the incident angle like the third-place winner. In the figure above, the vertical axis indicates incident angles, and each of the dots on the horizontal axis represents an image. From this figure, it is possible to distinguish between iceberg (yellow dot) and ship (purple dot) to a certain extent. But there are also ranges of angles where both icebergs and ships exist (Group 2). Then, after the models learned all the data, the winner provided them with additional training on a less predictable group (Group 2). In other words, the winner had the models overcome their weakness by giving them intensive training on the tasks they are not good at.
Instead of beginning with the construction of models, the first-place winner captured the essential features of the data and then developed an appropriate strategy for it. This analytical procedure taken at the beginning to understand the features and structures of data is called exploratory data analysis (EDA), which is a very basic aspect of data analysis. As a result of combining the EDA and advanced ensemble learning, this winner won the crown.
6. Summary
When I was a student, my instructor told me, “Do not begin with the analysis of the observed data, but visualize the data and focus on its essential features.” All the winners of this competition examined the data that they had, considered its relationship to the outcome, and then actually utilized it. We usually tend to focus on fancy models or approaches (such as CNN), but the first-place winner has noticed the importance of the incident angle and applied the knowledge to the models and learning. The winner’s approach that the models first complete preliminary training and then are reinforced by re-learning only indistinguishable data found in the EDA can be considered a good example of good data science. After all, the fundamentals are important.
The winners also employed ensemble learning that deals with multiple models as common sense. This method is based on the idea that the accuracy can be improved comprehensively by preparing multiple models instead of building up a single model. Dealing with a lot of models, the ensemble learning, especially with images, tends to increase the cost of calculation including the learning process of each model. However, the second-place winner could manage to achieve results without a GPU machine. It is indeed an excellent approach of utilizing limited calculation resources efficiently. I am very inspired because I also had a lot of trouble using a GPU environment due to its costs and the complicated procedures for facilitating a machine learning environment.
As seen above, winners’ approaches are usually shared after the competitions. Even though you cannot win a prize, you can gain a new insight if you participate in such competitions. Although it is very difficult to find an appropriate approach for utilizing machine learning, participating in such competitions allows you to have access to the approaches of skilled participants and to compare your own approach with theirs. Why not try it yourself? It will be a great opportunity to improve your skills efficiently.