Check out sea surface temperature and chlorophyll a concentration! SHIKISAI (GCOM-C) satellite data is released on Tellus!
In this article, we introduce an overview of GCOM-C SHIKISAI, which was installed in Tellus on December 11th, and about how to look at the data of sea surface temperature and chlorophyll a concentration.
We have been releasing satellite data of a satellite SHIKISAI (GCOM-C), which observes climate change, on Tellus since December 11th, 2019.
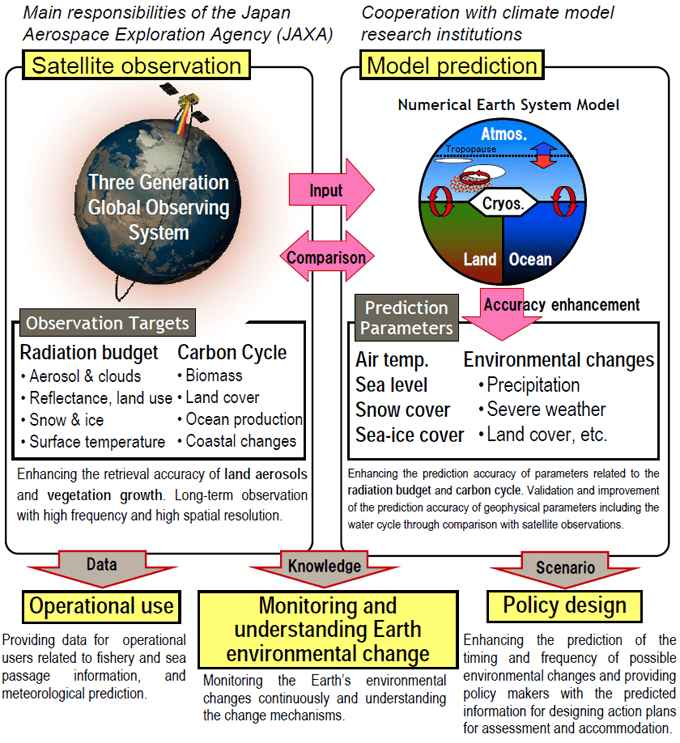
SHIKISAI is a satellite that observes the current status of climate change. Data that can be collected from SHIKISAI includes distribution of plants that spread over the land and sea, clouds, and ice, earth and sea surface temperatures, and the amount of fine dust in the atmosphere. This kind of data is expected to be used not only for observing global environmental changes, disaster monitoring, and resource management, but also for understanding the growth of agricultural crops, situations of yellow sand, and finding fisheries. What’s more is this data can be used freely by any person.
In this article, we introduce data overview of SHIKISAI installed on Tellus and case examples of data utilization.
(1) Data overview of SHIKISAI
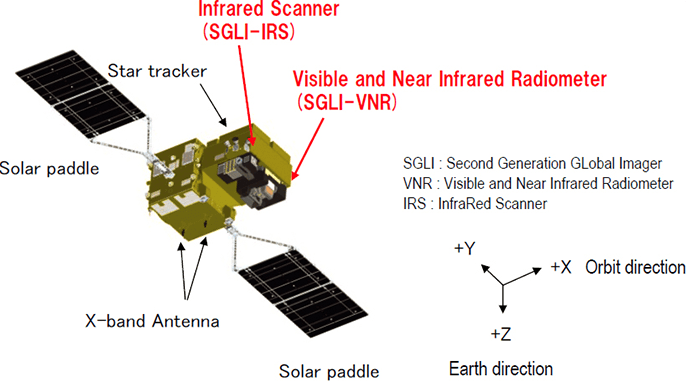
Optochemical sensor “SGLI” installed on SHIKISAI can observe thermal infrared areas (380nm~12 μm) near ultraviolet by 19 channels. It observes data of 28 items related to climate change across the 4 zones of atmosphere, land, sea, and snow ice, including aerosol, distribution of plants, and it can physically half the earth in 1 day and the whole earth in two days.
Please refer to this article about wavelength.
What is the wavelength of light? Why can an artificial satellite see what human eyes cannot see?
Please take a look at the following article, in which we introduce the performance and survey target of SHIKISAI (GCOM-C).
What exactly is GCOM?
There is a satellite called SHIZUKU (GCOM-W), who went to space a little earlier than SHIKISA, and can be considered an older brother (or sister). Both SHIZUKU and SHIKISAI have been created under the GCOM project (Global Change Observation Mission), which intends to investigate the changes in environment on a global-scale over a long term.
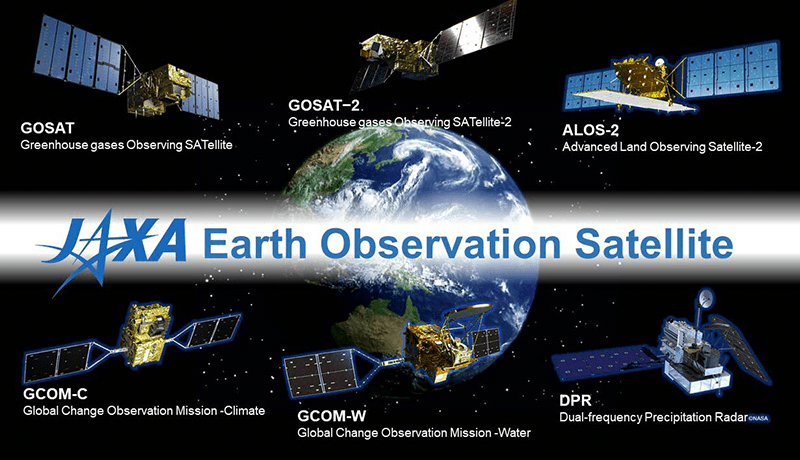
Roughly speaking, SHIZUKU is a satellite that mainly observes the amount of precipitation, water vapor, speed of wind, temperature, the sea, soil water content, and snow cover, whereas SHIKISAI mainly observes the clouds, aerosol (dust in atmosphere), ocean color, vegetation, and snow ice.
※W of SHIZUKU GCOM-“W” stands for water and C of SHIKISAI GCOM-“C” stands for climate.
(2) Data of SHIKISAI that is installed on Tellus
Of the data we have introduced, we released the following two kinds of Tellus data as of December 11th, 2019.
We plan to add other data sequentially.
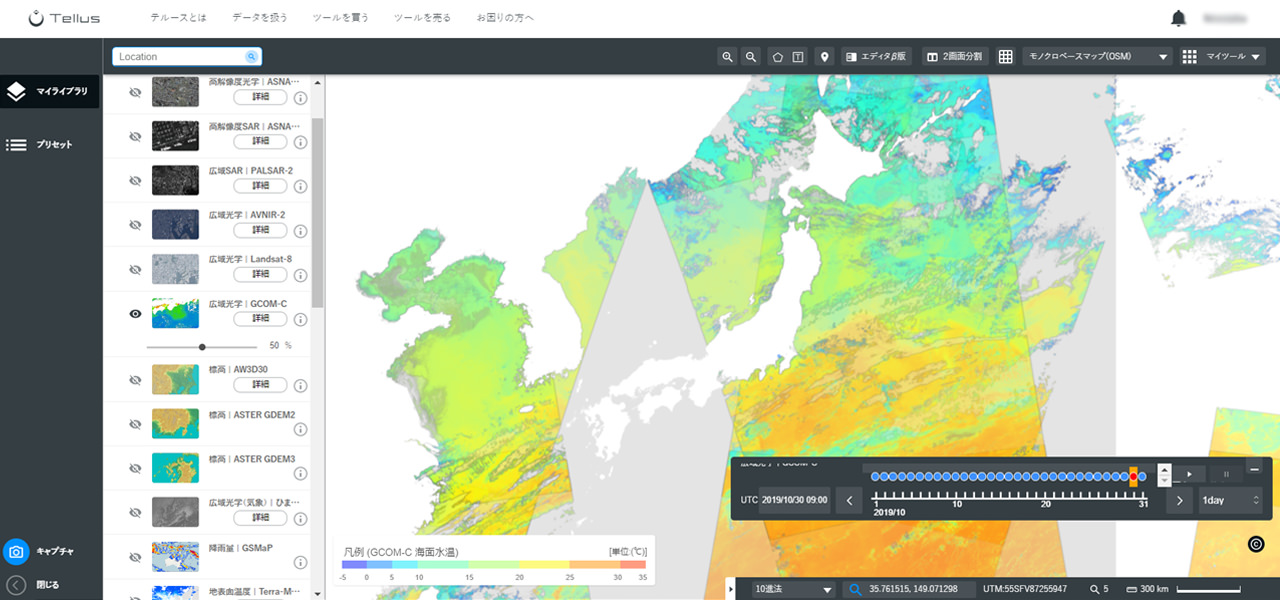
Sea surface temperature
SHIKISAI can observe Sea Surface Temperature (hereinafter referred to as SST) by the infrared light of electromagnetic waves.
By looking at SST, we can understand the temperature distribution and tide flow of warm and cold currents, and that will help us estimate where fish gather, which will make it possible to find out a specific fishery before going fishing.
Also, by accumulating the observation data of SST, we can investigate the impact of seawater temperature change to the climate.
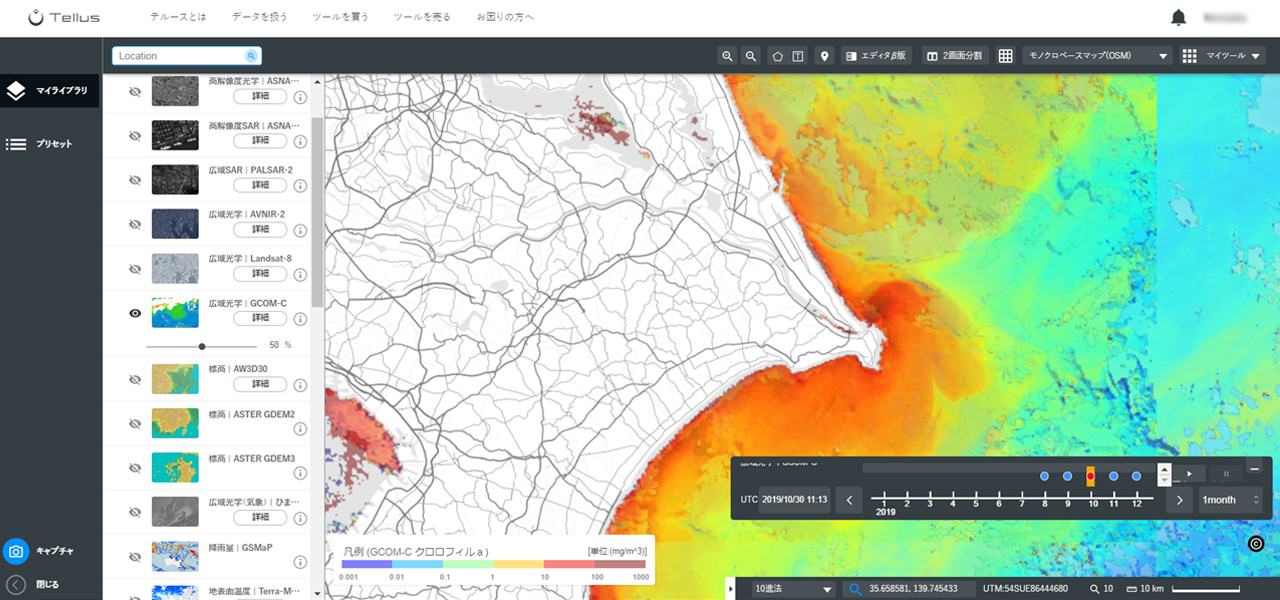
Chlorophyll a concentration
Chlorophyll a concentration is photosynthetic pigment that a lot of phytoplankton have. Because most plants have this pigment, chlorophyll a concentration observed in waters shows the amount of phytoplankton.
Because this phytoplankton will become food for zooplankton and fish, by looking at the observed data of chlorophyll a, we can search for ocean areas with many fish- a new fishery!
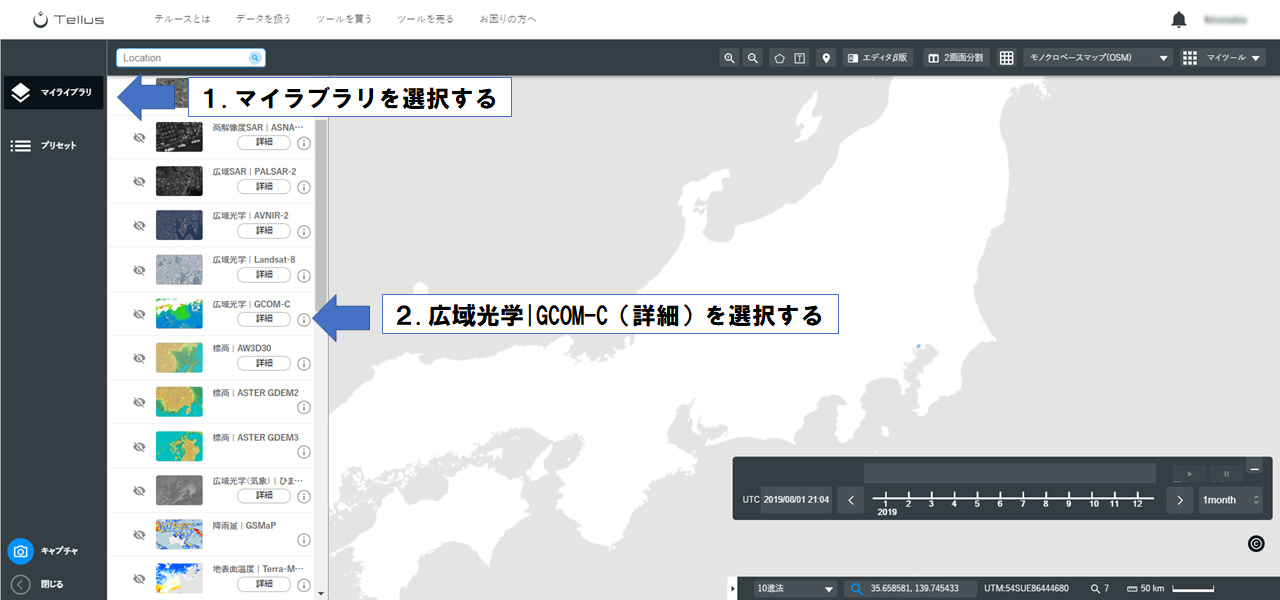
(3) How to check the data of SHIKISAI by Tellus OS
Log in to Tellus OS
First, make an account by inputting the necessary information and log in to Tellus OS.
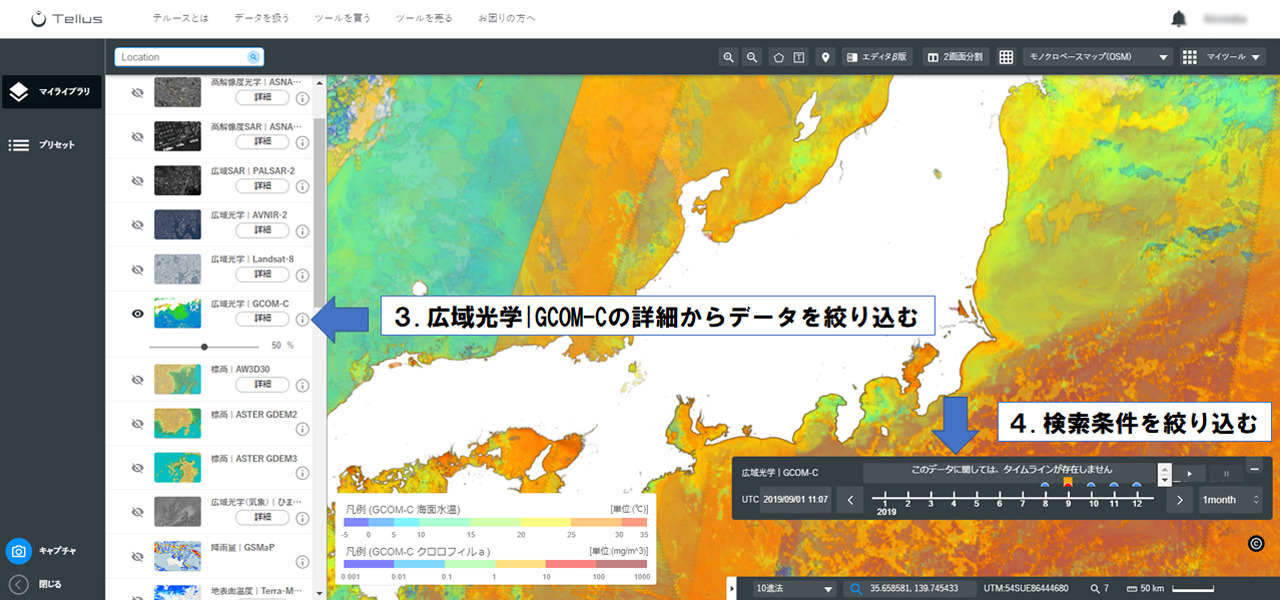
Choose GCOM-C from meta data search.
Search criteria can be narrowed down by inputting SST and chlorophyll a.
Data of the following criteria is installed.
(4) Summary
We have introduced SHIKISAI, which was released on December 11th, 2019. There is only one month of Tellus data so far, but more data will be updated as needed.
In 2017, SHIKISAI was launched, and data release started in 2018. We have been receiving utilization examples since the release of data, and the best will be announced on December 20th, 2019 at the GCOM satellite utilization symposium.
SORABATAKE editorial department is also trying to find fisheries by utilizing SHIKISAI, and results can be found in this article “Literally scales dropping from our eyes! The catch from fishery we found by the satellite data was amazing.” It may be fun for you to think of other examples of utilization using SHIKISAI!