Data Science competition of Sea ice detection : its purpose points on images
On October 4th, 2019, the "3rd Tellus Satellite Challenge", a satellite data analysis competition, began at SIGNATE. The theme of this contest is "detection of the sea-ice area." This article will explain the purpose and points to be considered on images.
The 3rd Tellus Satellite Challenge, a satellite data analysis competition, started at SIGNATE on October 4, 2019. The theme of this contest is “detection of sea-ice area.”
[Competition Website]
https://signate.jp/competitions/183
This article explains the outline of this competition as well as the significance of detecting sea-ice area and the key terms of “SAR” and “polarization” in the competition.
(1) Outline of competition
-Duration of the contest
2019/10/4 – 2019/11/30
-Purpose
To improve the accuracy of the sea-ice area detection using satellite data.
-Learned data
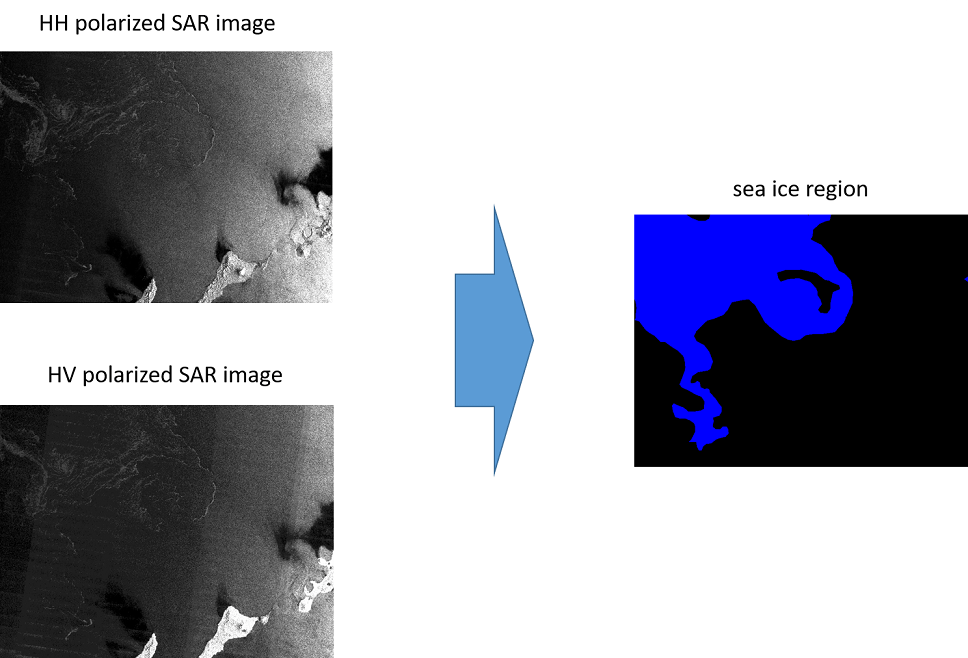
-80 satellite data (scenes) each of HH polarization and HV polarization (described later) for waters around Hokkaido (Total: 160 scenes)
-80 labeled data pictures corresponding to the satellite data scenes above (the correct answer for sea-ice areas)
-Use of external data
Using data other than that distributed by this competition (for learning and prediction) is prohibited.
-Evaluation indicator
Intersection over Union (IoU)
*For each of the 40 data evaluations (40 pictures of HH polarization and HV polarization), the overlapped region (IoU) of the predicted area and the correct area is calculated. The average IoU of the 40 data evaluations is also calculated.
The first winner will receive an award of one million yen. The second and the third winners will be awarded 600,000 yen and 400,000 yen, respectively. This contest will be a great opportunity for both people who have already participated and those who are new to trying ideas out!
Details of the contest are available at:
The 3nd Tellus Satellite Challenge
(2) "Detection of areas of sea-ice" is key to sea accident prevention
What are the merits of sea-ice area detection?
To begin with, we would like to discuss the definition of sea ice. Speaking of ice on the sea, we guess the term “drift ice” sounds more familiar, however, there is also ice which is not drifting. For this reason, the different types of ice on the sea are collectively referred to as “sea ice.”
In the background, the reason we need to detect sea ice lies with the establishment in 1970, of the Ice Information Center, Japan.
In 1970, a massive drift ice sea accident occurred around Iturup Island. Back then, it was not possible to grasp the dangerous sea-ice situation accurately, which caused considerable damage.
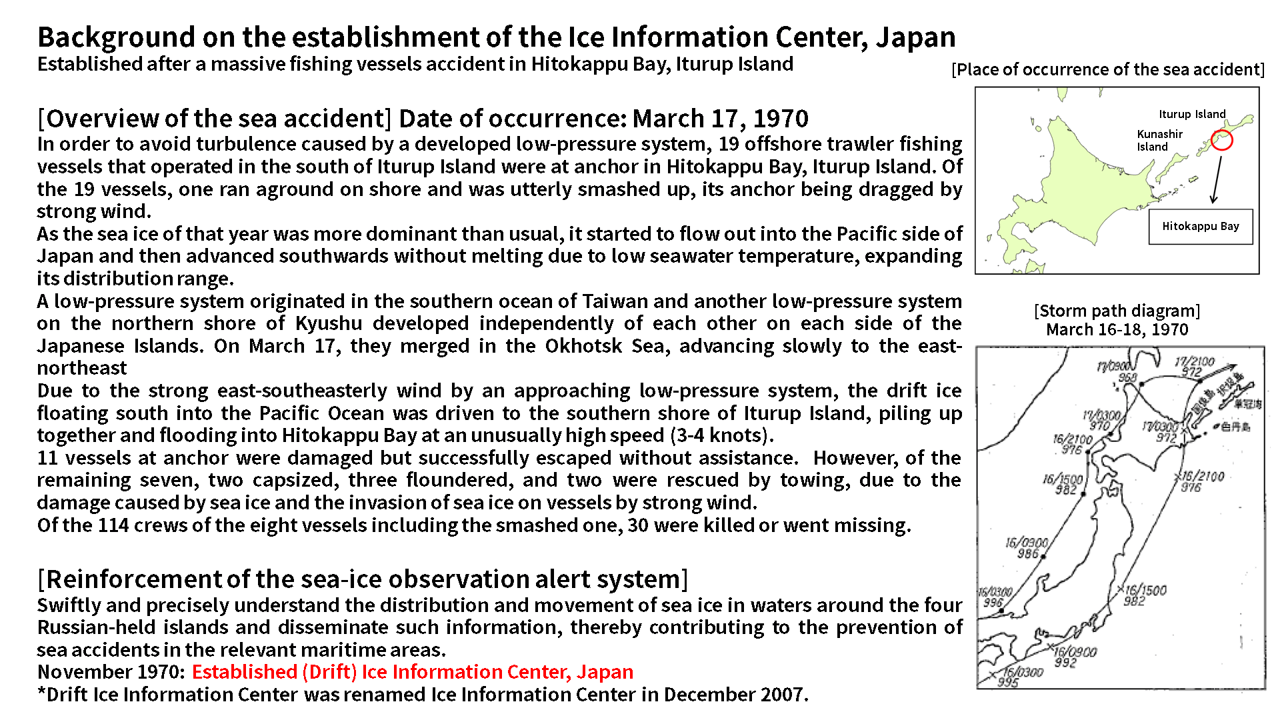
In order to prevent sea accidents, it is important to grasp the distribution and movement of sea ice swiftly and precisely, and then to bring the obtained information accurately to people working on the sea.
(3) The four methods available for "detection of areas of sea-ice"
The following four methods are currently used to detect sea ice. *Source: “Kaiyo Gaiho (Kaihyohen) Hokkaido Shuhen no Kaihyou Jyokyo [Ocean Summary Report (Sea Ice): Sea-ice Conditions around Hokkaido]”
(1) Observation from the coast
(2) Observation by vessels
(3) Observation by airplanes
(4) Observation by satellites
Each method has both merits and demerits.
Regarding observations from the coast and by vessels, it is possible to observe closely and precisely; however, their scope of areas visible from observation spots are relatively small compared with those of other methods.
On observation by airplanes, while it is possible to fly airplanes anywhere needed and conduct them accurately, the frequency of observation flying is limited.
Although the fourth option of observation by satellites has the lowest resolution amongst the methods, as it conducts observation from the farthest spot, it can perceive and show extensively the condition of the sea surface. In addition, it is said to be the method that can conduct observation continuously compared with observations by vessels or airplanes as satellites are orbiting the Earth once they are launched.
[Reference]
Introduction of Ice Information Center, Japan
As a matter of fact, it requires a high level of skill to make out sea-ice areas from satellite data.
This competition, therefore, is designed to develop the algorithms that can detect sea-ice areas on satellite data with a high degree of precision so that people without specialist skills can also make out these areas.
(4) Key terms for this competition: "SAR" and "polarization"
- SAR: satelite data with cloud-resistance feature
The satellite data used in this contest is called SAR data.
It is generated by the reflection of the electric waves actively emitted by the satellite. (For more detail, please refer to “The fundamentals of synthetic-aperture radar (SAR): cases, obtainable information, sensor, satellite, and wavelength“)
Unlike the optical image that captures the reflection of sunlight, the SAR image can grasp the situation of the ground surface even at night or if covered by cloud.
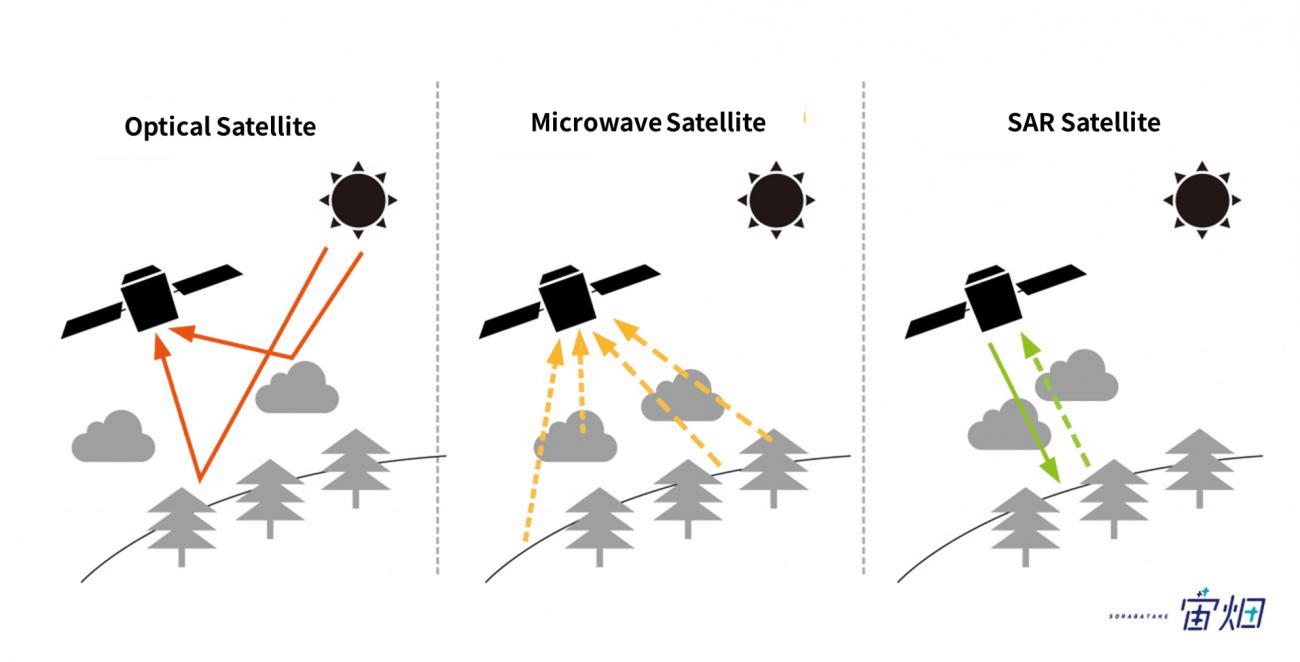
We can say that SAR data is suitable for “detection of sea-ice area,” as it is difficult to capture the surface with optical satellites under bad weather conditions.
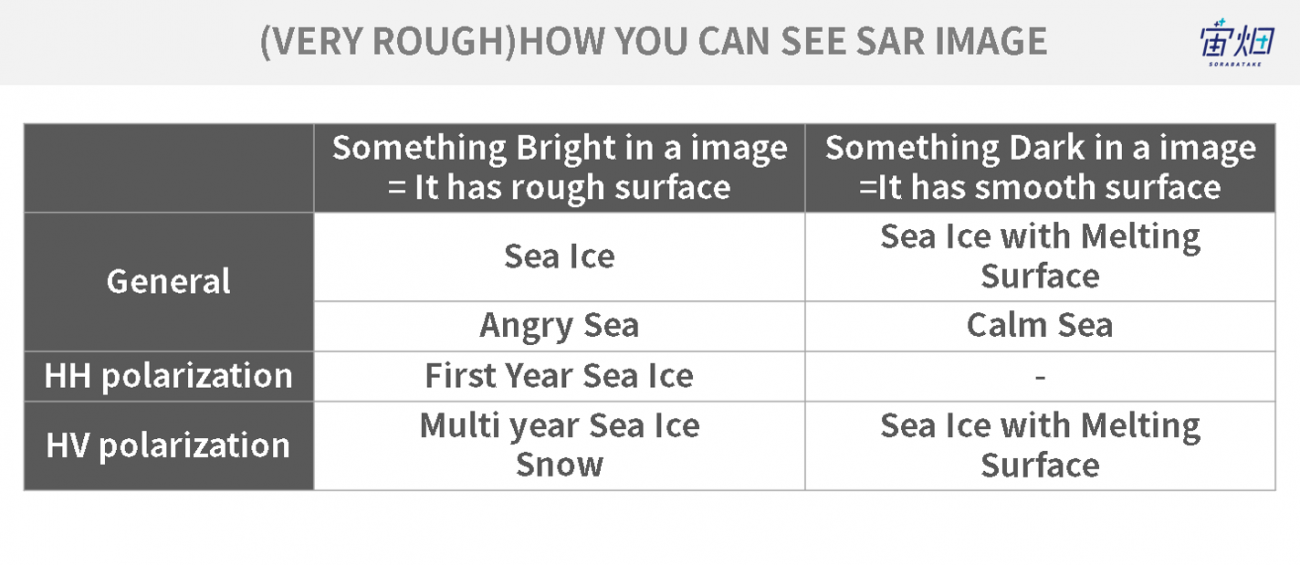
- The brightness of the "SAR" image is determined by roughness of surface
With SAR data, a rougher surface looks white as it scatters the electric waves and some are reflected back to the satellite, and a smoother surface looks black as it reflects the waves totally.
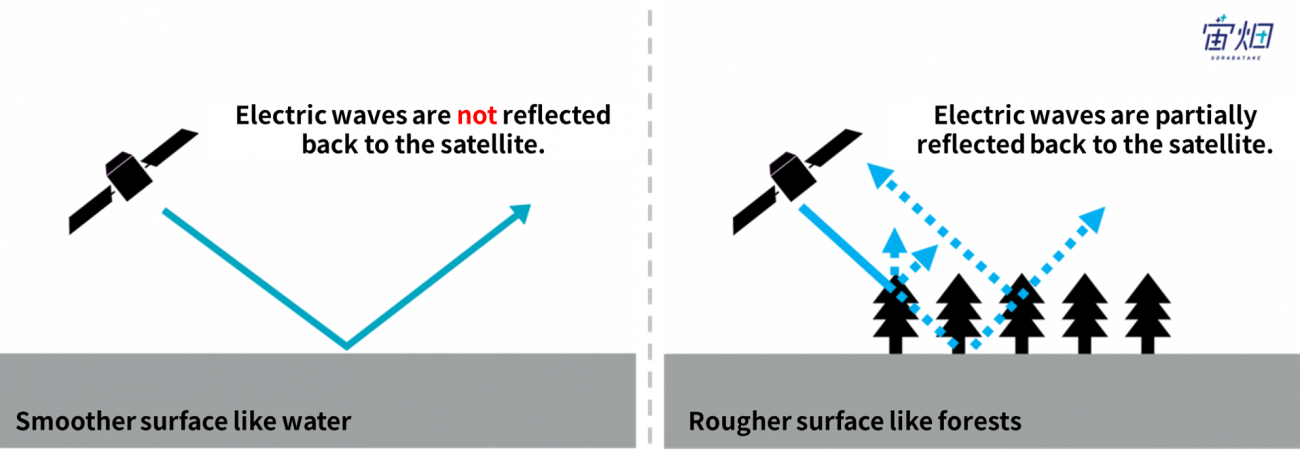

Applying this characteristic to our theme, sea ice, we can assume that the surface of sea ice is usually rough, which reflects more electric waves back, and thus looks bright.
Conversely, as the temperature rises and the surface is starting to melt, the reflective surface gets smoother and the satellite receives less waves back. As a result, the image looks dark.
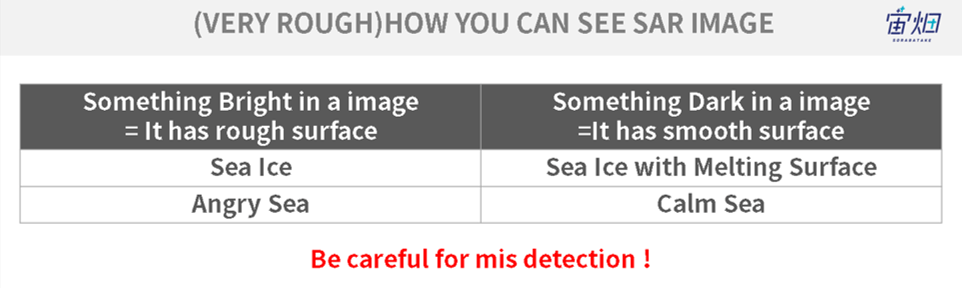
We also have to be careful when the sea surface becomes rough.
It seems likely that it gets difficult to distinguish sea ice from the sea surface because it also looks bright as it becomes rougher by strong wind and tidal waves.
The following table briefly summarizes the features.
- "Polarization" helps to get to know more about ground surface
The word “polarization” appears frequently on this contest’s website. “Polarization” is one of the SAR’s features.
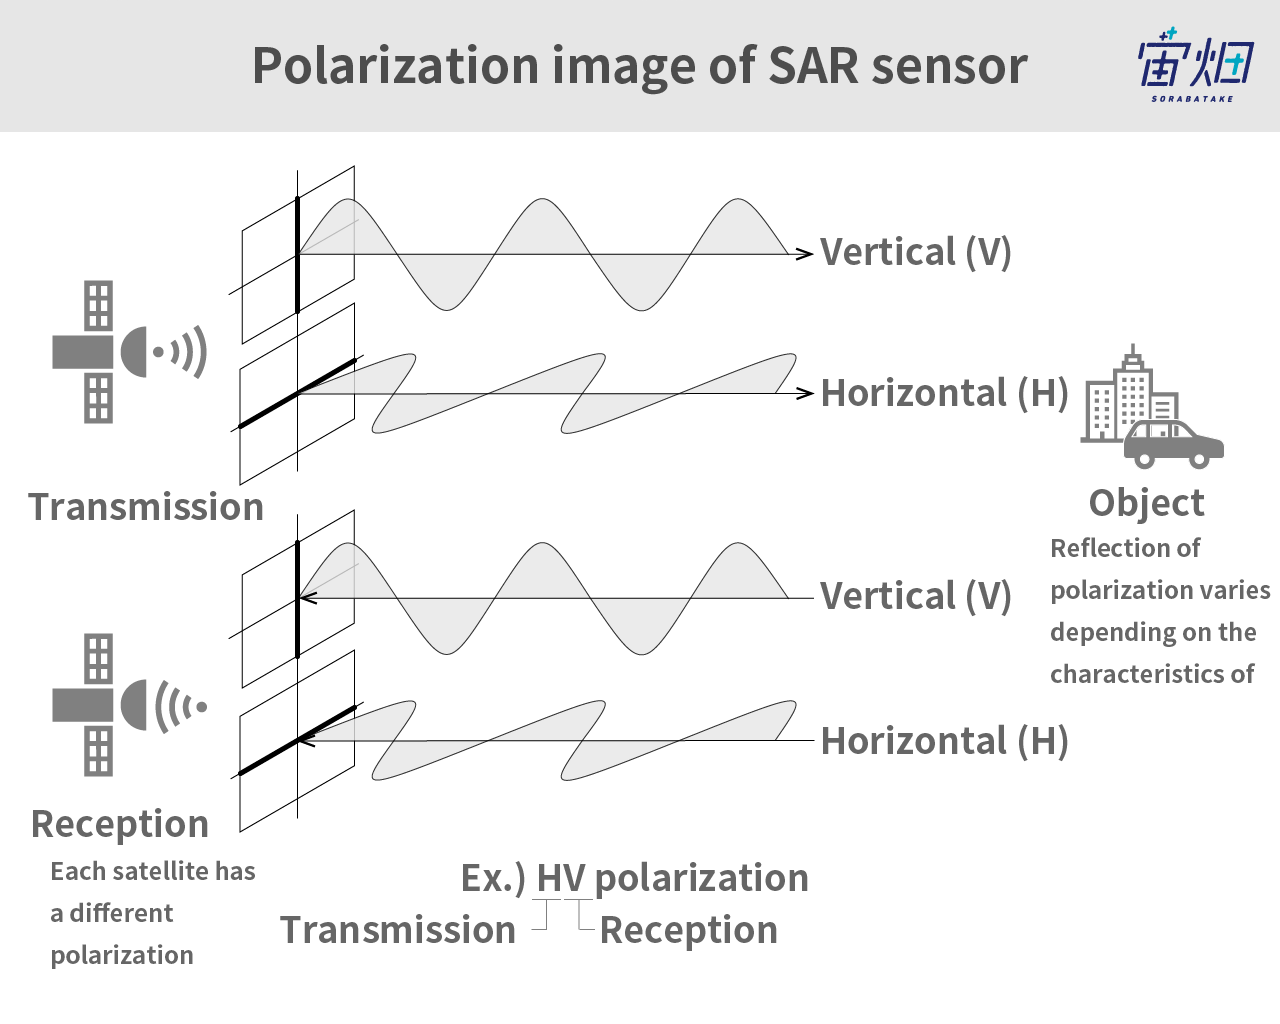
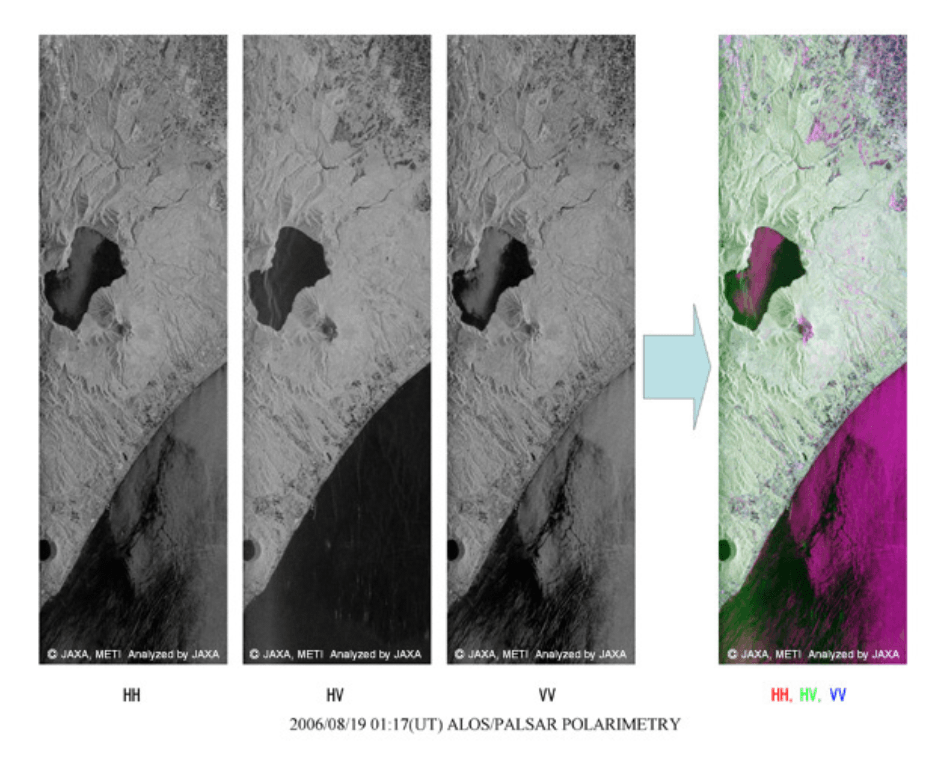
As shown in the figure above, electric waves of SAR sensor are divided by the direction of vibration: horizontal polarization (H) and vertical polarization (V).
For example, if an electric wave emitted as horizontal polarization is received horizontally, it is called HH, and vertically, HV. Likewise, for an electric wave emitted as vertical polarization, if received vertically, it is called VV, and if horizontally, VH.
The details are beyond the objective of this article. In short, the reflection intensity of polarization depends on the characteristics of objects (surface characteristics, salt content, etc.).
For example, we can distinguish urban area with many buildings from forests, using polarization.
In an area filled with objects with smoother surfaces including buildings, the waves are received without changing direction, and thus HH/VV signals become strong and HV/VH signals become weak.
On the other hand, waves are received facing different directions in area with uneven surfaces such as forests. Accordingly, HH/VV signals become weak and HV/VH signals become relatively strong.
In this contest, two kinds of pictures, HH polarization images and HV polarization images, are distributed.
There are some distinctive differences between these two images in terms of the appearance of sea ice.
(1) Ages of sea ice
There is newly created sea ice (first-year ice) and repeatedly growing sea ice (multi-year ice). They contain different amounts of salt due to their differences in thickness (thicker ice contains less salt), which results in the difference in reflection characteristics.
The first-year ice looks bright in HH polarization images while the multi-year ice looks bright in HV polarizations.
(2) Accumulation of snow
It is said that the reflection of waves gets stronger with increased amounts of snow, and the ice looks brighter in an HV polarization image.
(3) Melted sea ice
As stated above, the melted sea ice looks dark, especially on an HV polarization image.
Since it is getting a little confusing, please look at the summary of sea ice appearance on the SAR data below.
Try detecting sea ice on SAR data, utilizing these characteristics to control detection errors!
The deadline is November 30, 2019.
Details of the contest are available at:
The 3nd Tellus Satellite Challenge
Reference
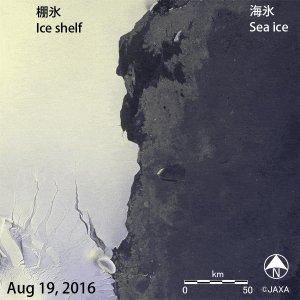
「だいち2号」による南極半島Larsen-C棚氷で発生した大規模な氷山分離の観測結果