Vessel Detection— Introduction of the analytical approaches used by the winners of the 2nd satellite data analysis contest
We are going to introduce the analytical approaches used by the top three winners in the “Tellus Satellite Challenge”, a vessel detection algorithm competition using satellite data.
(1) What is the purpose of the Tellus Satellite Challenge?
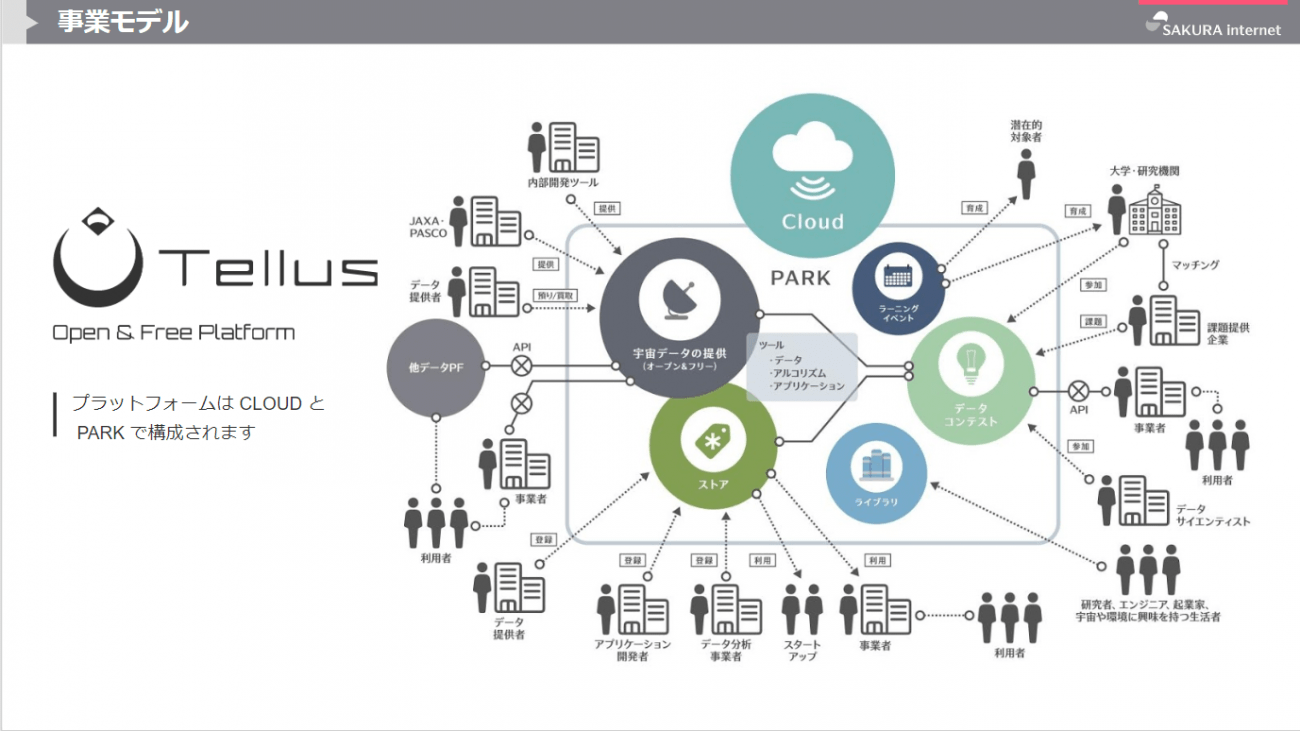
Tellus is a satellite data platform business designed to utilize satellite data in industrial fields, aiming to “double the size of the space industry market by the early 2030s”, stated in Space Industry Vision 2030 by the Japanese Government.
Tellus Satellite Challenge is a data analysis contest, held by Tellus, to promote utilization of Tellus by introducing examples of satellite data utilization, discovering excellent data scientists, and making satellite data known to the public.
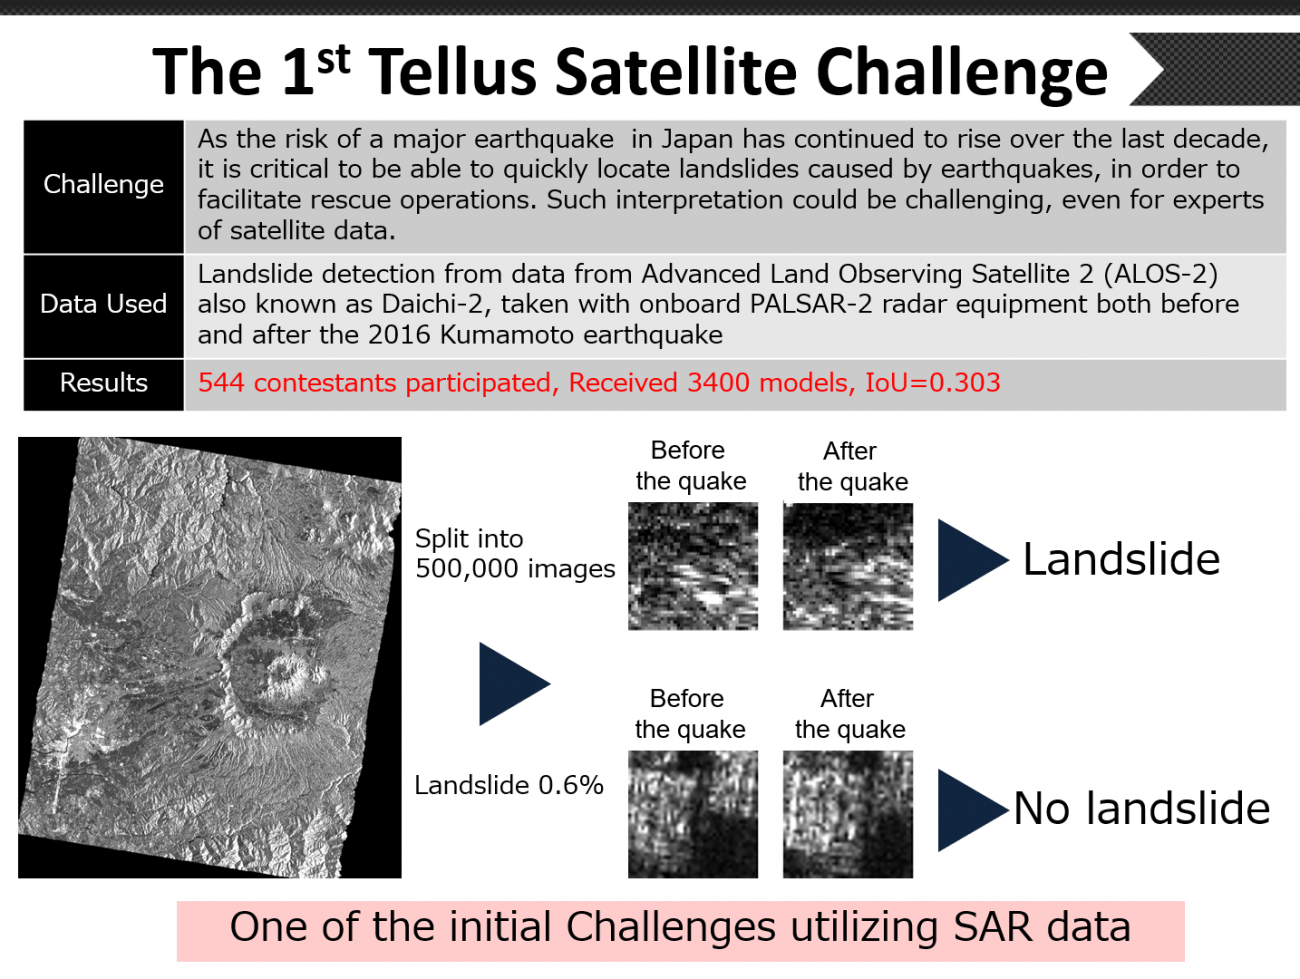
The theme of the first Challenge, held in October 2018, was the detection of landslides in the Kumamoto earthquakes using Synthetic Aperture Radar (SAR) data, and 544 participants from both home and abroad submitted a total of 3,400 models for this Challenge.
As a result, it has developed exceptionally in depth educational models, spreading analytical knowledge to many experts, and a deeper understanding of actual satellite data analysis (especially special data known as SAR). Please refer to this previous article The First Satellite Data Analysis Contest Report -The answers and what to look forward in the 2nd Challenge to learn about the winners’ approaches.
This article explains the 2nd Tellus Satellite Challenge; vessel detection in waters using high-resolution optical satellite data, focusing on the purpose of this Challenge and the approaches of winners.
(2) Focus of the 2nd contest's theme
The theme of the 2nd Challenge is to develop AI that detects vessels in waters. As an island surrounded by ocean, Japan actually has the 6th largest exclusive economic zone, including the waters surrounding this nation. Consequently, deep analysis of vessel activities is a significant theme of industrial activities including water transportation, fishery, safety, and national protection.
However, it is easy to imagine that vessel monitoring is far from easy due to the geographical vastness of the surrounding waters. This is when (artificial) satellites can really comes into play. For the 2nd Challenge, we aimed to develop a high-accuracy vessel detection algorithm of the waters, utilizing data from satellites, which allows extremely good observation over a wide area.
In addition, we tried to determine whether vessels were in motion or not and the actual types of vessels based on the high-resolution nature of satellite data used for this Challenge. How far can current AI technology detect objects using high-resolution optical satellite data? It is expected to be used in a variety of situations with the outcome of increased accuracy and precision of vessel identification, such as type and vessel registration.
ASNARO-1, high-resolution optical satellite data from the Advanced Satellite with New system Architecture for Observation (ASNARO) series, was used for this contest. ASNARO-1 is an artificial satellite with a ground resolution of 0.5 meters or less developed by NEC Corporation entrusted by the Ministry of Economy, Trade and Industry (METI).
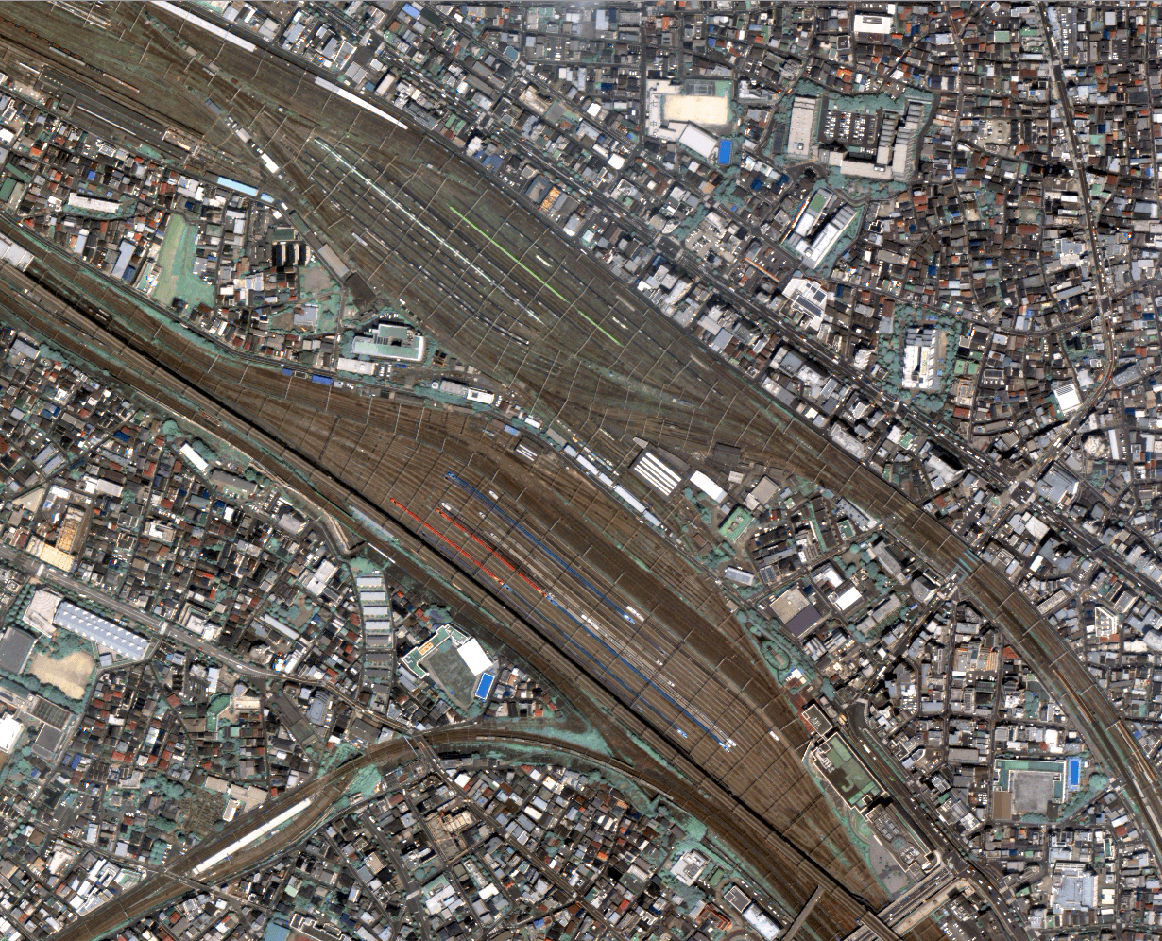
This is a scene of the Tokyo Shinkansen Depot and its surroundings in Tabata, Tokyo. Various construction can be seen with the naked eye.
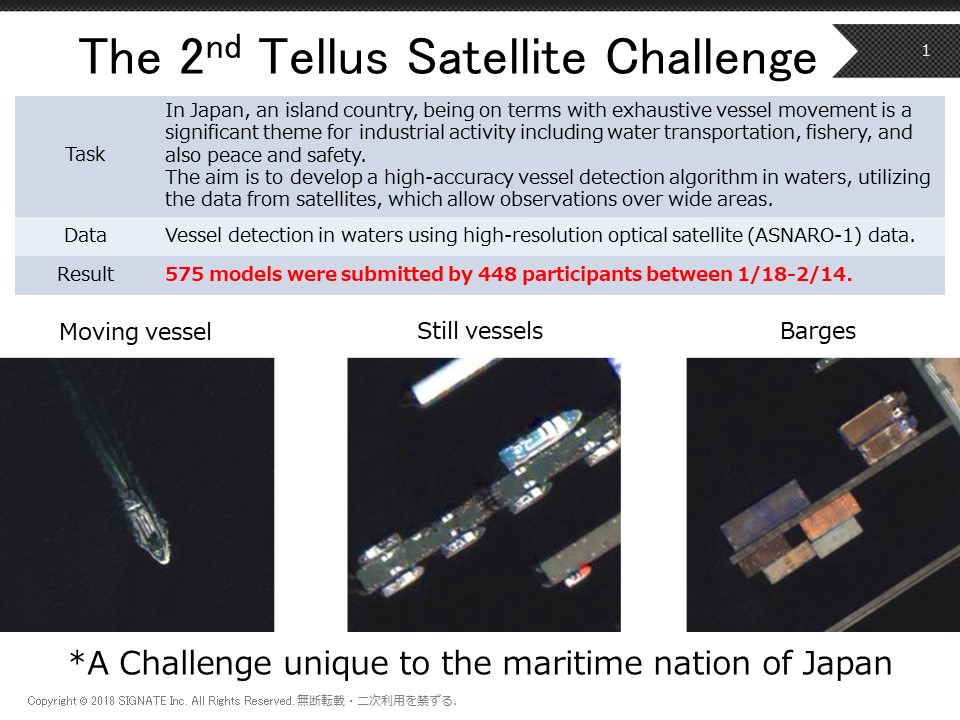
The contest was held from January 18 to February 14, 2018, and 448 participants submitted 557 models. Although the duration of the contest was less than a month, many sophisticated AI models were gathered. The first and second places went to overseas participants, underlying how international this competition was.
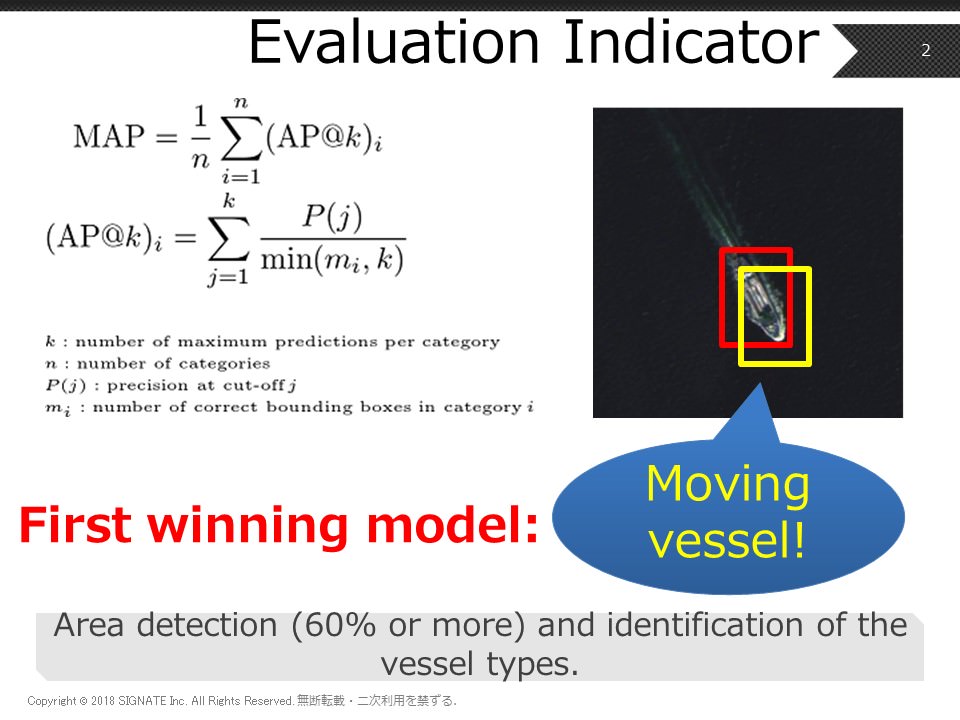
The competition required that 60 or more percent of pixels identified as vessel should overlap the actual vessel area and each model, to successfully determine the type of vessels (in motion, stationary, or barge). MAP was used as the evaluation indicator. This might be regarded as extremely complicated.
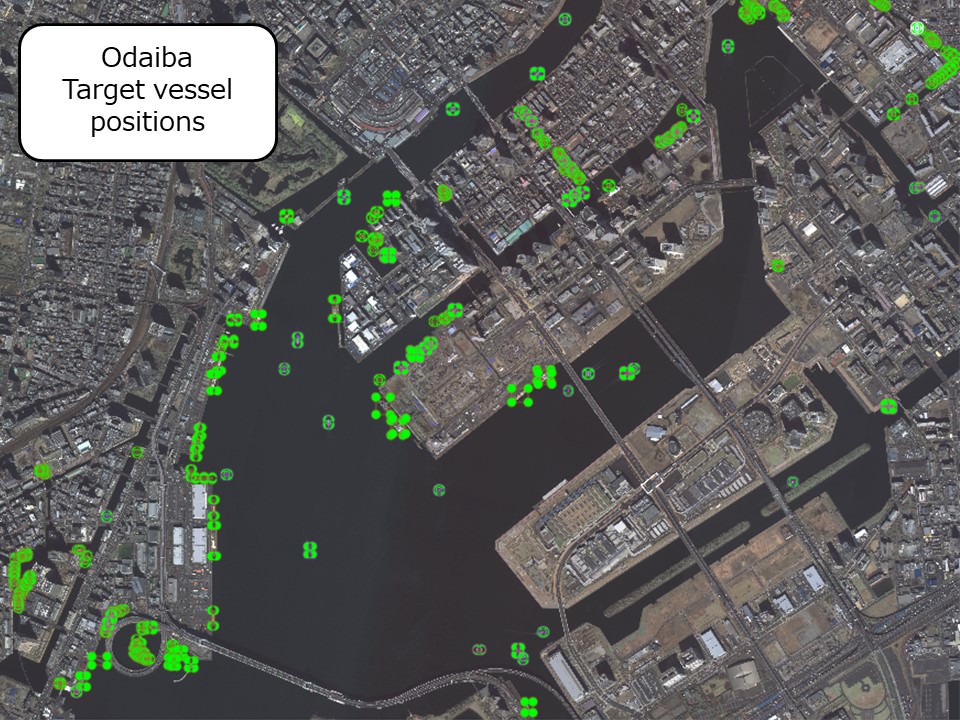
For picture data, 20 scenes (for learning) and 21 scenes (for evaluation) from 6 different areas (Odaiba, Kawasaki, Yokosuka, Osaka, Kobe, and Fukuoka) were provided. There are two challenging aspects in this competition: 1) since the picture size of one scene is very large (10,000 pixels per side), it is difficult to directly deal it with deep learning, and 2) participants need to use creative skills as vessels to be detected are very small (about 100 pixels).
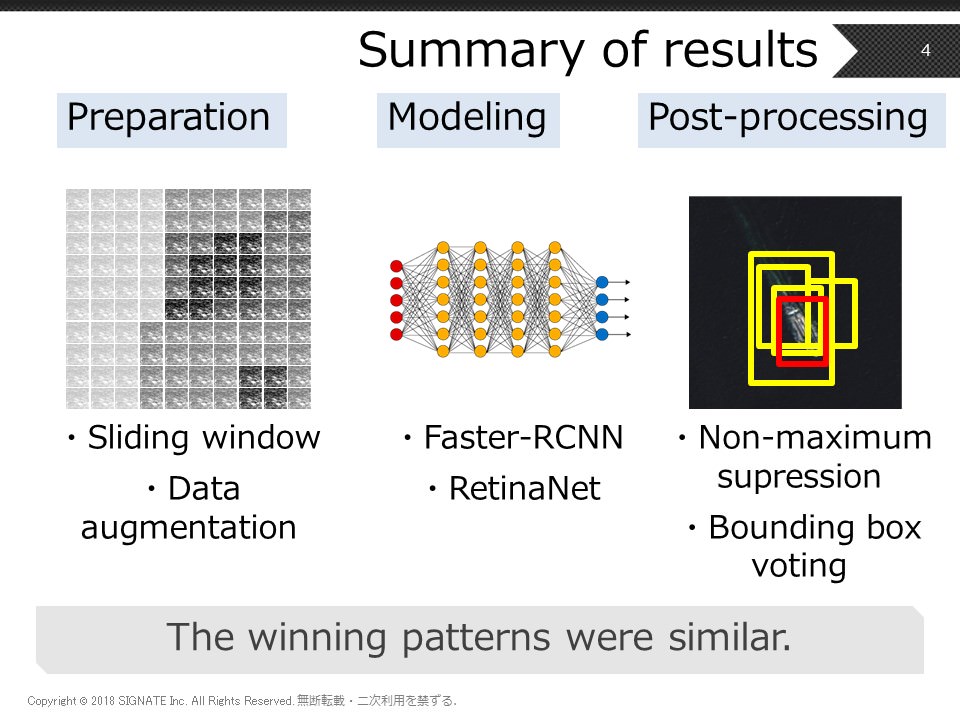
Approaches taken by the winners were similar, and all winners have the following in common:
– employed a strategy to detect vessels out of the whole scene by moving the deep learning in a small-sized window.
– increased the amount of data to create clearer detection.
– adopted a state-of-the-art (SOTA) deep learning model, and for area detection, increased the detection accuracy in post-data processing.
–
Following are detailed explanations of each approach.
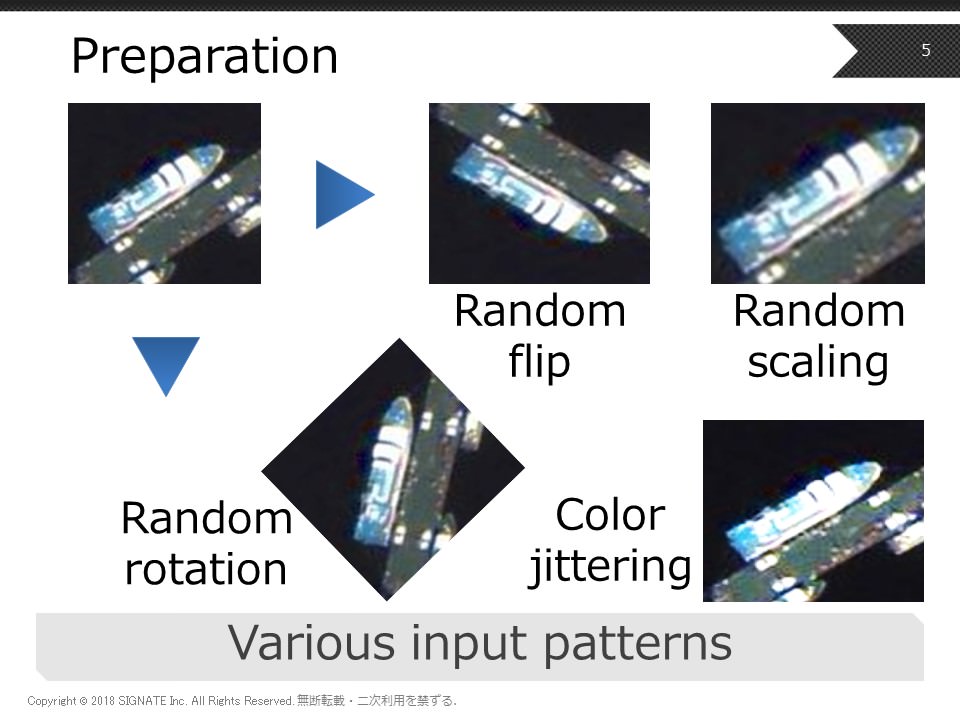
(3) Detailed explanation on each winner's approach (preparation)
All winners cut local images out of the scene of a specific size (1st place winner: 700 px., 2nd: 1,024 px., 3rd: 250 px. and 700 px.). This indicates that they employed a strategy to detect vessels by establishing a determining system for a local point and sliding it over the scene as it is difficult to constrict a model for the whole scene due to size of network.
They also aimed to increase the learned data amount and improve the generalization capability by data augmentation. It includes data generation in different sizes/orientations such as random scaling, random rotation, random flip, and data augmentation by color jittering. Since the differences in cutout sizes and techniques used to increase data are not essential, we can learn their preparation use method from each winner’s common strategy.
(4) Detailed explanation on each winner's approach (modeling)
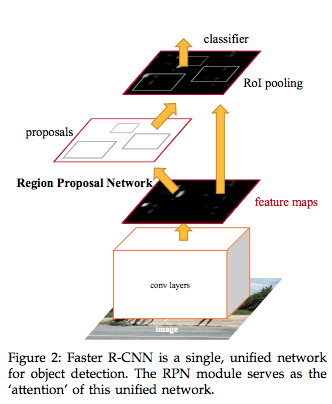
The model used by the first and second place winners was “Faster-RCNN,” while the third place winner employed “RetinaNet.”
Faster-RCNN is a deep learning model proposed in 2015 and has an end-to-end network structure that extracts features of the picture through a convolutional layer and then detects and classifies the object areas by the region proposal network while exporting regression results.
As Faster-RCNN has an independent area suggestion component, it employs a two-stage detector. While the conventional two-stage detector was more precise than one-stage detector (described later), it had certain drawbacks such as inefficiency and a slow inference speed. Faster-RCNN is a model that proposes a solution to the speed requirement. Although it is not applicable in such vessel detection, real-time object detection such as automated driving requires high inference speeds as well as high detection accuracy.
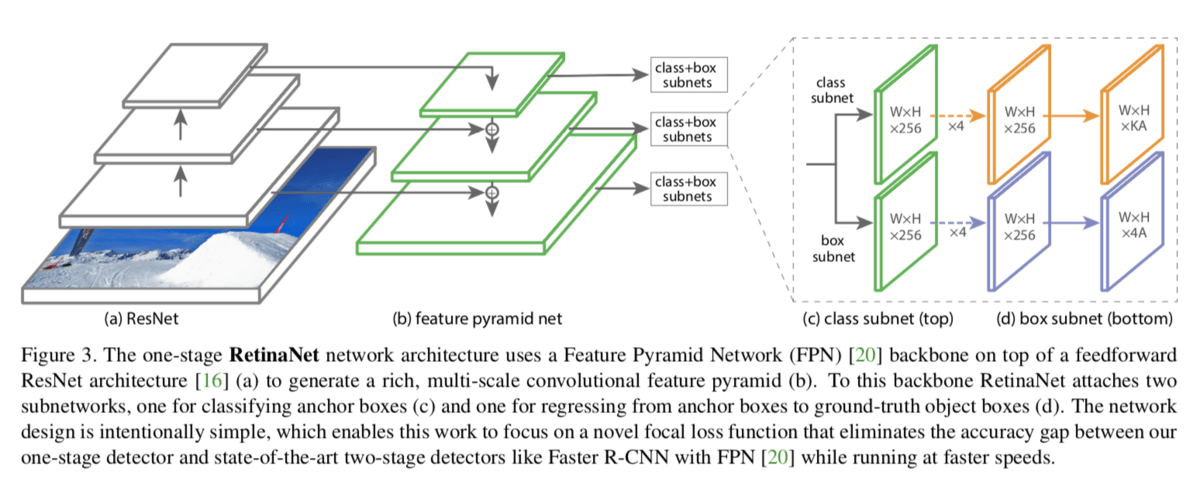
RetinaNet is a model proposed in 2017.
RetinaNet, called one-stage detector, runs area detection and classification at the same time. This approach, on the other hand, had the ability to make inferences at a higher speed but faced lower detection accuracy than the two-stage detector. RetinaNet proposed Focal Loss, a loss function, to improve accuracy. Please refer to the following paper for more detail.
In this Challenge, Faster-RNN model captured the title. In addition, the actual model has improved accuracy by combining multiple networks (such as multiple window sizes). Moreover, the second winning model also adopted the learned models by ImageNet and COCO. However, the effectiveness of the learned models is considered limited as it could not make any significant differences from the model without learned models.
In either case, the winners learned advanced techniques and applied them to this Challenge.
(5) Detailed explanation on each winner's approach (post-processing)
As stated above, all winners combined multiple deep learning models to estimate their final result. To determine a distinctive predicted area and improve the accuracy of detection, the first and third place winners adopted Non-maximum suppression (NMS) treatment, while the second place winner applied Bounding box voting treatment. Both treatments are methods to obtain the most probable distinctive area when multiple area detection results are available for the same vessel. We are not going into details, but if you are interested, please refer to other resources.
Now we are going to look at the accuracy of predicted areas of winning models. IoU (Intersection over Union) was used as an evaluation method. IoU is an indicator that evaluates the degree of overlap between the ground truth and predicted areas.
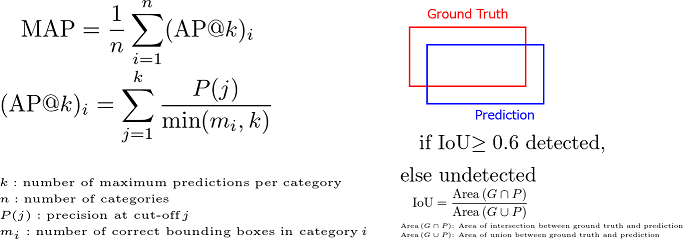
The figure below shows the distribution of IoU for the top model.
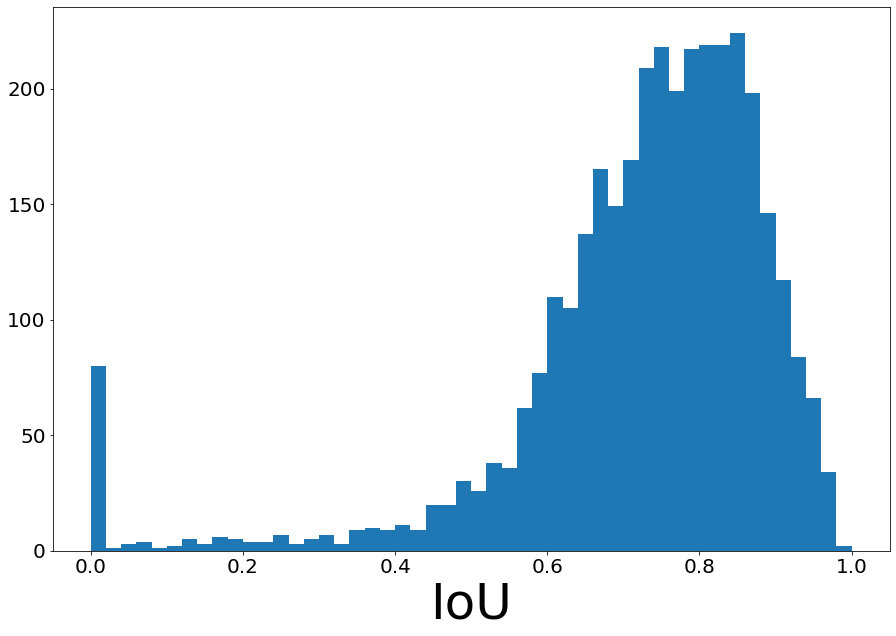
For this task, the threshold value for area detection is set at IoU 0.6 or over. 85.7% of vessel areas that were detected.
The relationship between the size of vessels and the accuracy of area detection is as follows.
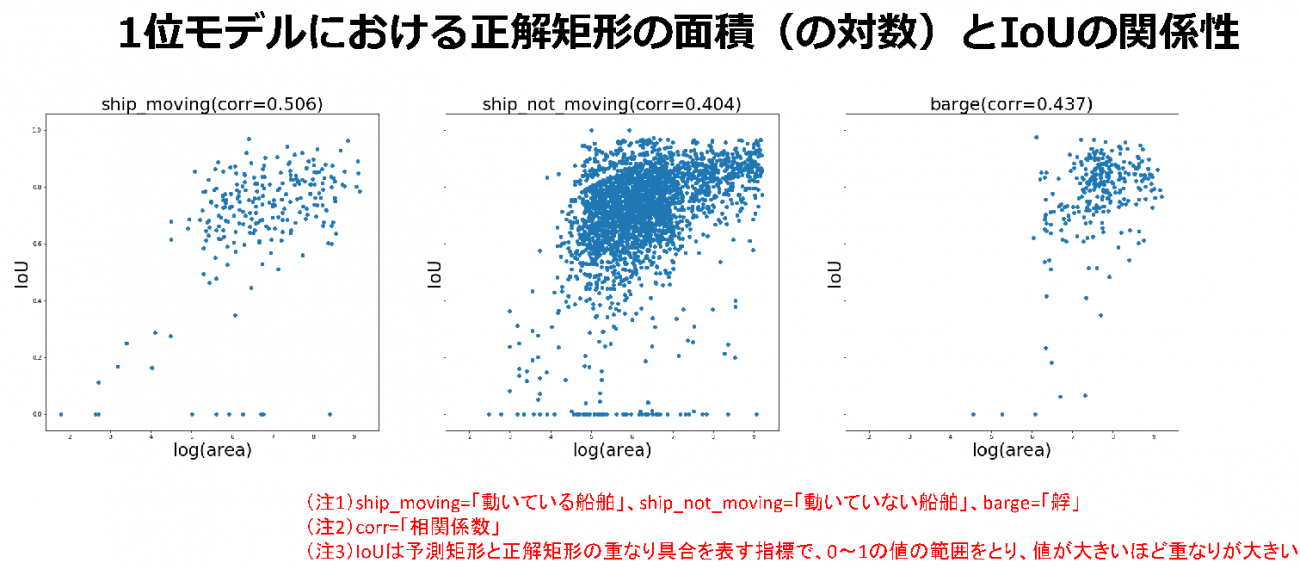
Although it tends to be difficult to detect small vessels, there is no doubt that a set of SOTA modeling approaches have realized high detection accuracy.
(6) General comment on this contest
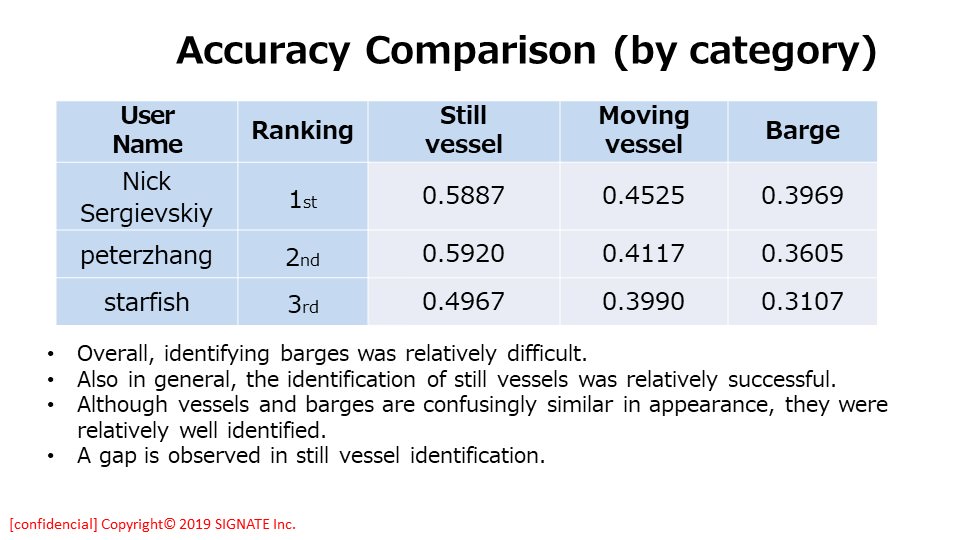
The detective accuracy was 0.567 in MAP for this task, which means the right types of vessels were made available in nearly 57% of areas detected by deep learning.
It implies the difficulty of identifying types of vessels as detective accuracy is, as stated above, high at 85.7%. When the accuracy is examined closely by vessel types, the detection rate for moving vessels is relatively lower than that stationary vessels, which indicates that difficulties lie in the identification of motion including spray. Furthermore, it is hard to capture the features of barges, which makes the identification far more difficult.
As for detection errors, we saw some cases where construction on land areas were detected as vessels. It is assumed that the accuracy could be improved if the detection accuracy of the water area is verified by utilizing map data to filter areas of land.
All winners released comments that they enjoyed the contest, and the first and second place winners praised the high-resolving power of ASNARO, saying “the quality of data is high,” and hoped the outcome would benefit Tellus API. They also expressed their wish to participate in the next contest. From these comments, we think this contest has led to the strong presence of Tellus and its promotion.
(7) Expectations toward the 3rd Tellus Satellite Challenge
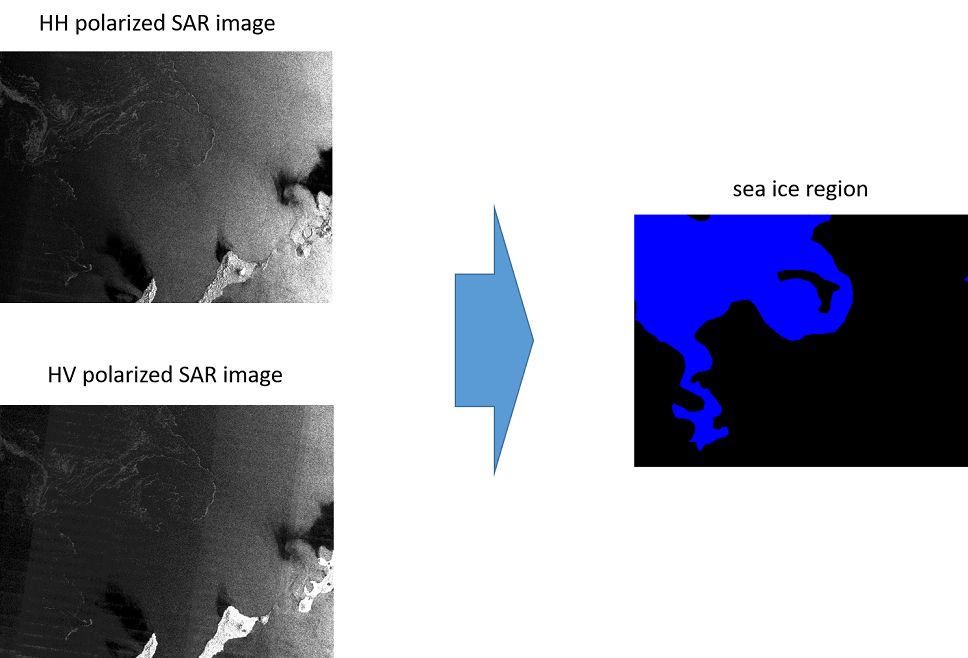
The theme of The 3rd Tellus Satellite Challenge, is “detection of sea ice areas,” and is being held from October 14, 2019.
The goal of this Challenge is to find, what we call, “drift ice” in the Okhotsk Sea from a satellite. This is an important theme for fishermen and people in the shipping business.
In fact, each day during winter, professionals from Japan Coast Guard engage in determining sea ice detection for our peace and safety. The outcome of this Challenge is expected to reduce labor required for such work and to support decision making. The Challenge, therefore, has a large social significance.
As for the data, ScanSAR of PALSAR-2 will be used, and two kinds of polarized wave data are provided. This Challenge provides a great opportunity to demonstrate your ability in a specific theme while learning various things such as polarized waves and physics. We are open until November 30 and looking forward to your participation.
The 3rd Tellus Satellite Challenge: detection of sea ice areas
https://signate.jp/competitions/183