Event Report of the “Tellus x QGIS Hands-on” Event, and Introduction to Analyzation of Satellite Data
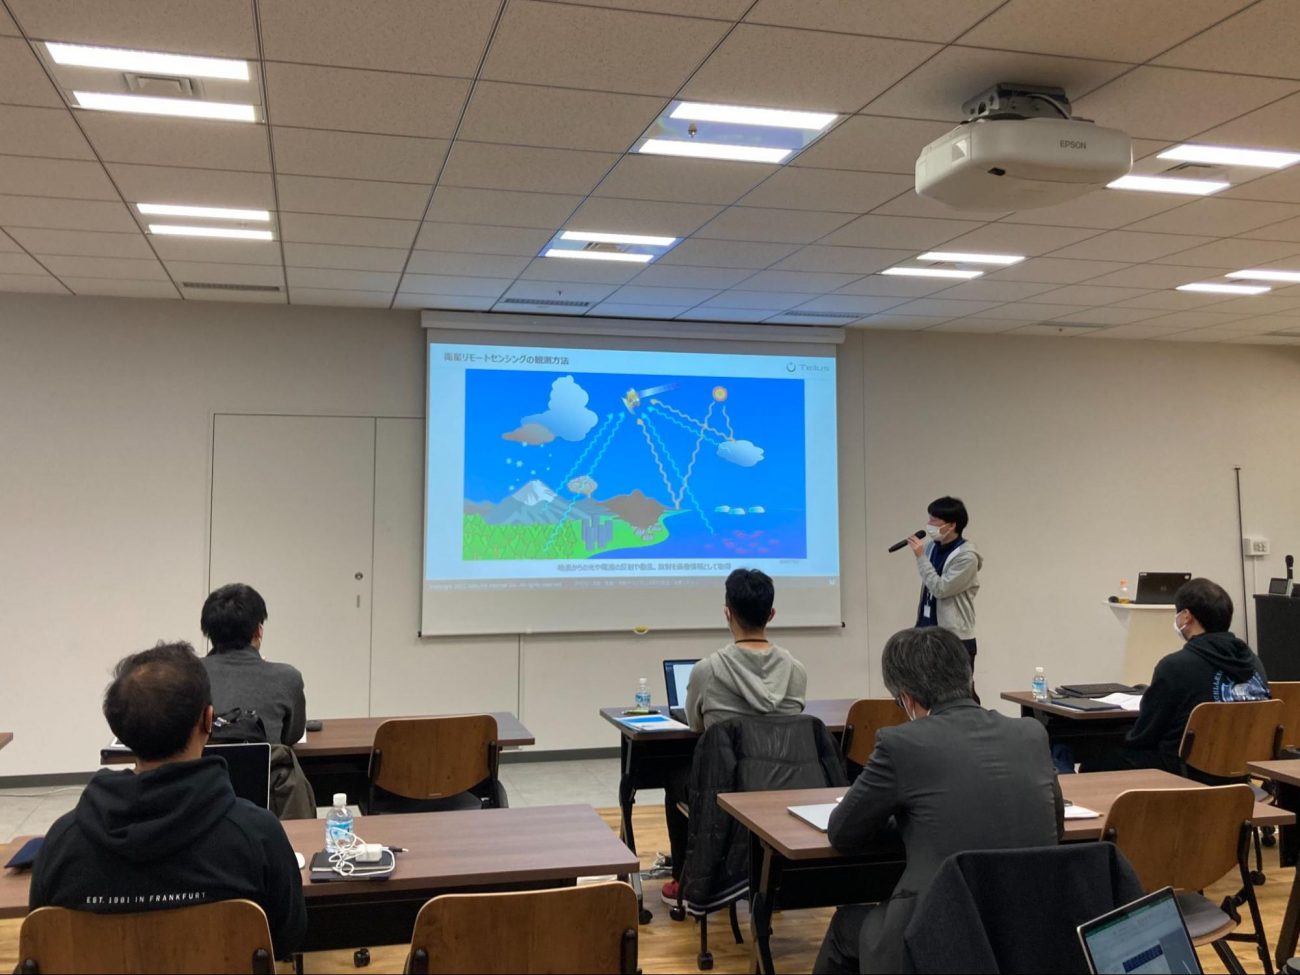
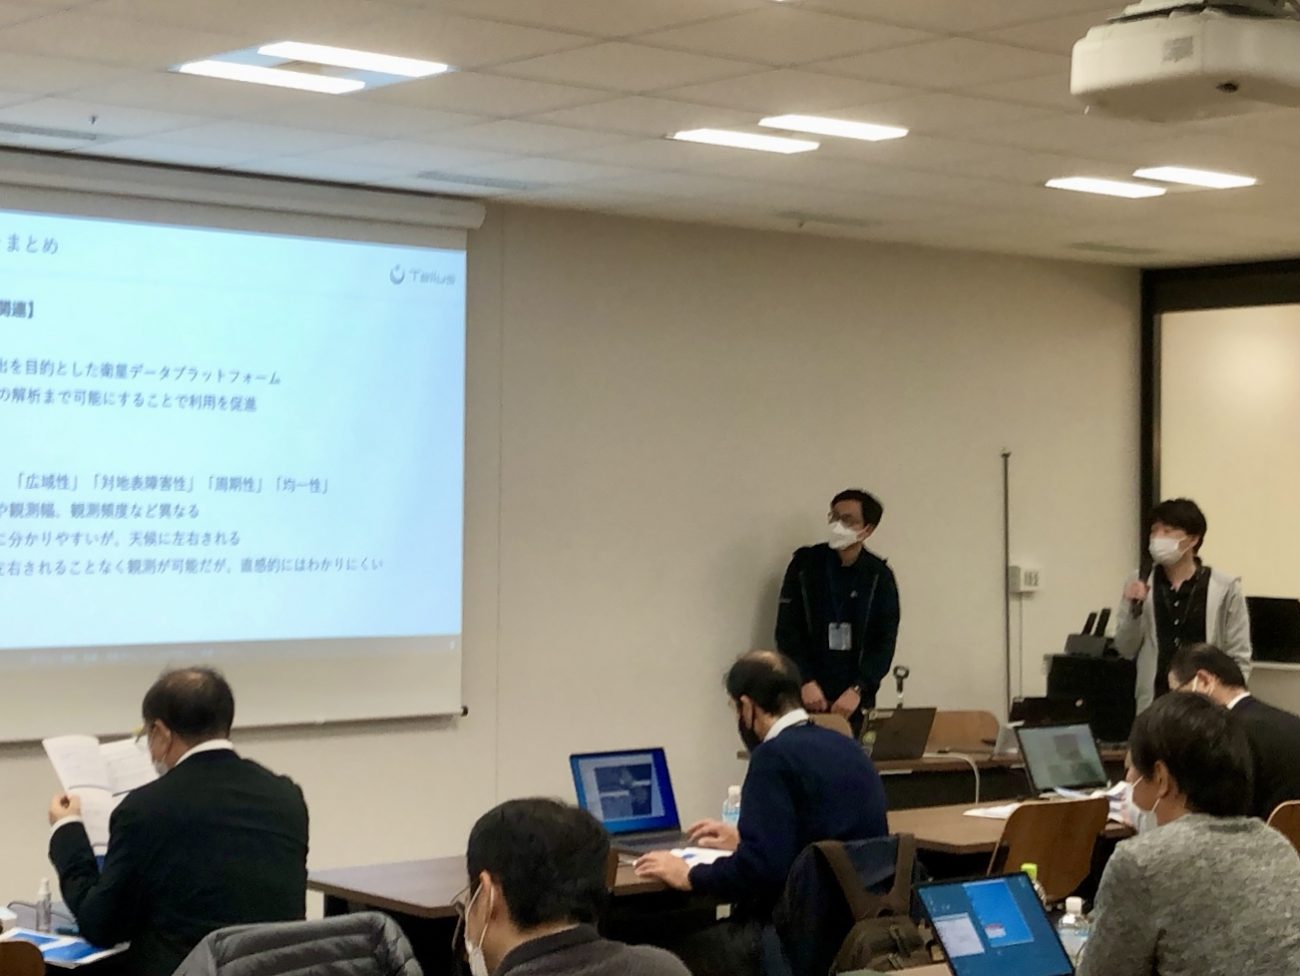
Seminars titled “QGIS Analysis Hands-on with Satellite Data from Tellus -Let’s Learn About the Analyzation of Satellite Data from the Basics” were held on 8th Dec. 2022 (Thu.) and 13th Dec. (Tue.). This article will report on the seminar and introduce the analysis methods of satellite data using Tellus and QGIS.
What is “QGIS Analyzation Hands-on Using Satellite Data from Tellus”
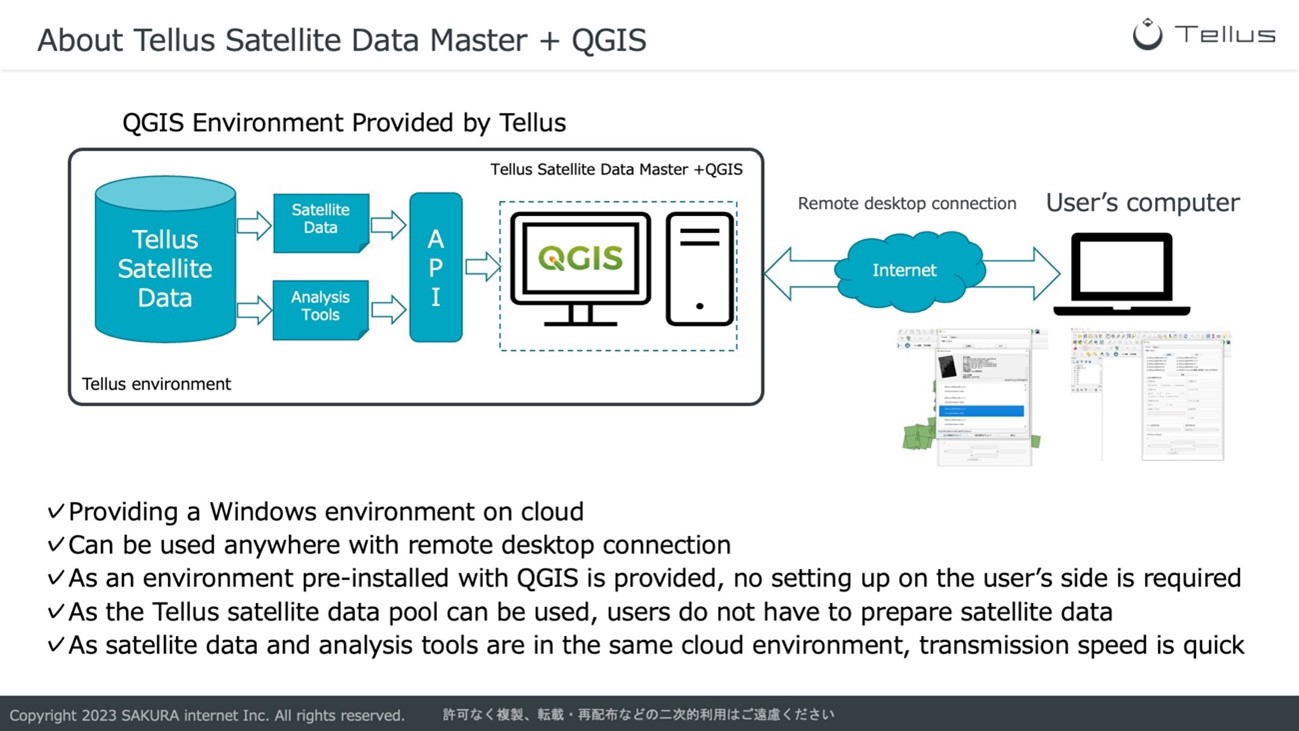
“QGIS Analyzation Hands-on Using Satellite Data From Tellus” is a hands-on seminar utilizing the service “Tellus Satellite Data Master with QGIS,” which is provided by Sakura Internet inc. as an analyzation environment for Tellus.
The seminar aims to allow for the usage of satellite data in business by improving the understanding of the characteristics of satellite data and enabling participants to try using satellite data.
In this seminar, participants were not only able to learn about the basics and the ways to utilize satellite data, but they were also able to learn about practical analysis skills of satellite data using “Tellus Satellite Data Master with QGIS.”
This article will introduce the basics of satellite data and the ways to analyze satellite data based on the contents of the seminar held in December 2022.
Practices introduced in this article require the “Tellus Satellite Data Master with QGIS” cloud environment. Please get in touch with us through the Tellus inquiry form to try out the service.
https://www.tellusxdp.com/en-us/dev/“
■Contents
【About satellite data】
・The Basics of Tellus
・Basic Knowledge on Satellite Data【Analysis of Satellite Data Using QGIS】
・What is QGIS: Introduction to the Basic Functionalities
・Downloading and Displaying Satellite Data
・Analyzation of Satellite Data
・Introduction to Analyzations Using Tellus Official Tools
The term satellite data may sound difficult to those who are unfamiliar with satellite data.
In this seminar, we will explain how to use satellite data with QGIS from the levels of introducing basic knowledge on satellite data.
We hope that those who couldn’t join the seminar may also learn about the basics of satellite data and how to use QGIS.
About Satellite Data
The first part of the seminar is an introduction to “what is satellite data”.
Basics of Tellus
We will first start by introducing the basics of Tellus.
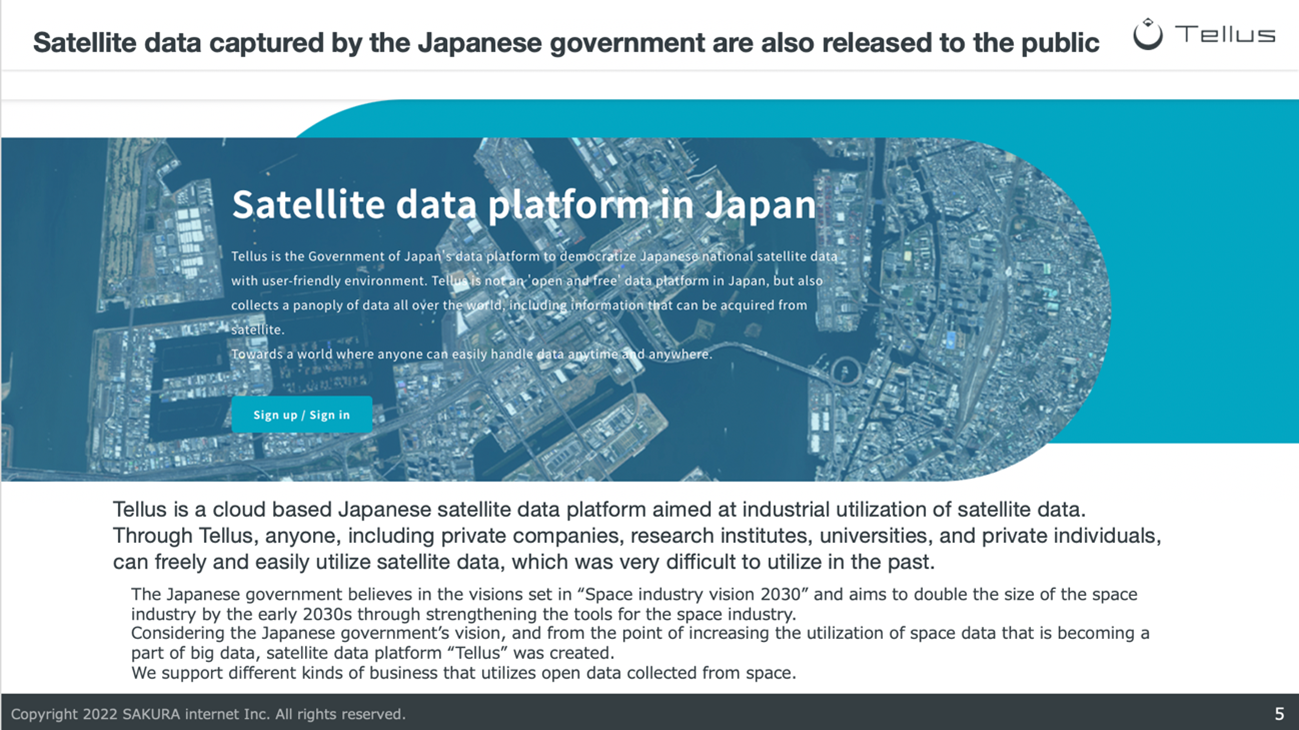
Tellus is an open and free cloud analysis platform created in Japan to create new business markets for satellite data.
The platform provides satellite data that anyone can use for free and commercial satellite data, together with API for disaster and meteorological data published by private corporations. Tellus aims to encourage satellite data usage by providing satellite data from various sources.
To spread the use cases and knowledge regarding satellite data usage, Tellus also operates an owned media, Sorabatake. It also holds a wide range of events, such as this seminar, to increase the number of people who can use satellite data.
Satellite data, which only professionals could use, became easy to use through the development of satellite data platforms such as Tellus.
For more detailed information on Tellus, please visit [here]
Basic Knowledge on Satellite Data
After introducing some basic knowledge of Tellus, this section will introduce some basic knowledge of satellite data.
About Remote Sensing
This section will be about the basics of remote sensing.
“Remote sensing” is the technology to measure objects remotely. There are various forms of remote sensing, including those using aircraft and drones. “Satellite remote sensing” refers to only the specific type of remote sensing through observing the Earth with sensors on artificial satellites.
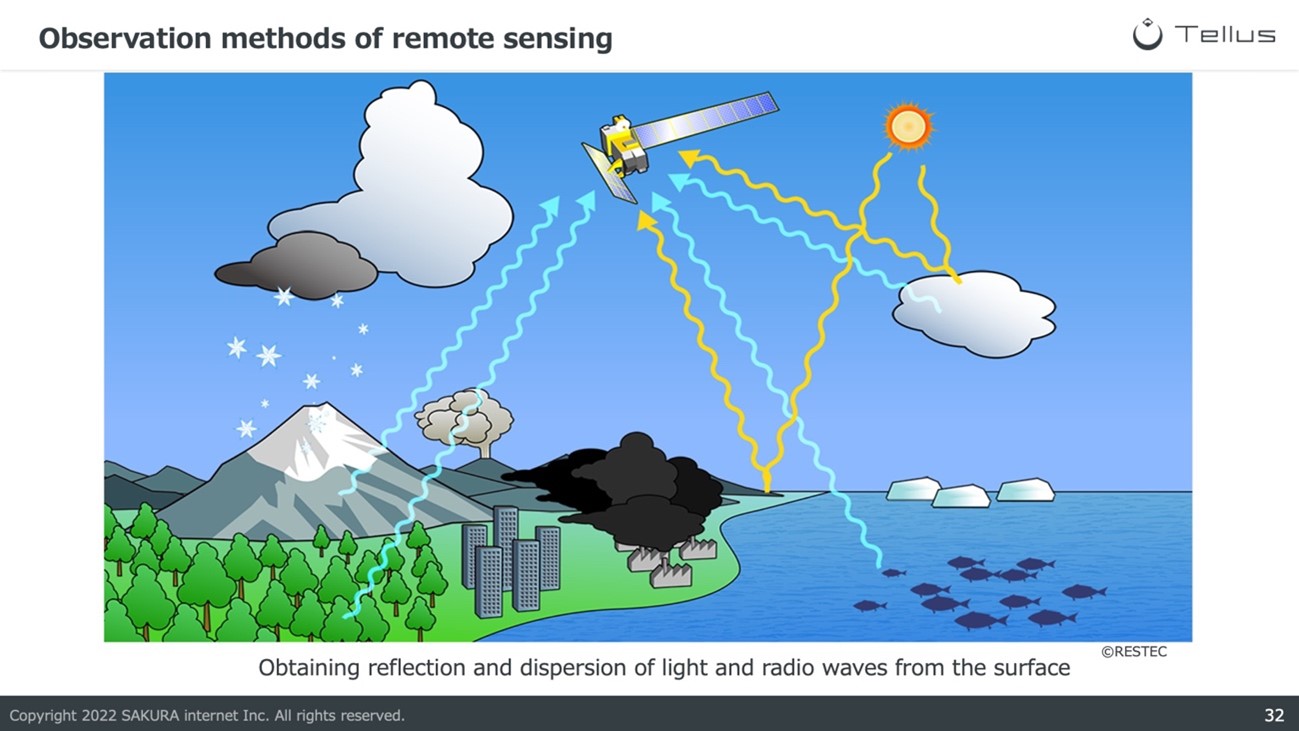
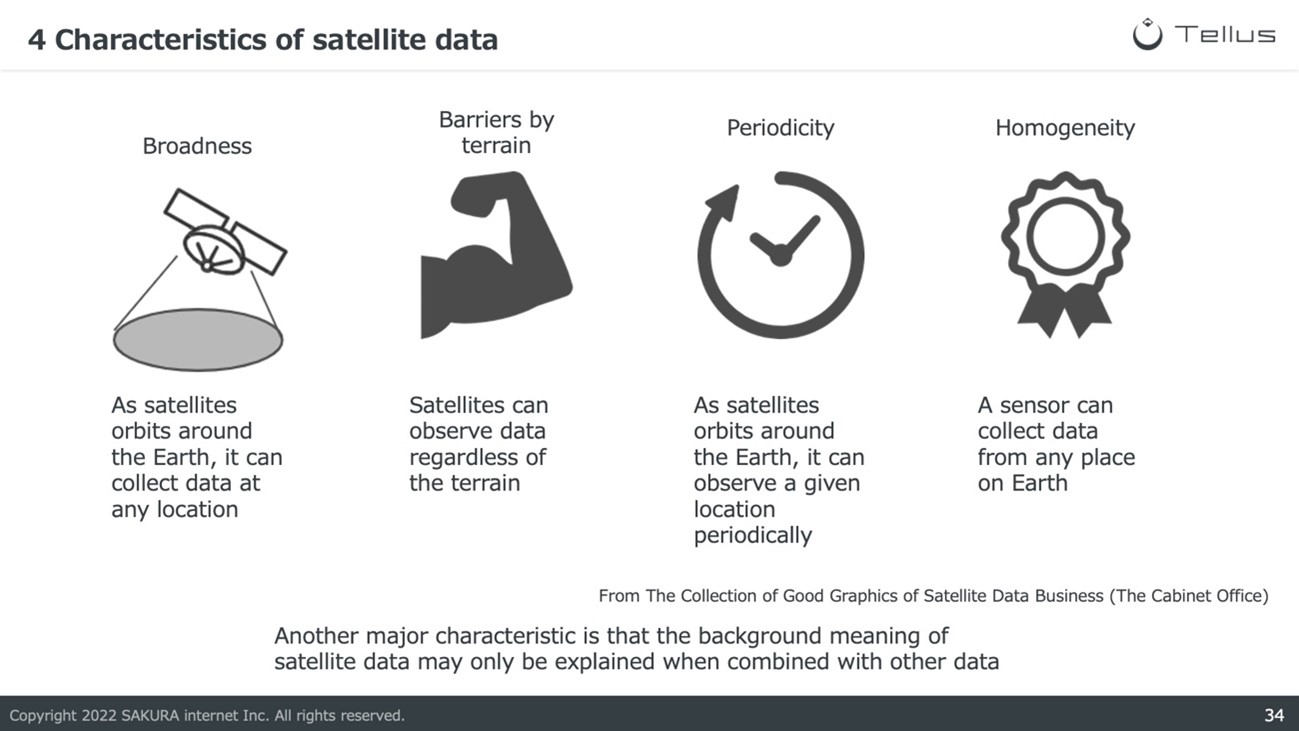
The data received through satellite remote sensing is known as “satellite data.” Satellite data have four characteristics, which are “broadness,” “strength against barriers by terrain,” “periodicity,” and “homogeneity.”
Remote sensing (observations of the Earth) with satellites
This section will be about “remote sensing (observations of the Earth) with satellites.”
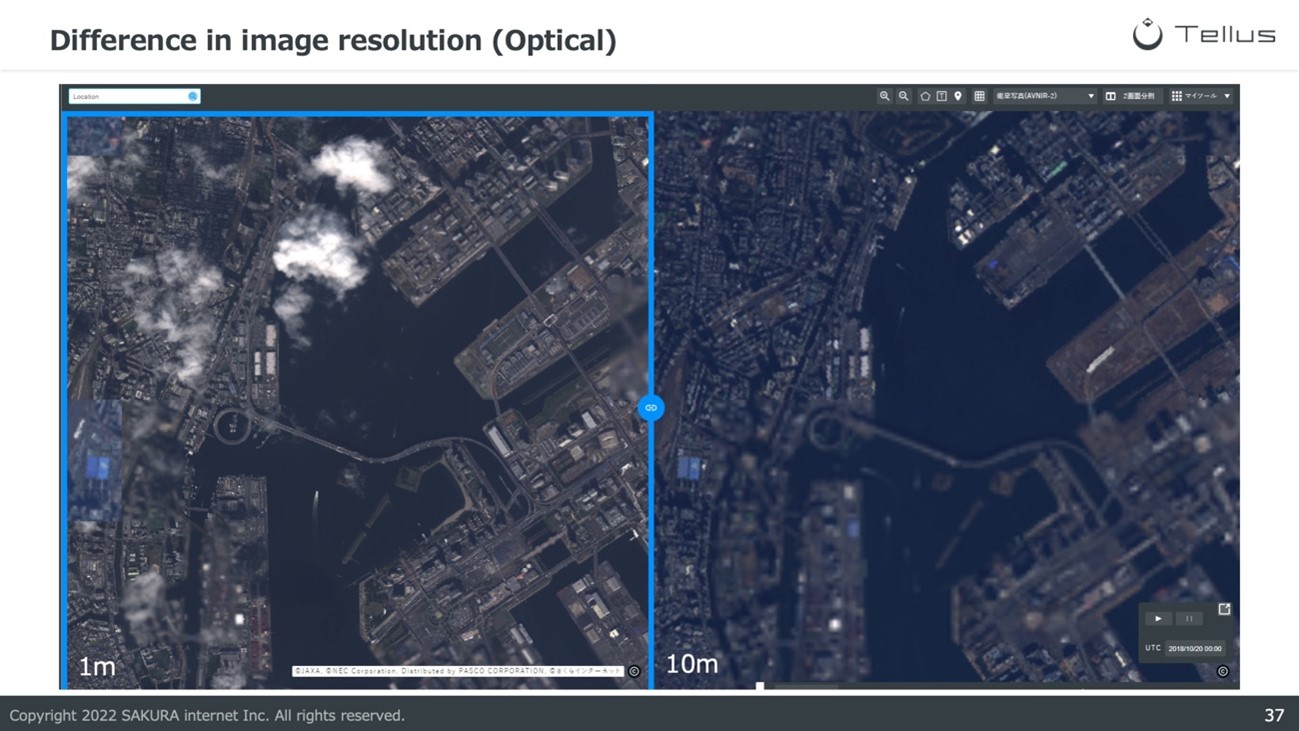
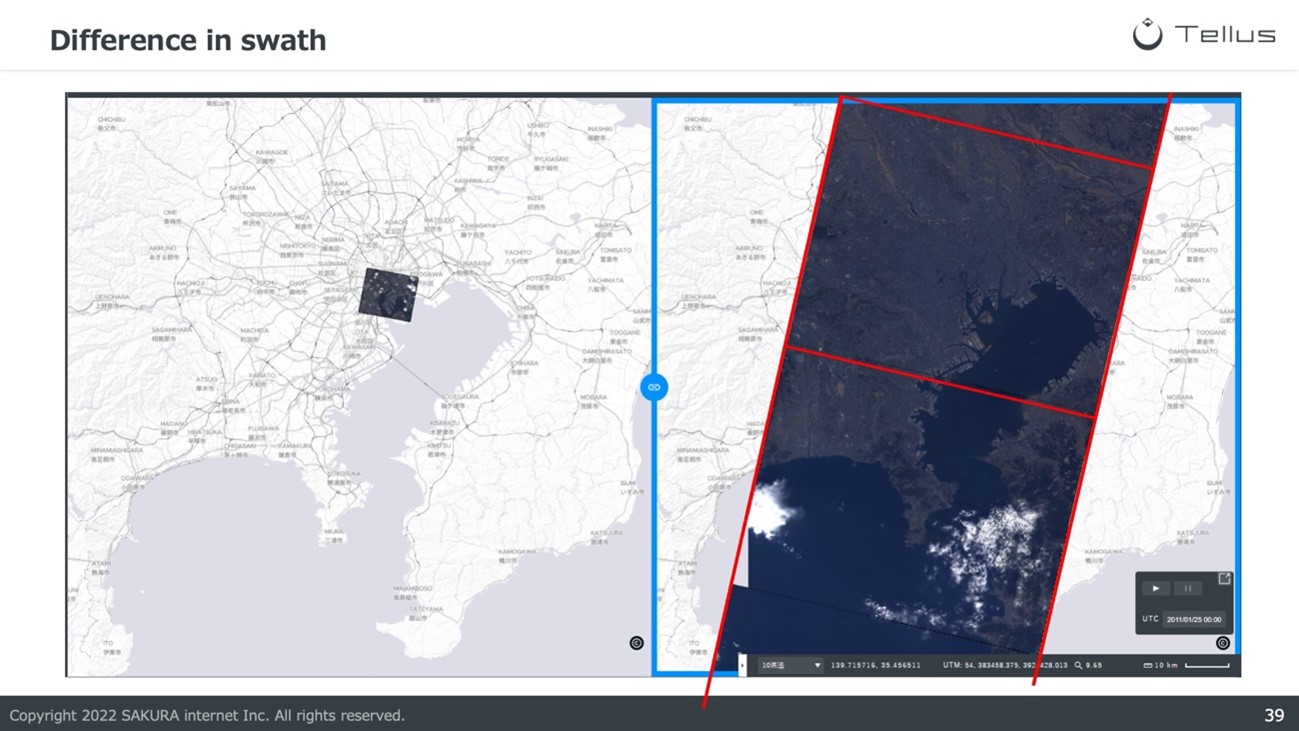
Let’s first look at the keywords used in remote sensings, such as spatial resolution and swath.
By comparing satellite data taken with different spatial resolutions and swaths, we can see that situations we can observe through satellite data are different.
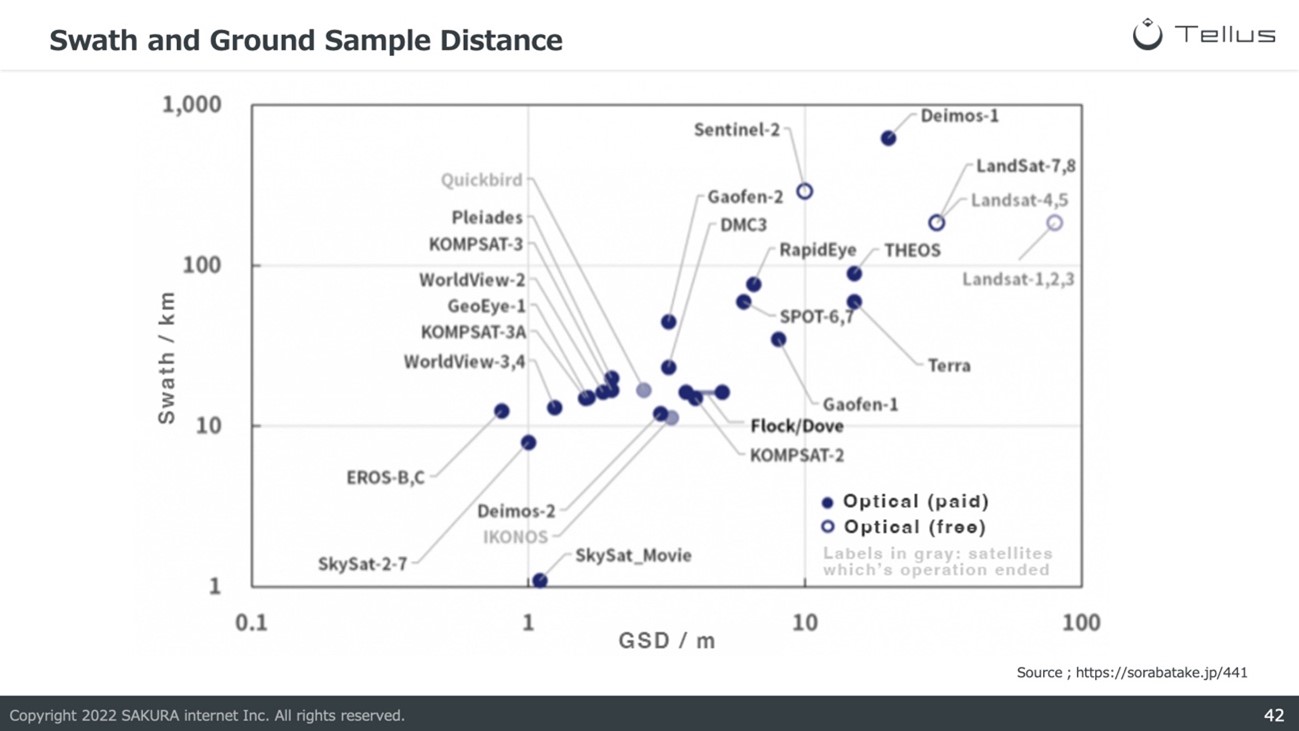
The following graph shows the relationship between each satellite’’s spatial resolution and swath.
Through the graph, it is apparent that narrow swaths have higher sensor resolutions. It is also evident that satellites with high resolution mostly have a cost, and most free satellites have a spatial resolution of over 10m/px.
Characteristics of optical and SAR data
This section will introduce “optical data” and “SAR data,” which will be used in the practices for analyzing satellite data.
■Optical data
Satellite data taken with optical sensors are called visual data. Most optical sensors capture the reflected visible and near-infrared light when sunlight collides with objects on the ground.
As a result, optical data looks like aerial photos and can be easily interpreted but cannot be observed when the weather is cloudy or at night when there is no sunlight.
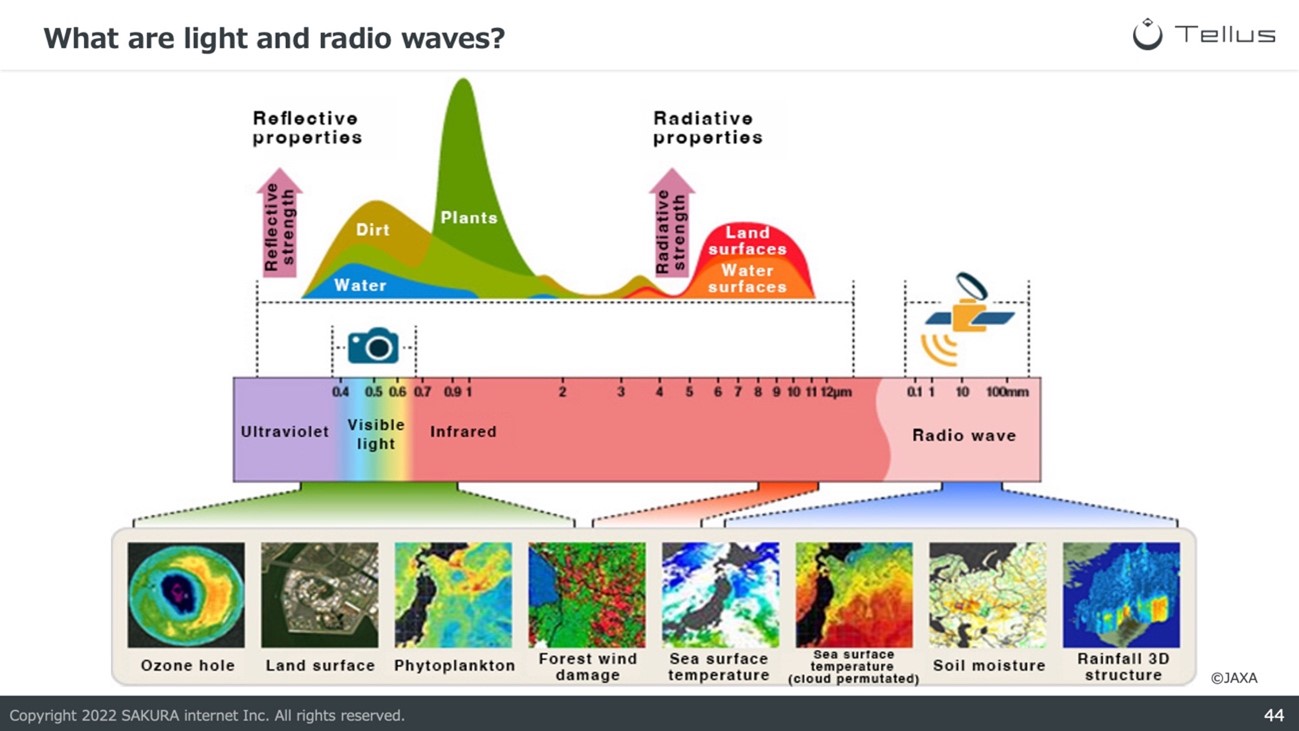
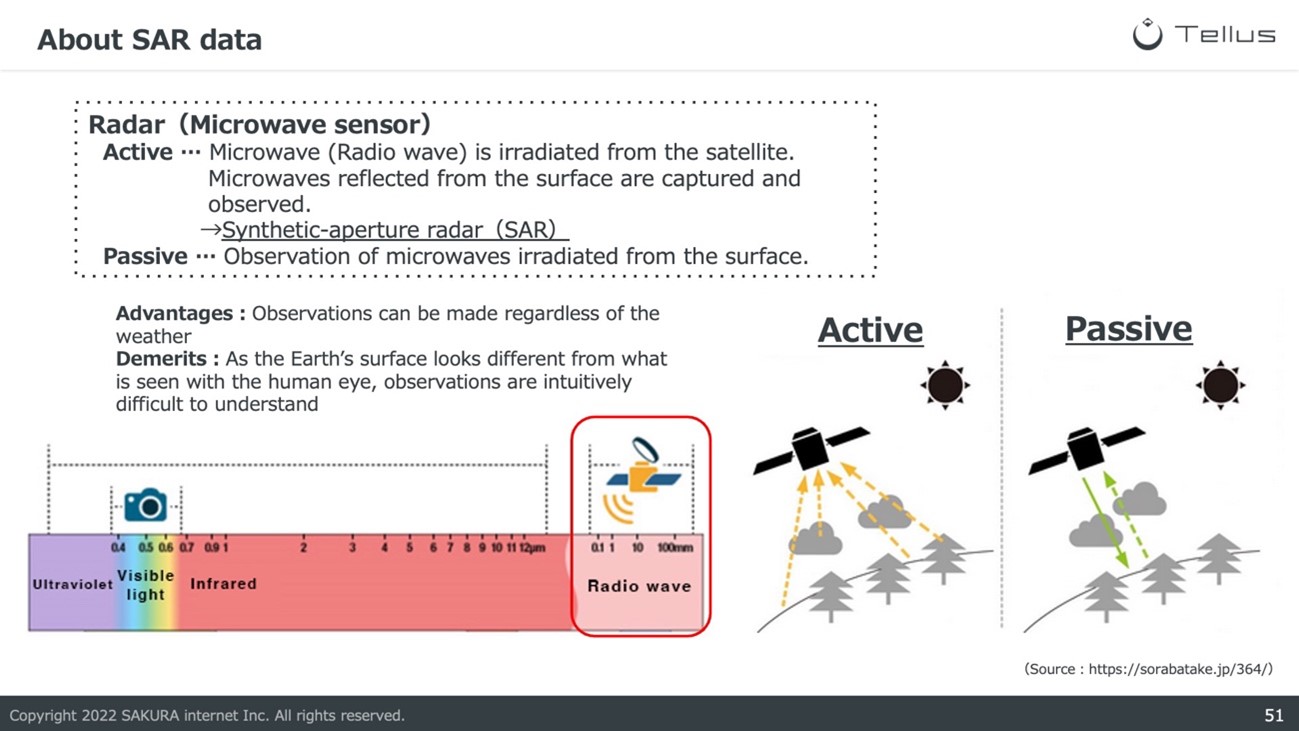
■ Synthetic aperture radar (SAR) data
Satellite data observed by synthetic aperture radar (SAR), which are microwave sensors, are called SAR data. SAR sensors radiate microwave from the sensors on the satellite, and capture microwaves reflected from the land surface.
Through the observation method, SAR data can be captured even when the weather is cloudy or at night. However, as SAR data are black-and-white images that reflect the strength of reflection, reading SAR data requires knowledge and experience, which is a major disadvantage.
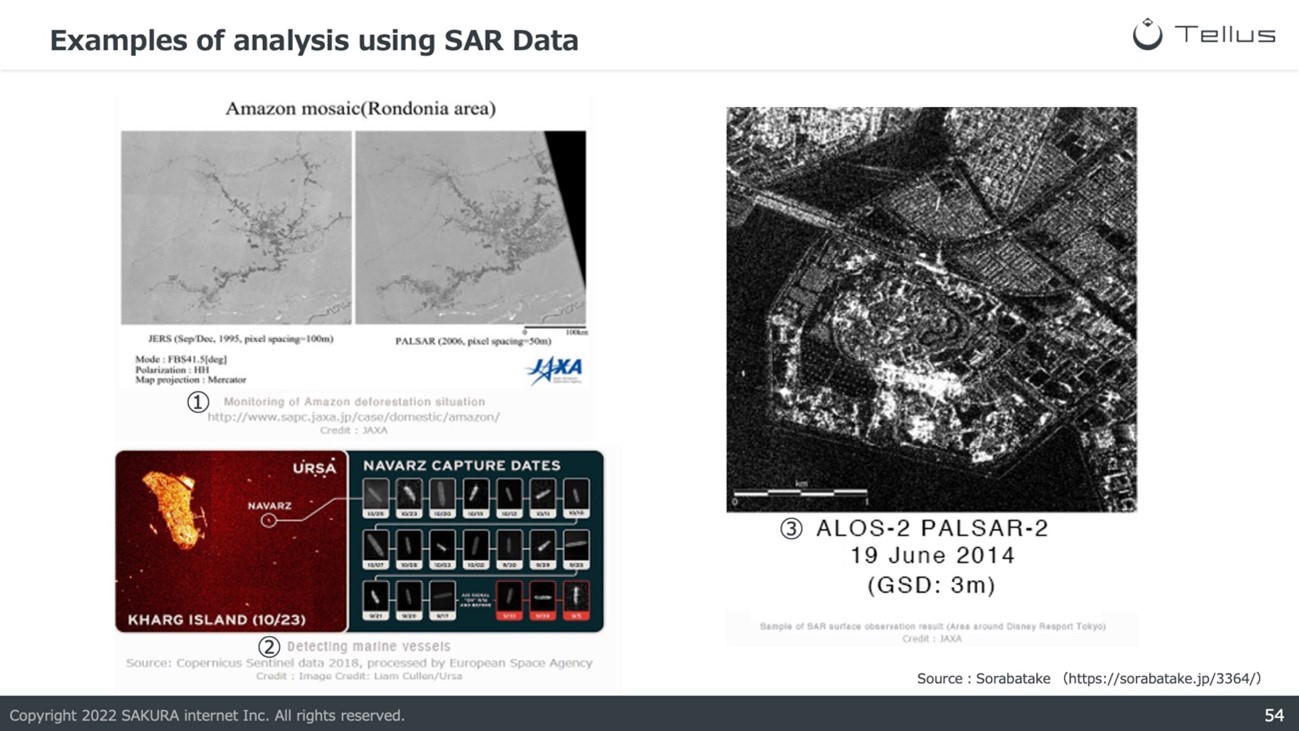
As shown in the examples above, optical data and SAR data each have different characteristics. When using the data, users have to first understand the characteristics of each data before selecting the satellite data that is suitable for the users’ objectives.
Use cases of remote sensing
The last section on remote sensing is about the use cases of remote sensing.
As most people are unfamiliar with remote sensing, it is not easy to imagine the wide range of industries that utilize remote sensing. However, various industries use remote sensing technology, including finance, disaster management, and agriculture.
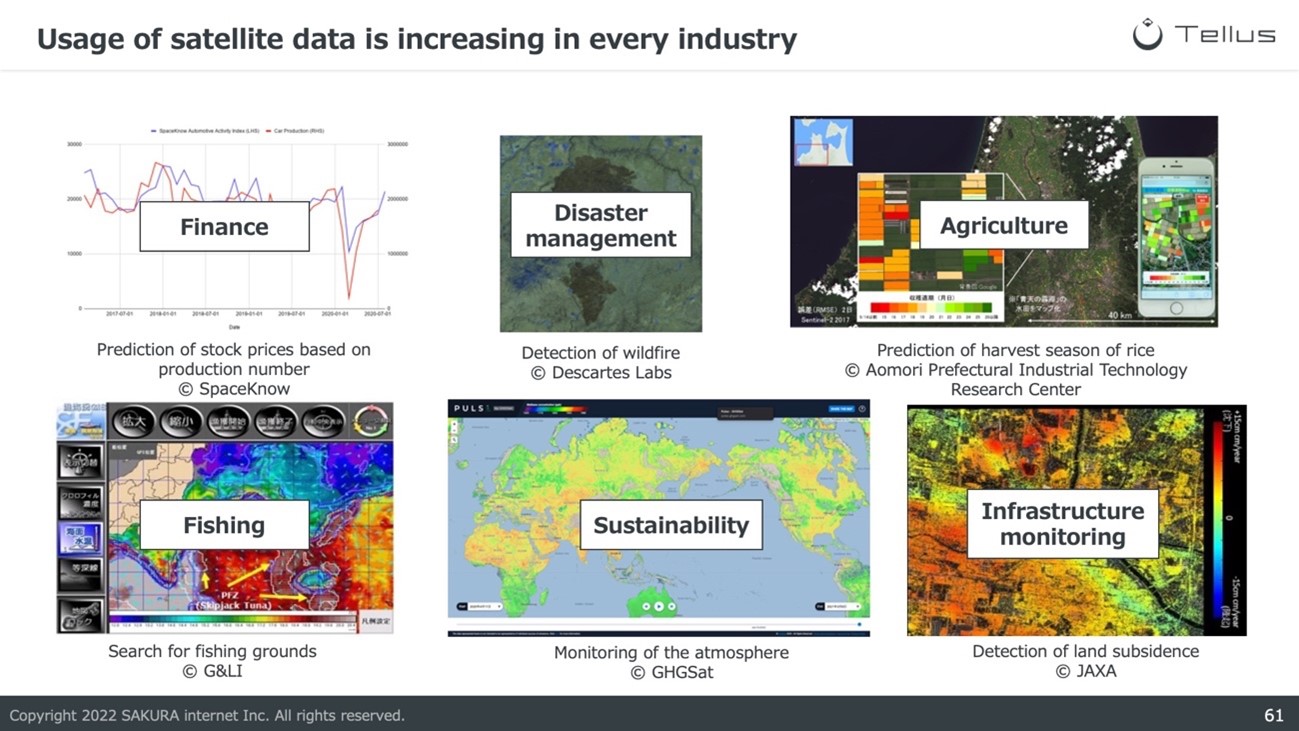
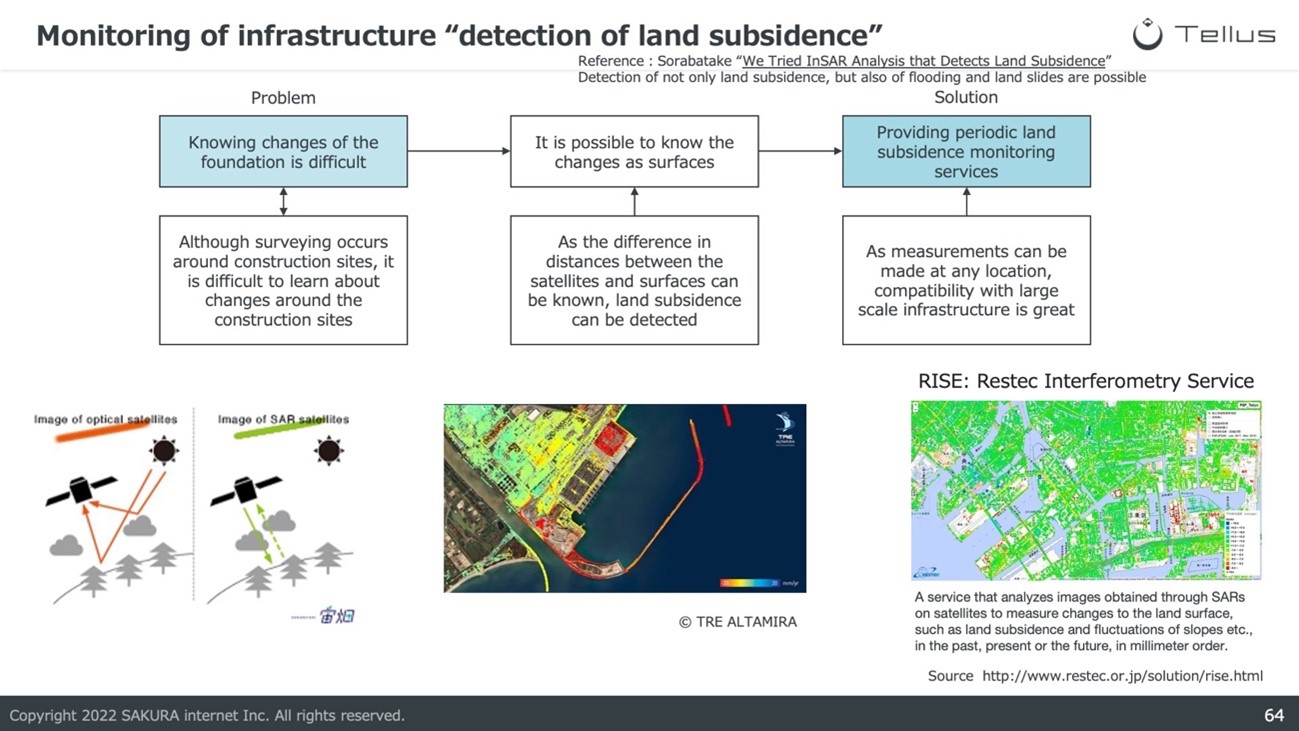
For example, in the “service for measuring changes in land surface” provided by the Remote Sensing Technology Center of Japan, a service that analyzes SAR images to measure changes in land surfaces, such as land subsidence and slope failure in the past, present, and future, is provided to infrastructure companies.
Using satellite data, places that are impossible to measure by humans, together with the measurement of vast areas, such as obtaining the changes in land surface, which cost a large amount of money, and now possible. Thus, satellite data is widely used in constructing and maintaining infrastructure, such as roads, railroads, ports and airports.
There is an increasing number of businesses that utilize satellite data. In the future, with a decreased cost of launching satellites, and an expanding demand for satellite data, there will be an increasing amount of businesses that utilize satellite data.
In Soratabake, there are articles on the use cases of satellite data in different industries and articles introducing the basics of satellite data. Please check out the other articles as well.
The basics of satellite data — What it tells us, types, observation interval, resolution and use cases
Analysis of Satellite Data Using QGIS
This section will introduce methods to analyze satellite data using QGIS.
Introduction to the basic functionalities of QGIS
The first part of this section will introduce the basics of QGIS and its basic methods.
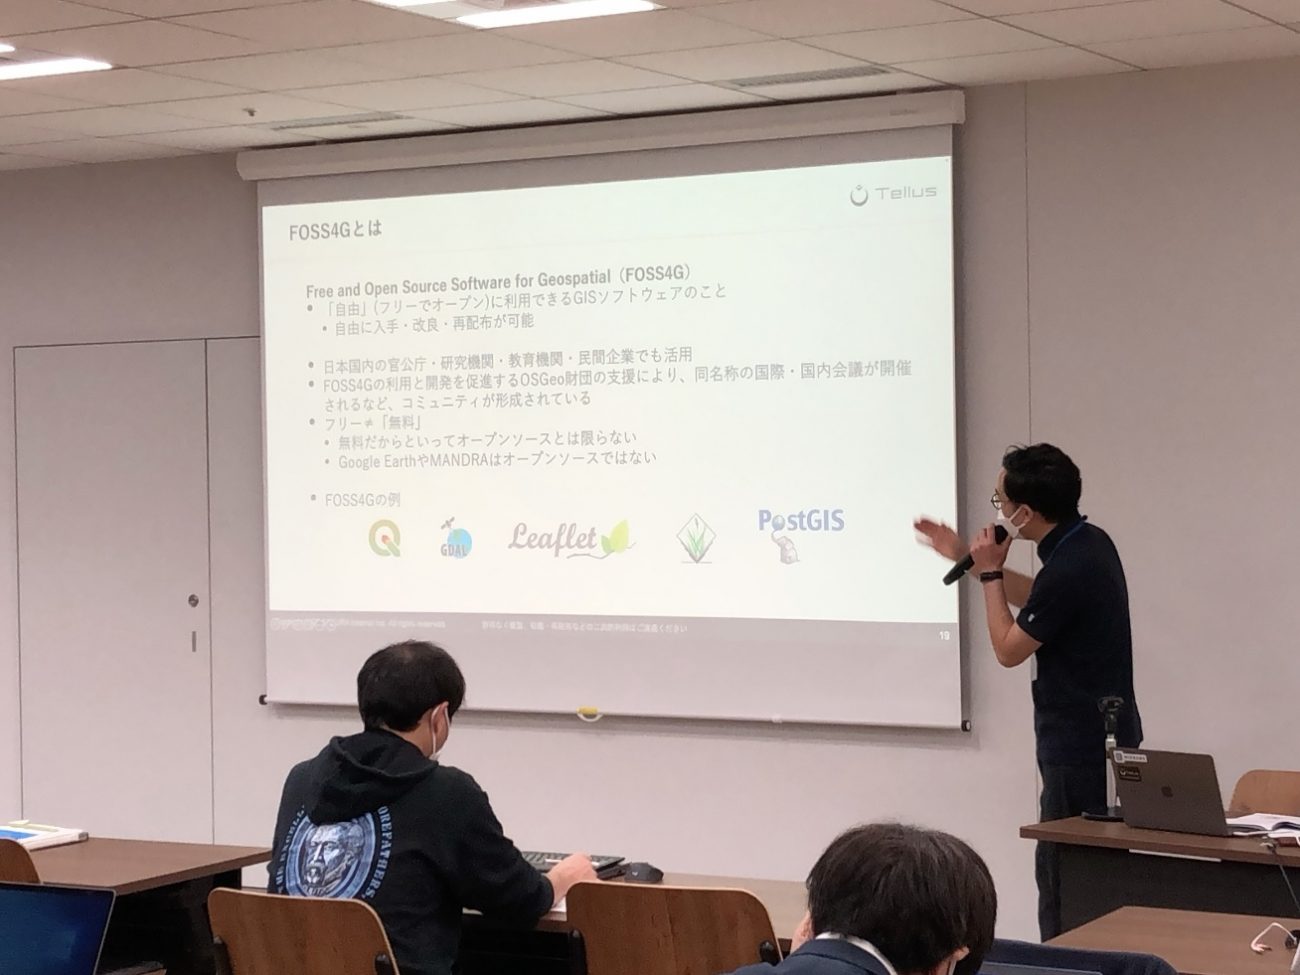
QGIS is an open-source desktop GIS (Geographic Information System) software that anyone can use freely. Companies and organizations around the globe have been supporting the software since 2002, when the software was first released.
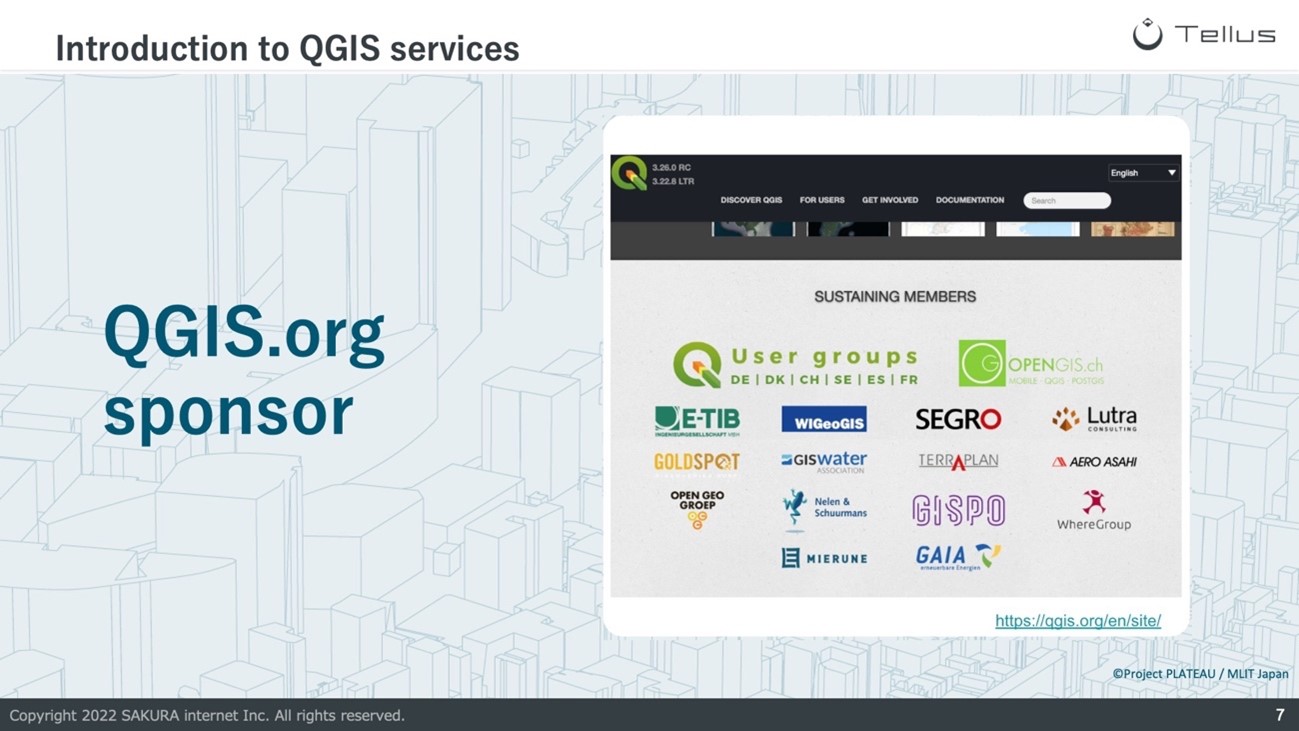
In recent years, corporations and government agencies in Japan are increasingly using QGIS. There is also an increasing number of books published on QGIS in recent years, showing the increase in popularity of the software.
In [Google Trends], we can confirm the popularity of QGIS in Japan and around the world over the past ten years.
Before analyzing satellite data, let’s look at and try out the basic operations of QGIS.
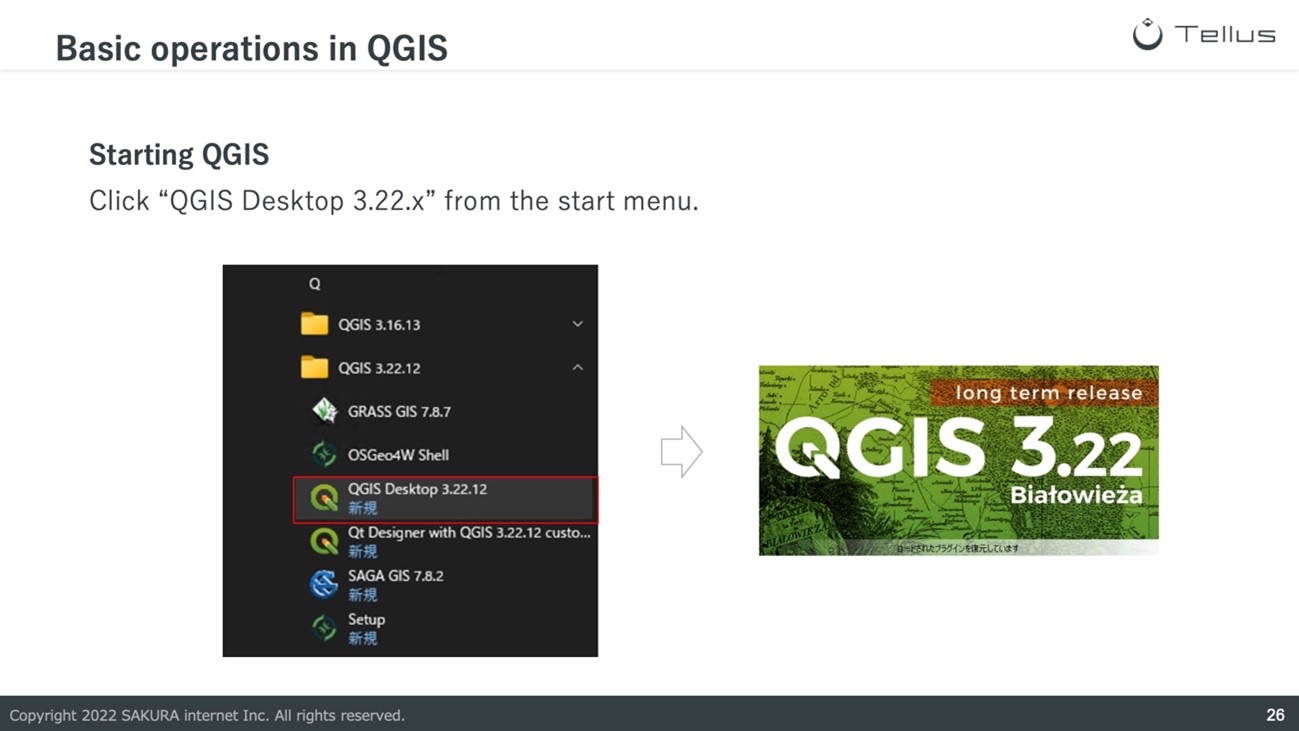
・Launch QGIS
First, let’s launch QGIS.
As this tutorial uses “Tellus Satellite Data Master with QGIS,” please access the dedicated service using the remote desktop connection.
※ Each user is notified with the IP address and password required for remote desktop connection.
After connecting to the remote desktop, please launch QGIS by clicking “QGIS Desktop 3.22” in the start menu.
・Basic operations in QGIS
After launching the software, let’s try some basic operations of QGIS.
Various videos on the usage of QGIS are available on the YouTube channel of MIERUNE, a company that provides development and consulting services for QGIS.
Please learn about the basic operation basic on the videos on the channel.
・Add Geospatial Information Authority of Japan (GSI) English Maps to QGIS
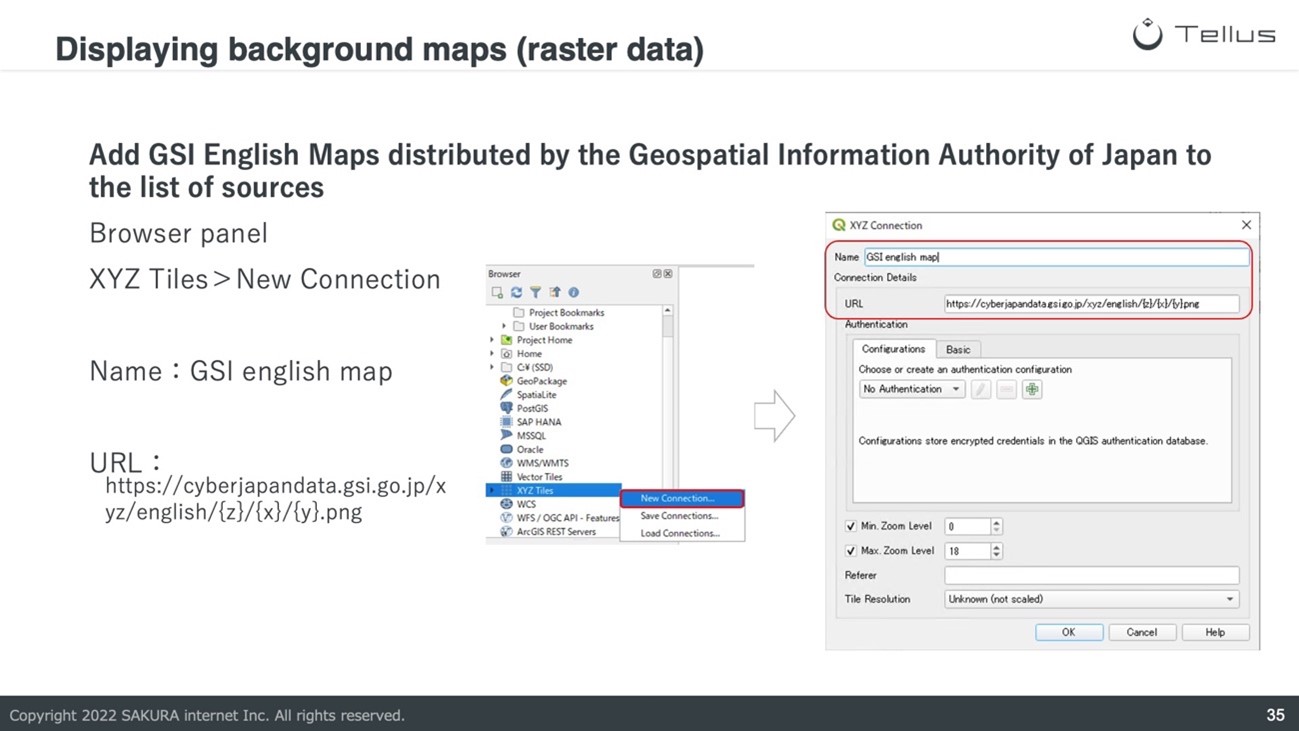
As an example of adding data to QGIS, this article will introduce the methods to add GSI English Maps published by GSI.
From the browser panel, find “XYZ tiles,” right-click with the mouse, and click “new connection.” A window for connection to XYZ tiles should be shown. Please input the following contents and click on OK.
Name: GSI English Maps
URL:https://cyberjapandata.gsi.go.jp/xyz/pale/{z}/{x}/{y}.png
※ A list of the maps published by the GSI can be confirmed in the [following page]
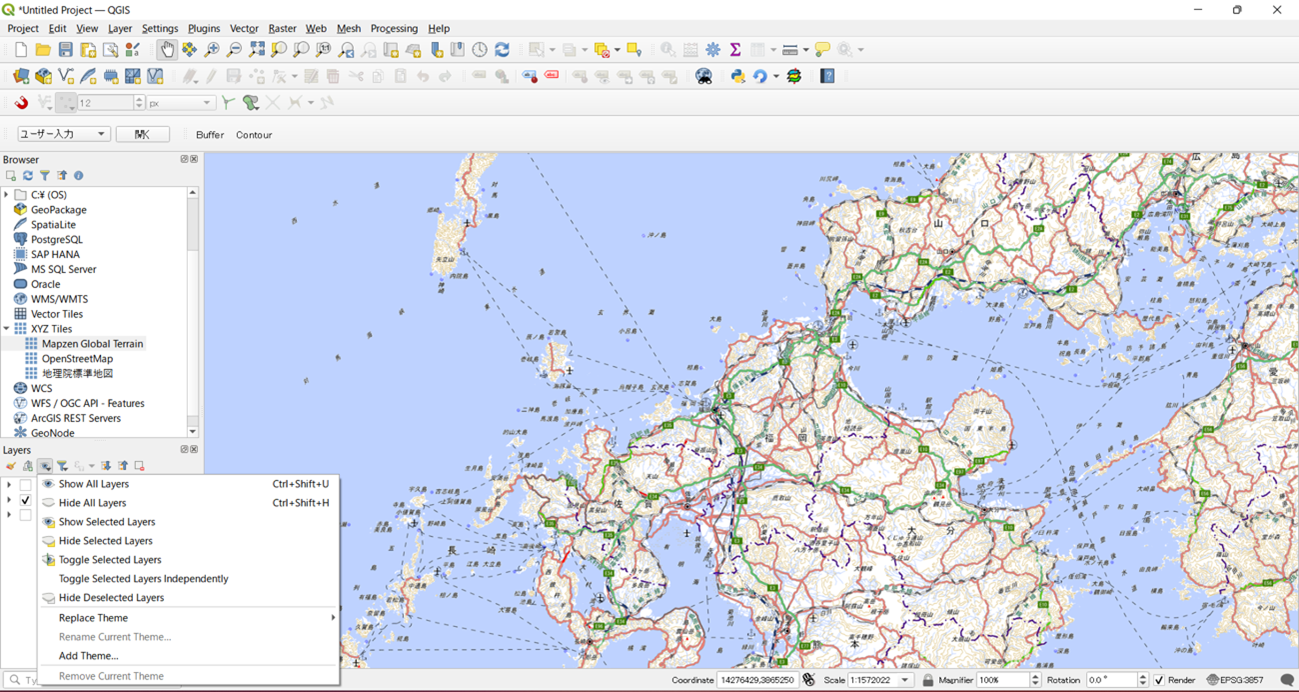
After adding the GSI English maps to the list of connections, “GSI English Maps” should be shown in the “XYZ Tiles” section in the browser panel. By double-clicking, “GSI English Maps” is added to the layer panel and displayed in the map canvas.
Above is the introduction to basic operations in QGIS.
Downloading and displaying satellite data
After learning about the basic operations of QGIS, let’s look at how to download and display satellite data using “Tellus Satellite Data Master with QGIS.”
“Tellus Satellite Data Master with QGIS” is a cloud environment for businesses with QGIS.
Typically, a high processing power environment and a high-speed internet connection are required to analyze satellite data for QGIS.
Using this service, it is possible to analyze satellite data published on Tellus on QGIS without preparing an analyzation environment and high-speed internet.
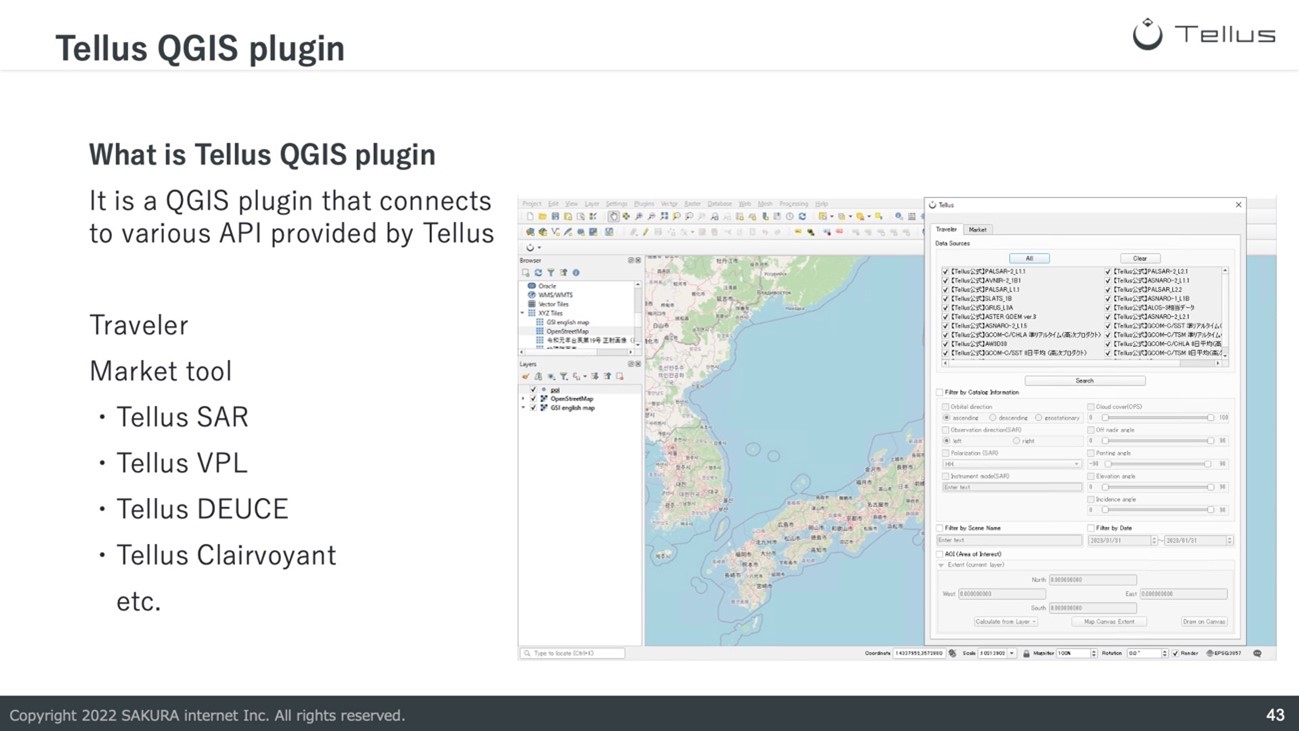
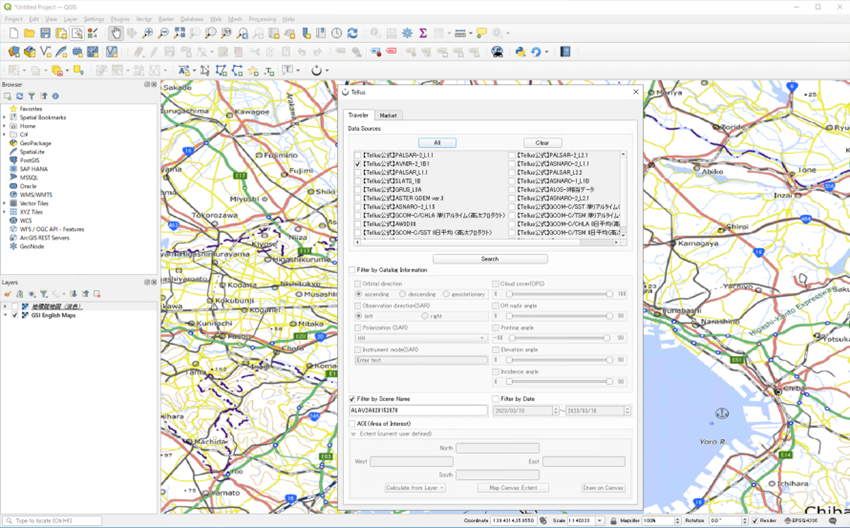
In “Tellus Satellite Data Master with QGIS,” “Tellus Plugin” (a QGIS plugin with functionalities to connect to different Tellus APIs), is available. It is possible to use services such as Traveler, a service for viewing available satellite data, and Tellus Market, where users can purchase Tellus official tools in the service.
In this tutorial, we will use Traveler to download and display AVNIR-2 satellite data containing the area around Tokyo station(139.766390,35.681170) into the scene.
However, as a large variety of data is available in Traveler, it is challenging to decide on the required data.
To confirm the contents of the images, let’s select data in TIFF format (.tiff). For optical satellites, files with the name “webcog.tif” are data that are colored images (true color composite images) represented in colors such as that seen with the human eyes.
■Procedures
1. Click on the “Tellus icon” from the menu bar to launch the plugin.
2. From the subject datasets, click on “clear” and put a checkmark into “【Tellus公式】AVNIR-2_1 B1.”
3. Put a checkmark into “AOI Search,” click on “draw on canvas,” and drag on the area around Tokyo station in the map canvas.
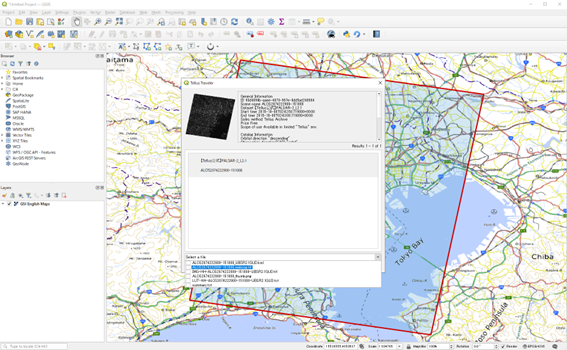
4. Click on “search,” and a list of search results is shown.
5. Select the satellite data with the scene name “ALAV2A275692880” from the search results and put a checkmark into “ALAV2A275692880_webcog.tif” from the pulldown list.
6. Click on “Download.”
7. After downloading the data, a dialog showing “Do you want to add the downloaded TIFF file to your map?” should be displayed. By clicking on “Yes,” the data is shown on the map.
※The video shows OpenStreetMap as a background map.
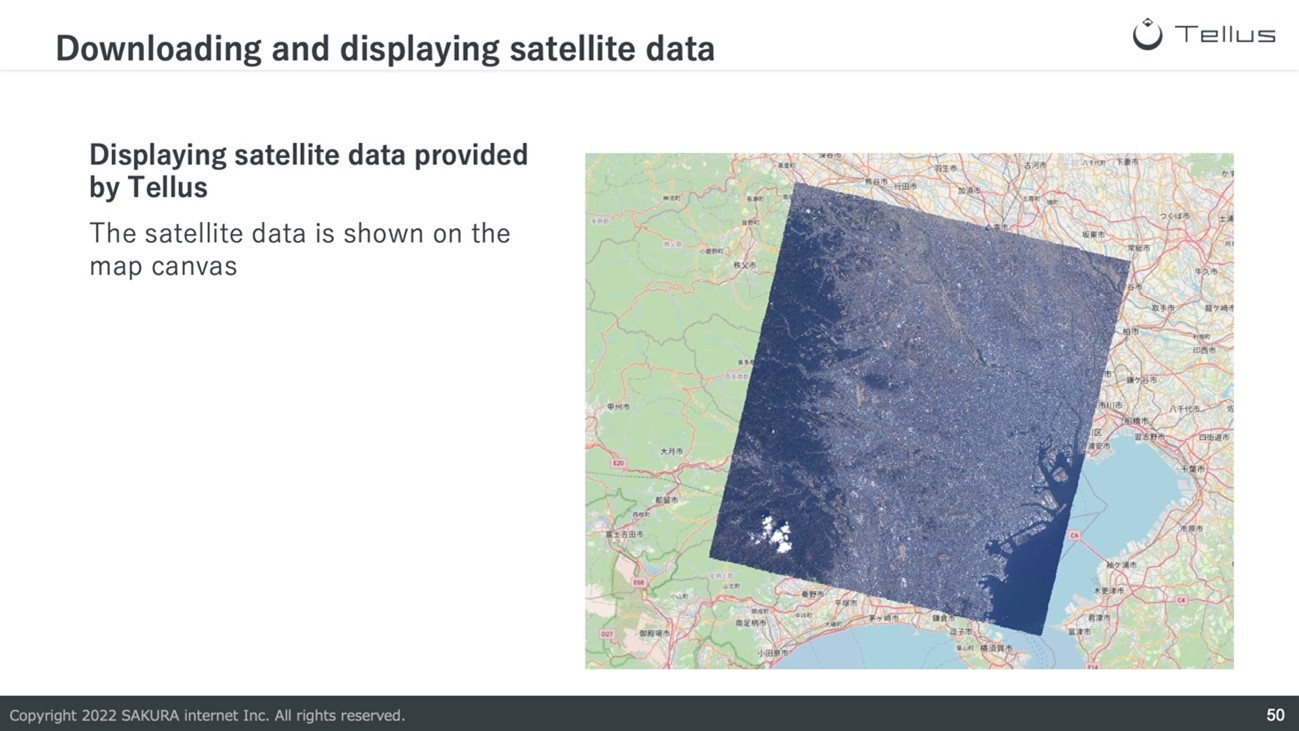
It is challenging to display satellite data in QGIS in local environments, as we will have to download satellite data from a specialized site and import it into QGIS.
Using the Traveler service in the Tellus plugin, the entire process is within QGIS so that satellite data can be readily displayed in QGIS.
Analyzation of Satellite Data
Next is an introduction to the analysis of satellite data.
In this tutorial, we will analyze the changes in land in the 23 wards of Tokyo by comparing SAR satellite data from two different periods.
The data used are the satellite data of PALSAR2 from 8th Oct. 2015 and 1st Sep. 2022.
Firstly, please download the satellite data through the following steps:
■Procedures
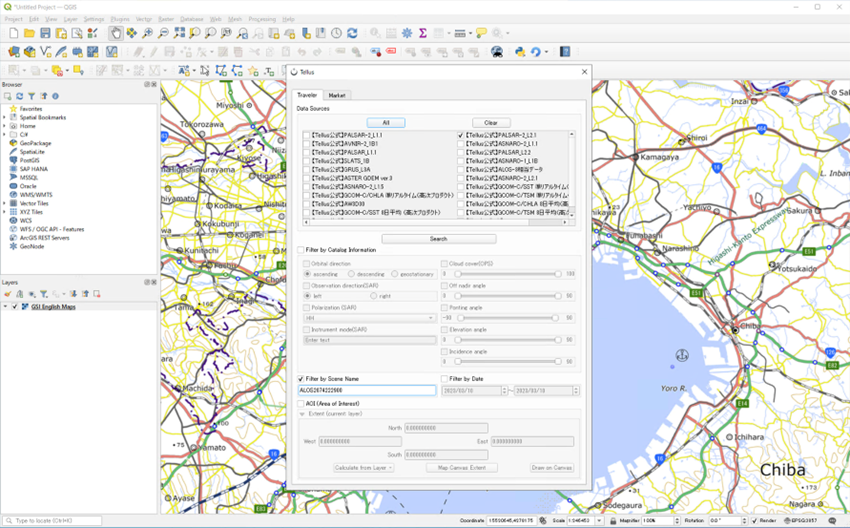
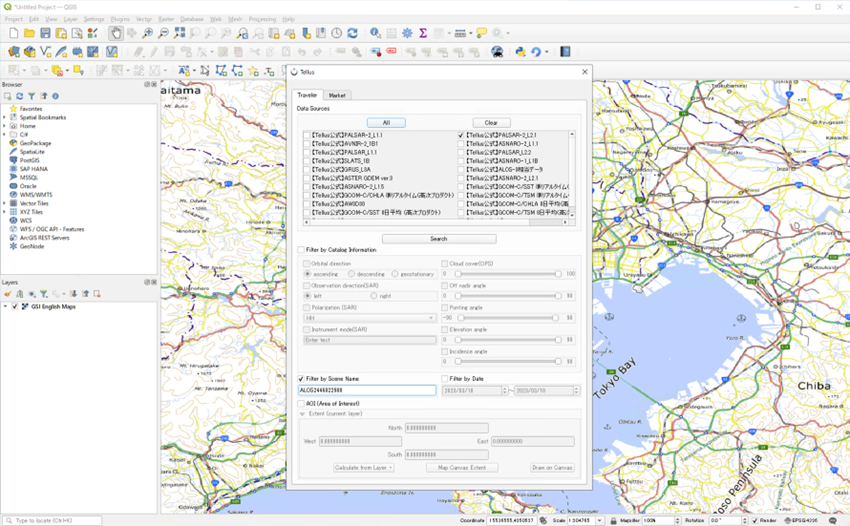
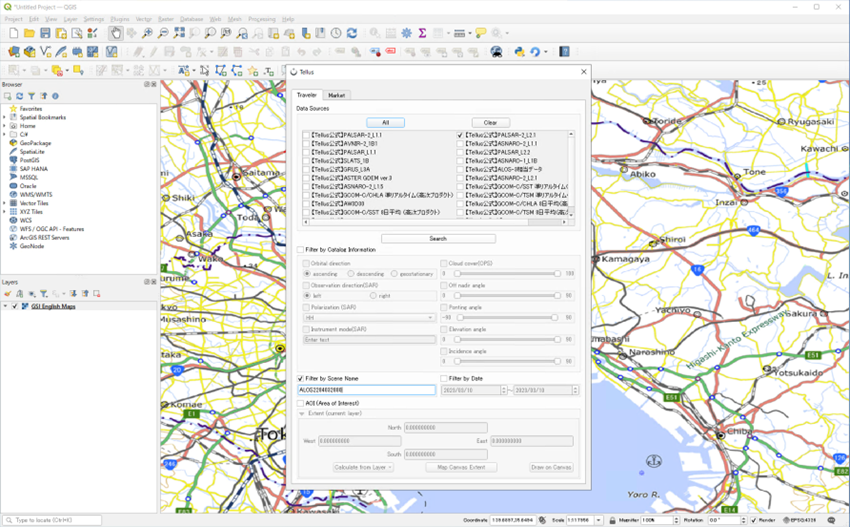
1. Click on the “Tellus icon” from the menu bar to launch the plugin.
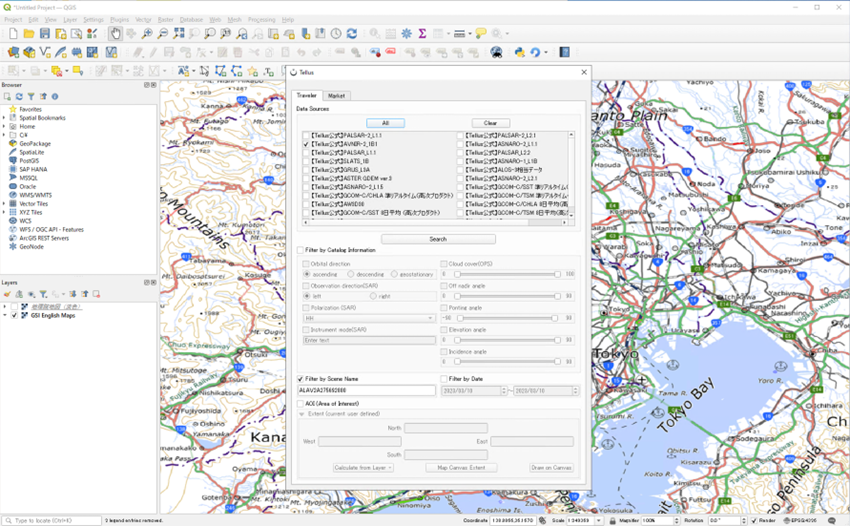
2. In subject datasets, click on “clear” and put a checkmark into “【Tellus公式】PALSAR2 L2.1.”
3. Put a checkmark into “Filter by Scene Name” and enter “ALOS2074222900.”
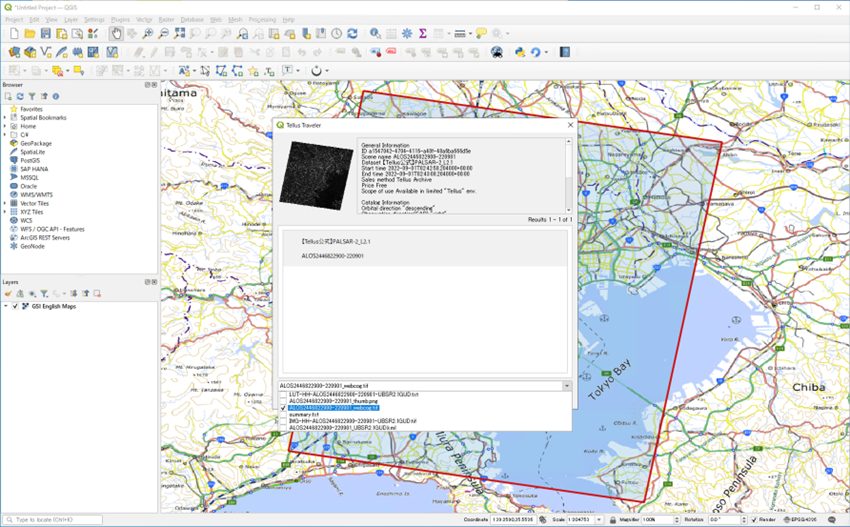
4. A list of search results is shown by clicking on the “Search” button.
5. From the search result, select the satellite data with scene name “ALOS2074222900,” and put a checkmark into “ALOS2074222900- 151008_webcog.tif” in the pulldown list.
6. Click on “Download.”
7. After downloading the data, a dialog showing “Do you want to add the downloaded TIFF file to your map?” should be displayed. By clicking on “Yes,” the data is shown on the map.※ Please repeat the above steps with the scene name “ALOS2446822900” and filename “ALOS2446822900-220901_webcog.tif” to download and display the second satellite data.
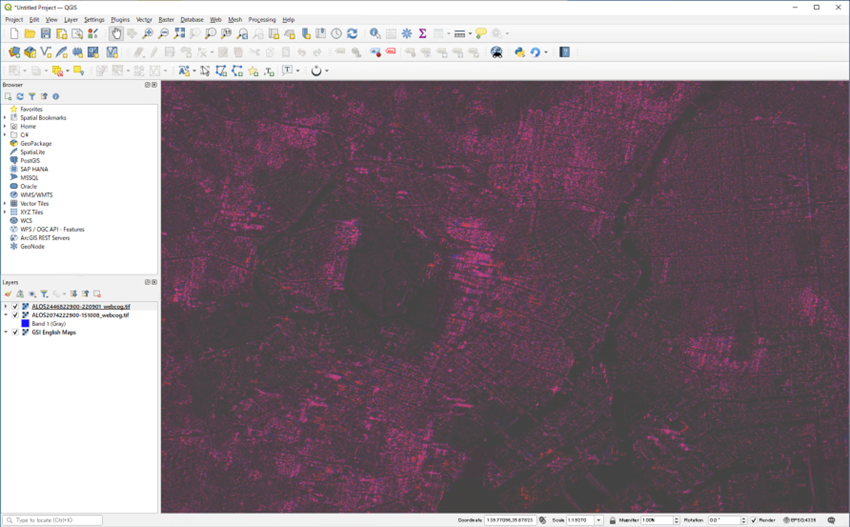
The above steps add satellite data from two different periods to the map canvas.
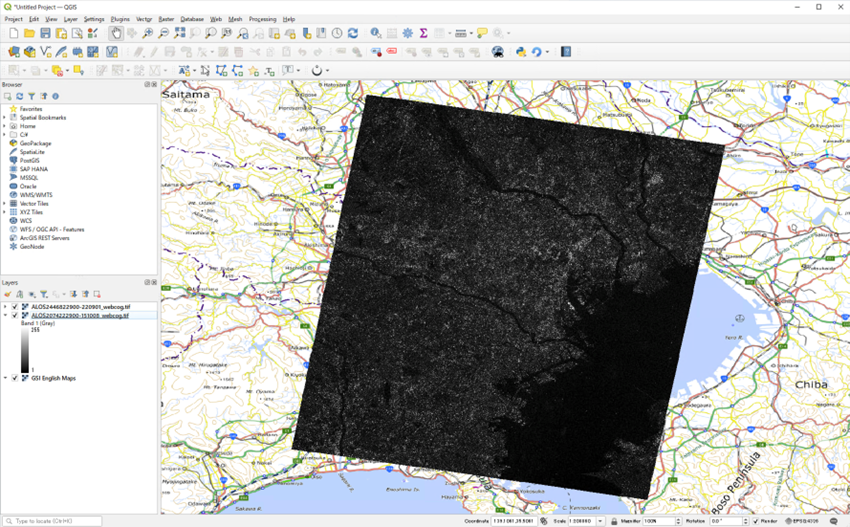
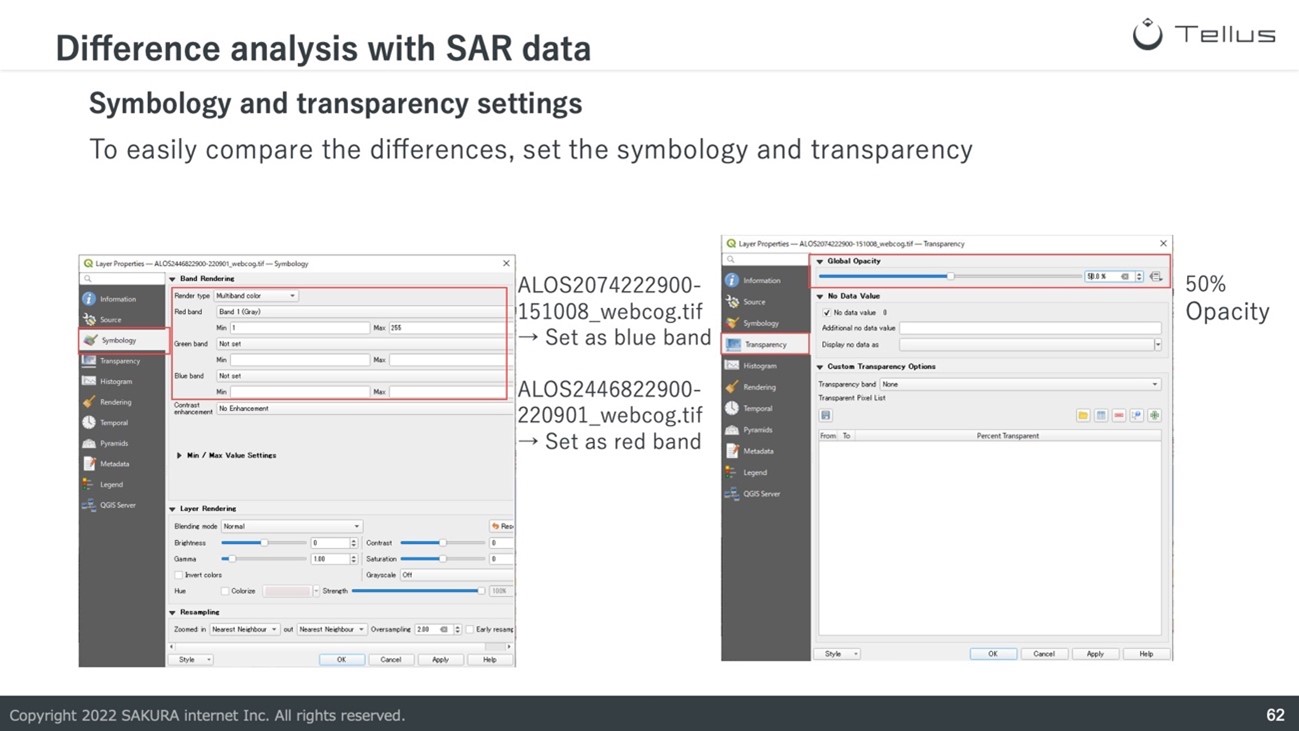
After that, we will set the symbology for the downloaded satellite data. In this tutorial, we will set the data from 8th Oct. 2015 to blue and the data from 1st Sep. 2022 to red to emphasize the difference between the data from the two periods.
■Procedures
< ALOS2074222900-151008_webcog.tif (8th Oct 2015) >
1. Right-click on “ALOS2074222900-151008_webcog.tif” in the layer panel, and click on properties
2. Click on the symbology tab, select “multi-band color” from rendering type and set “Band 1 (Gray)” as the blue band.
3. Click on the transparency tab and set the global opacity to 50%. Then click on ok at the bottom of the window.<ALOS2446822900-220901_webcog.tif (1st Sep 2022) >
1. Right click on “ALOS2446822900-220901_webcog.tif” in the layer panel, and click on properties
2. Click on the symbology tab, select “Multiband color” from rendering type and set “Band 1 (Gray)” as the red band.
3. Click on the transparency tab and set the global opacity to 50%. Then click on ok at the bottom of the window.
We can create a composite image by setting the data from 8th Oct. 2015 to blue and the data from 1st Sep. 2022 to red.
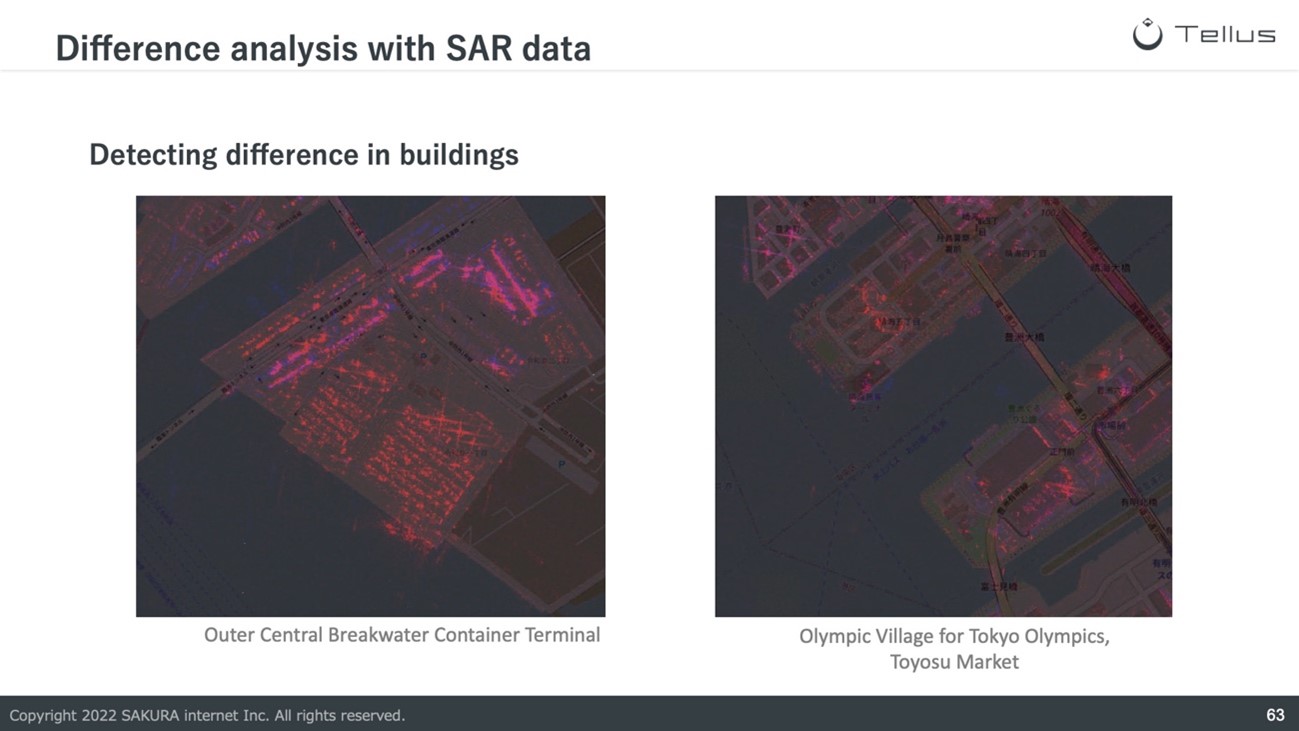
The image emphasizes locations where buildings exist only on 1st Sep. 2022 in red. Areas with buildings on both dates are displayed in purple, which is blended with blue and red.
Let’s look at the locations where we expect to have changed between 2015 and 2022.
The image on the left is the Outer Central Breakwater Container Terminal in Reiwajima(139.800859,35.591481), Tokyo. As this region is emphasized in red, we can believe there were no buildings in the area on 8th Oct. 2015.
The image on the right shows the Olympic Village for the 2022 Tokyo Olympics and the Toyosu Market(139.776729,35.646335). There are no large-scale buildings in the Olympic Village, so it is less apparent than in the previous image. However, parts of the image are emphasized in red, showing that some buildings were not present on 8th Oct. 2015.
The Toyosu Market to the South of the Olympic Village is shown in purple. Being shown in purple shows that the exterior of the building was completed as of 8th Oct. 2015.
Let’s predict the flood area around the Shinkansen railyard(138.27364, 36.69009) in Nagano due to Typhoon Hagibis in 2019 as another exercise of analyzing satellite data.
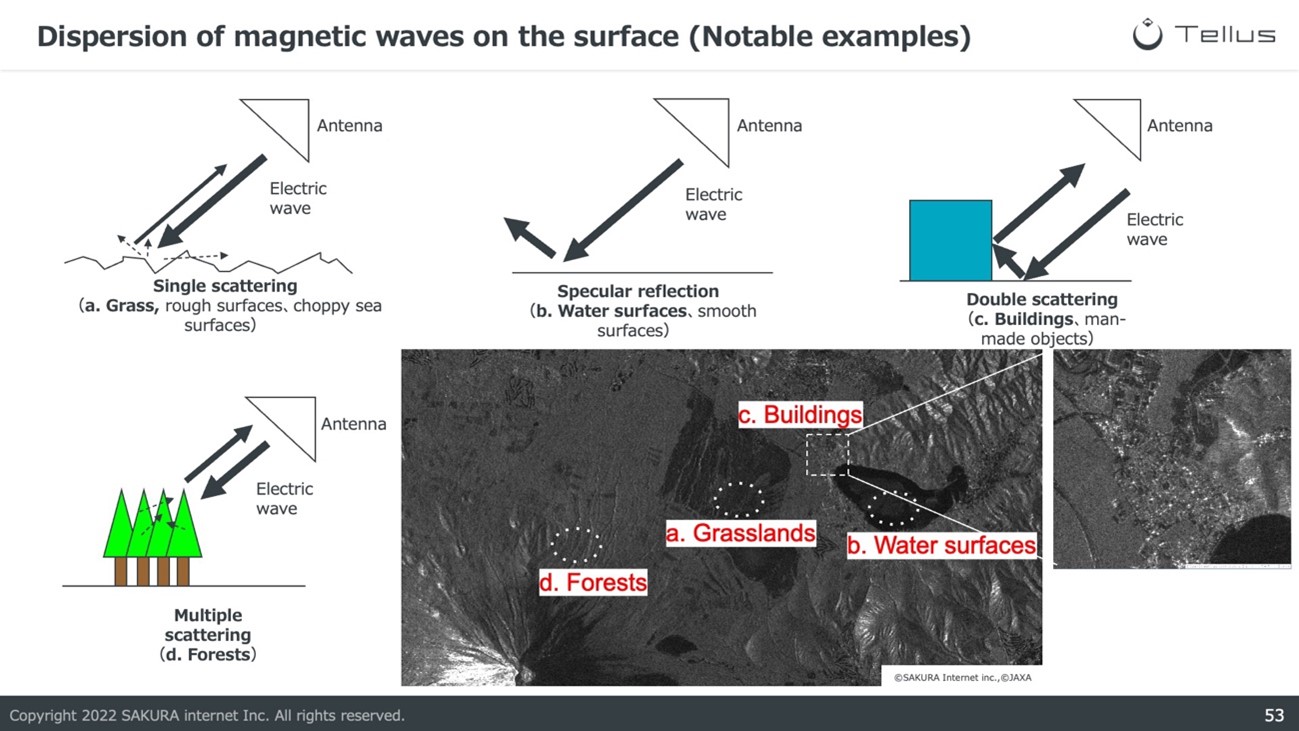
SAR satellites radiate microwaves and make observations by capturing the microwaves reflected from the land surface. Therefore, grasslands and rough terrain, which reflect a relatively large amount of radio waves, are shown in white. In contrast, water surfaces and smooth terrain, where radio waves are reflected in another direction, are shown in black.
When flooding occurs, the flooded areas previously shown in white will be shown in black instead. Using the color change, we can predict the area where flooding occurred.
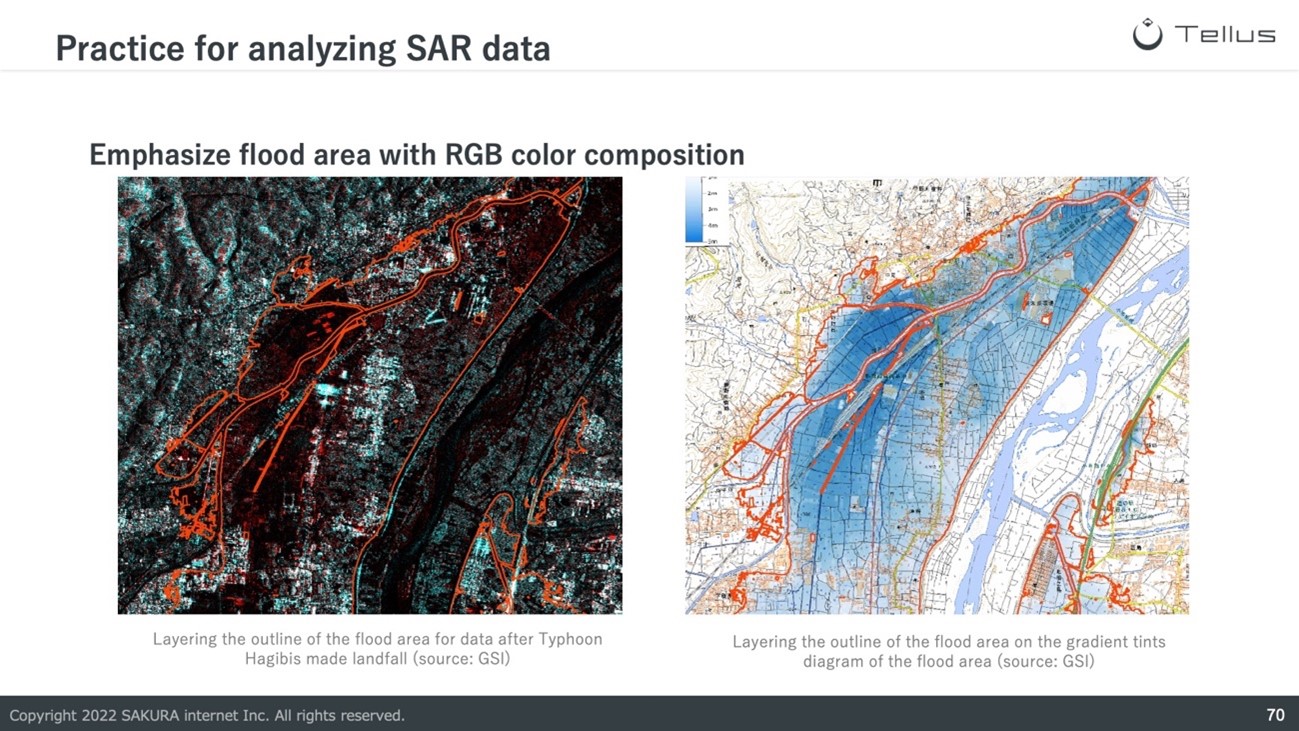
In this practice, we will create virtual raster data from satellite data taken at two different times and emphasize the flooded areas with RGB color composition.
With this method, we can merge the image before the disaster as red and the image after the disaster as blue and red to create a composite image where the flooded area is emphasized in red.
Let’s predict the flood area around the Shinkansen railyard in Nagano due to Typhoon Hagibis in 2019.
Firstly, please download the PALSAR2 satellite data from two different periods through the following steps, as shown in the previous exercise.
■Procedures
1. Click on the “Tellus icon” from the menu bar to launch the plugin.
2. In subject datasets, click on “clear” and put a checkmark into “【Tellus公式】PALSAR2 L2.1.”
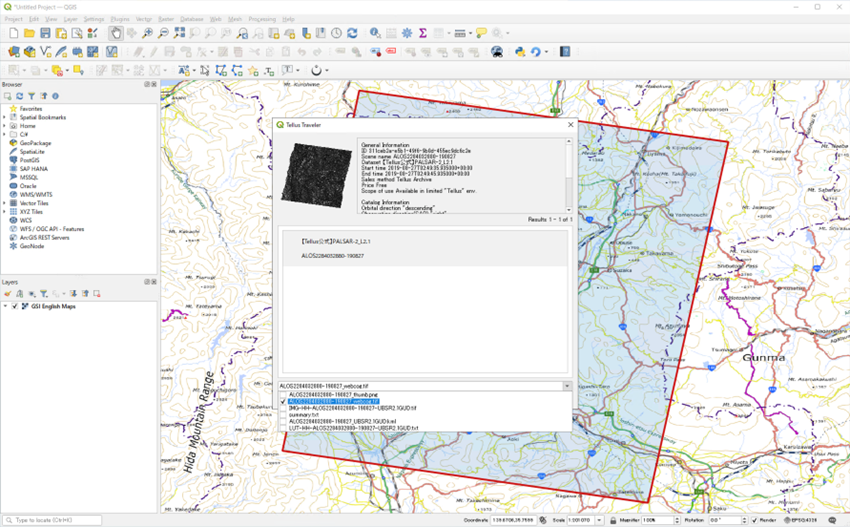
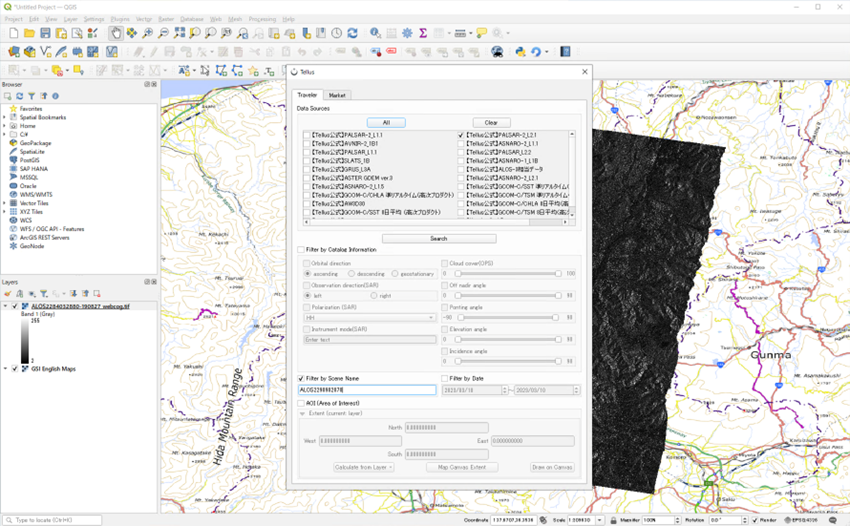
3. Put a checkmark into “Filter by Scene Name” and enter “ALOS2284032880.”
4. A list of search results is shown by clicking on the “Search” button.
5. From the search result, select the satellite data with scene name “ALOS2284032880,” and put a checkmark into “ALOS2284032880-190827_webcog.tif” in the pulldown list.
6. Click on “Download.”
7. After downloading the data, a dialog showing “Do you want to add the downloaded TIFF file to your map?” should be displayed. By clicking on “Yes,” the data is shown on the map.※Please repeat the above steps with the scene name “ALOS2290982870” and filename “ALOS2290982870-191013_webcog.tif” to download and display the second satellite data.
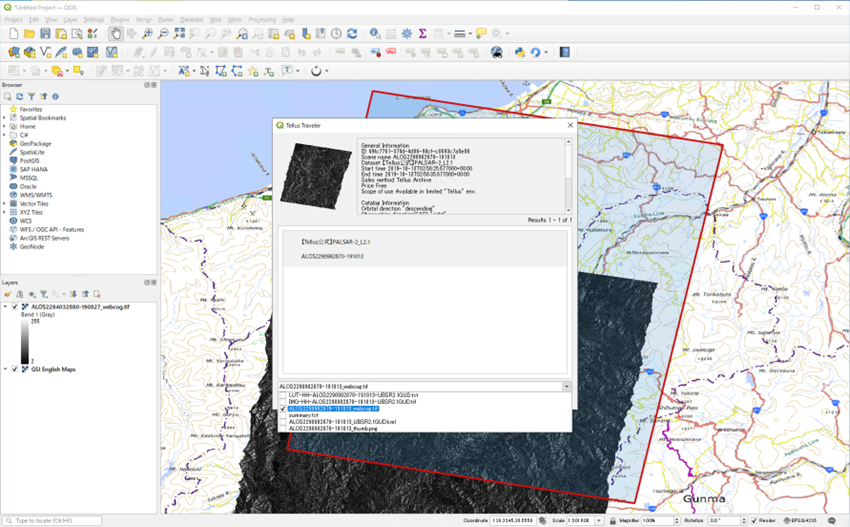
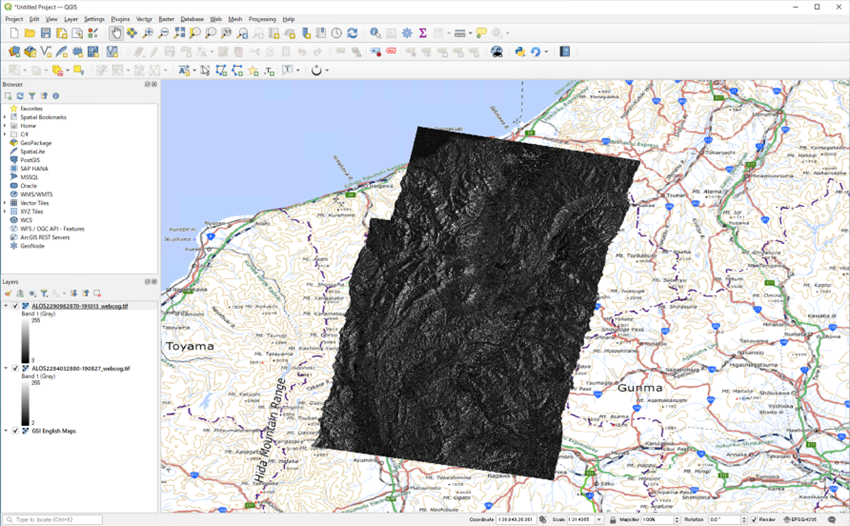
The above steps add satellite data from two different periods to the map canvas.
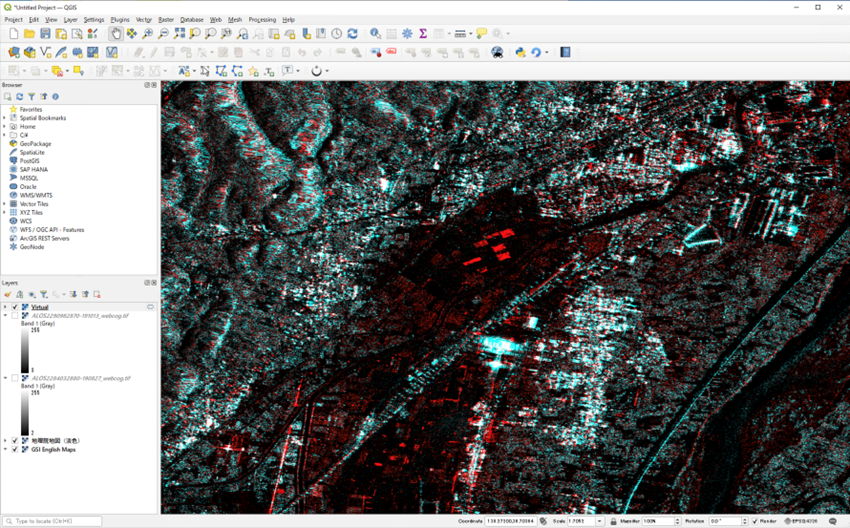
After that, we will create an RGB color composite image using QGIS’s basic functionalities. We will create a virtual raster from the SAR satellite data and conduct RGB color composition in the symbology panel.
■Procedures
1. From the menu bar click on ‘Raster” > “Miscellaneous” > “Build Virtual Raster…”
2. From Input Layers, put a checkmark into “ALOS2284032880-190827_webcog.tif” and “ALOS2290982870-191013_webcog.tif.”
3. Put a checkmark into “Place each input file into a separate band” and click on “run.”
4. Right-click “Virtual Raster” in the layer panel and click “Properties.”
5. From the “Symbology” tab, select band 1 as the red band and band 2 as the green and blue bands.
6. Change the brightness to 150 and the contrast to 65 in the layer rendering section and click on ok at the bottom of the page.
In the map canvas, let’s look at the area around the Shinkansen railyard in Nagano.
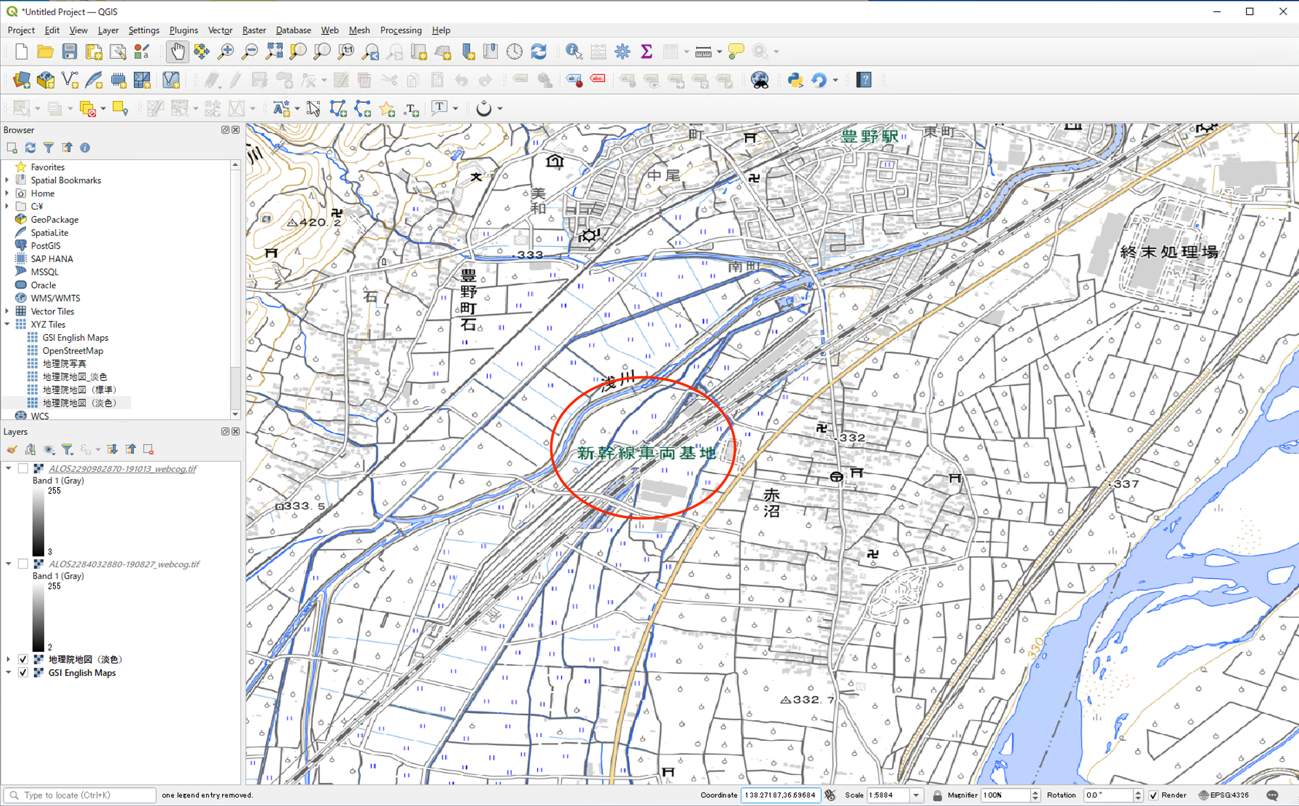
When closely looking at the area, we can see that area emphasized in red spreads around the Shinkansen railyard.
By comparing the red area with the outline of the flood area, together with the gradient tint diagram of the flood area released by the GSI in the “information on 2019 Typhoon Hagibis”, we can confirm that the area shown in red in the RGB color composition image is roughly the same as the flood area.
The analyses described are relatively easy to understand for beginners.
By practicing satellite data analysis, I hope you were able to understand the steps to download and analyze satellite data in “Tellus Satellite Data Master with QGIS.”
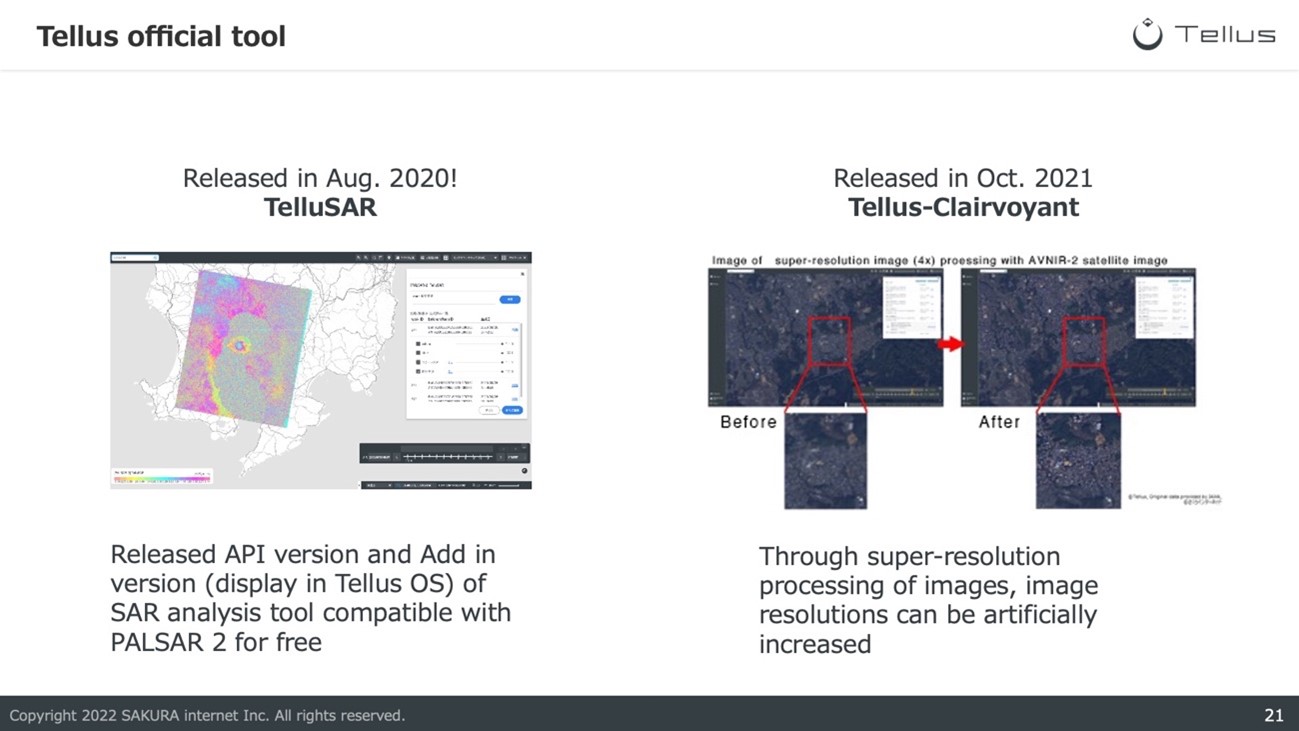
Introduction to Analyzations using Tellus Official Tools
The last section of this article will introduce analysis using the official tools of Tellus.
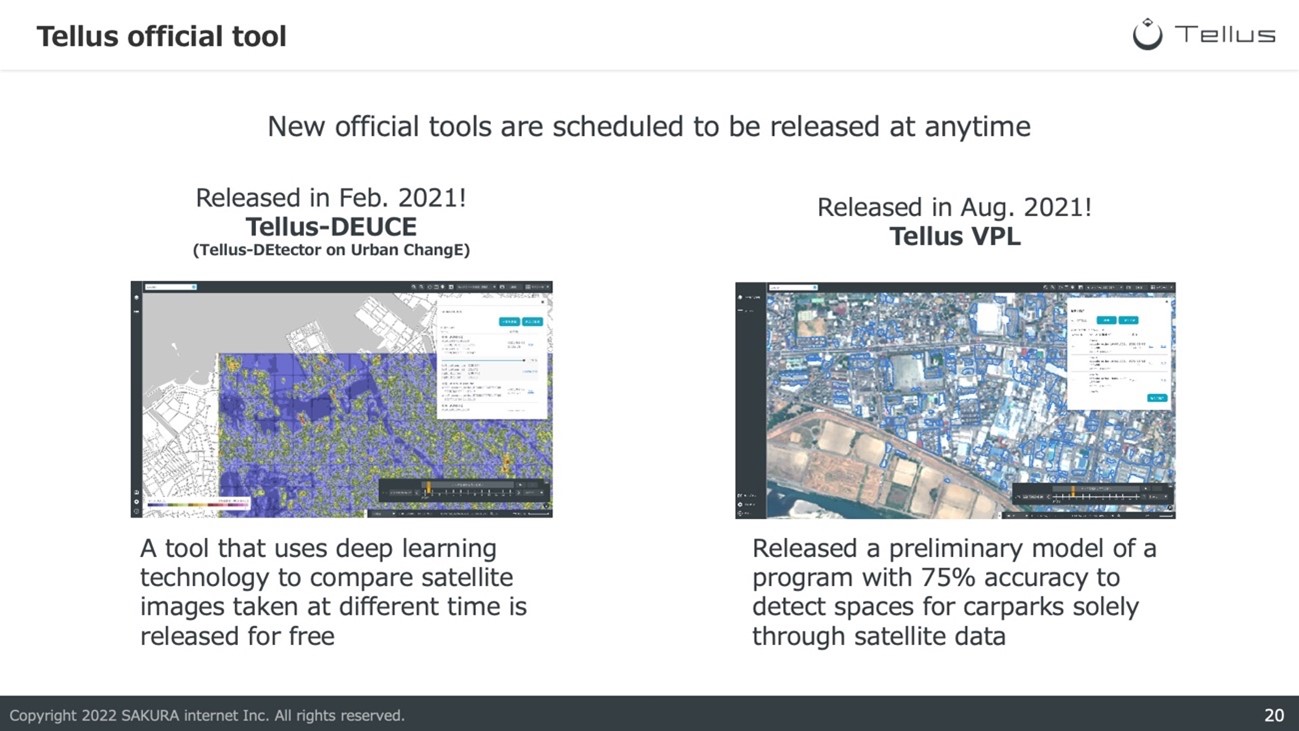
Currently, four Tellus Official tools have been released. This article will look at the analyses that can be made with “Tellus-DEUSE” and “Tellus-VPL.”
To use “Tellus-DEUSE” and “Tellus-VPL,” users must first purchase the APIs in the Tellus Market.
In July 2024, Tellus-DEUCE and Tellus-VPL offerings ended.
Automatic detection of potential sites for car parks with Tellus-VPL.
First, we will look at the ways to detect potential sites for car parks using Tellus-VPL automatically.
Tellus-VPL is a car park detecting tool that automatically detects spaces for new car parks with satellite data and AI image recognition technology developed by Ridge-i, an AI, deep learning technical consultant agency, Akippa, which operates the car park reservation app Akippa, and Sakura Internet.
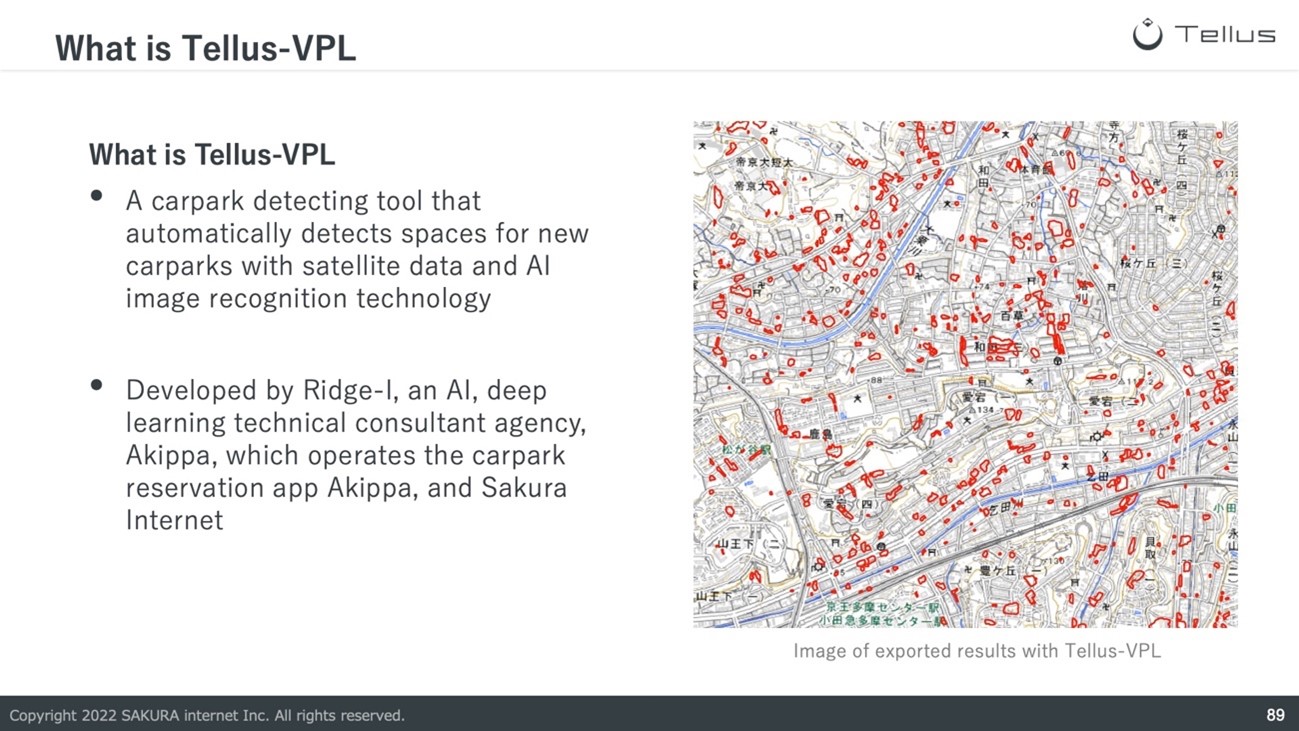
Akippa, the service that started the development of this tool, is a service that allows users to use available private car parks or monthly parking spaces temporarily. Therefore, the tool not only detects empty slots but is also tuned to detect locations that are currently car parks.
Please check out this article for a more in-depth introduction to Tellus VPL.
https://sorabatake.jp/21971/
※ Please be cautioned that Tellus-VPL currently only operates with pseudo-ALOS-3 data and may only be in two locations within Japan (Nagano city, Fukuoka city) and two overseas (Hanoi, Manila).
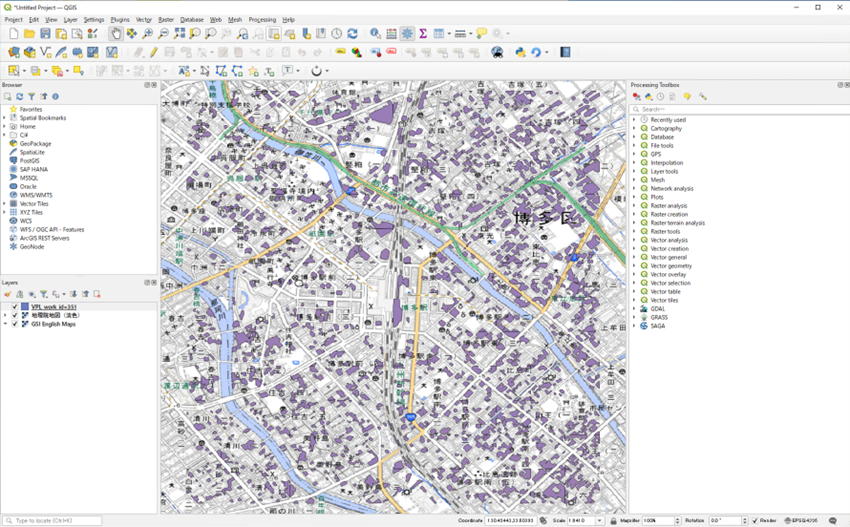
This tutorial will automatically detect potential spaces for new car parks around Hakata station(130.420791,33.589938), Fukuoka using Tellus-VPL from the Tellus plugin.
The procedures for this analysis involve selecting the pseudo-ALOS3 data and scene that will become our analyzation target. After that, we will select the area where we would like to automatically detect new parking spaces by clicking on the map canvas.
■Procedures
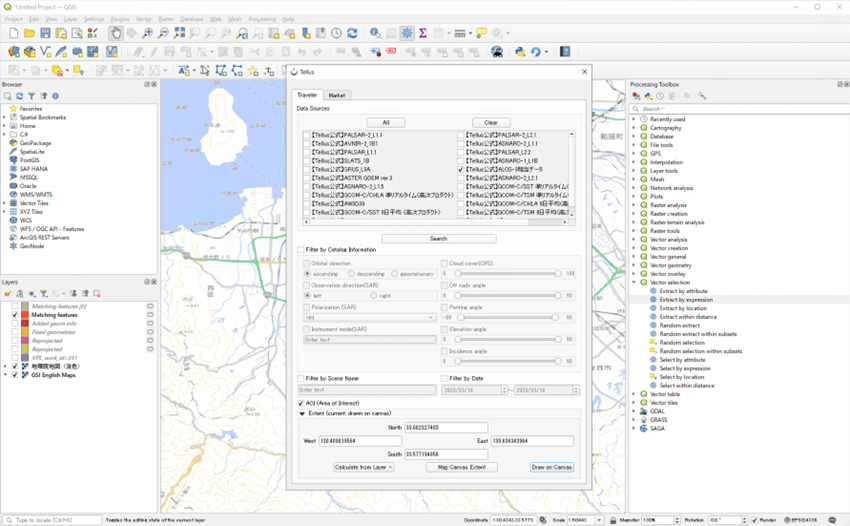
1. Click on the “Tellus icon” from the menu bar to launch the plugin.
2. Select the Market tab and select “Tellus-VPL(API)” from tools.
3. Select “ALOS3-pseudo” from “Satellite” and click on “Search in Display Area” while displaying the area around Hakata station.
4. Select “alos3-pseudo_ortho_103001004677e700:2015-08-02702:11:18+00:00” from scenes.
5. Click on “Select area” and click on the area around Hakata station in the map canvas.
※ The rectangle shown on the map after clicking is the target area of the process.
6. Click on “Execute Processing the Selected Scene” to start processing the data
※ It may take a few minutes before the process is complete
7. After the processing is completed, click on “Refresh” and you should be able to click on the “Display processing result” button.
8. Click on the “Color Map” button to download the processing results and add the results to the map.
※ Step 7 is skipped in the following video as processed data is added in the video.
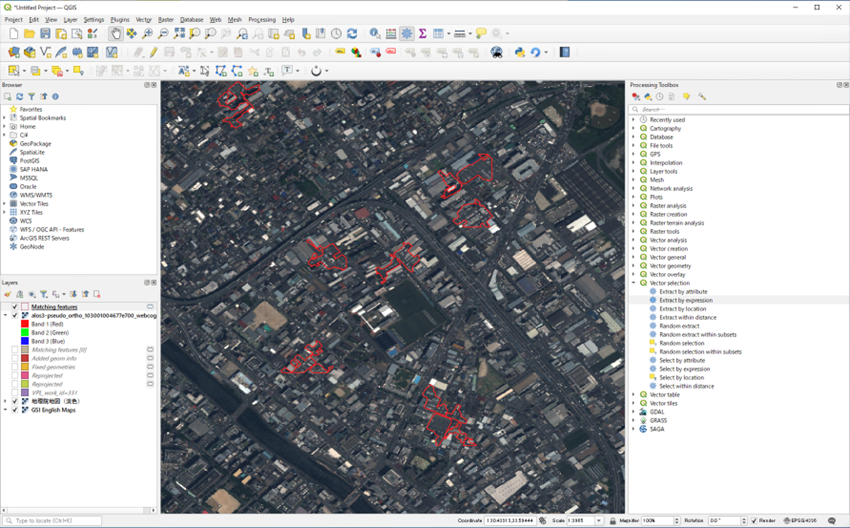
Tellus-VPL extracts potential sites for new car parks as polygons on the map canvas. As you can see, extracting potential sites for new car parks with Tellus-VPL is very easy.
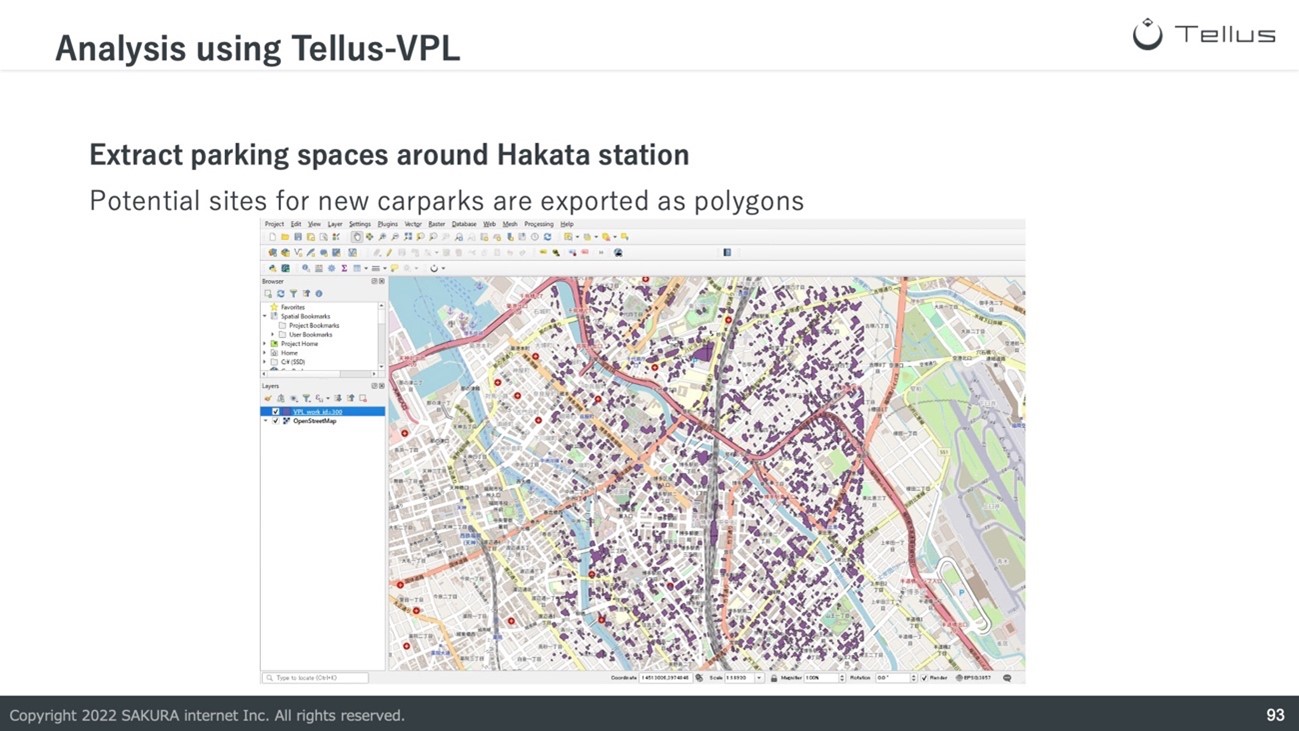
Tellus-VPL does not only extract potential sites for new car parks. It is also able to filter out sites that fit specific requirements. In actual use cases, companies would then conduct site investigations on the results to create new parking spaces.
By confirming the locations extracted, we can see that the sizes of the sites range from small spaces, where only a few cars can park, to large-scale sites for car parks, where more than ten cars can be parked.
Therefore, we will now try to extract parking spaces over a certain size by calculating the size of the polygons extracted. However, please note that this is a more advanced tutorial.
The procedures are as follows.
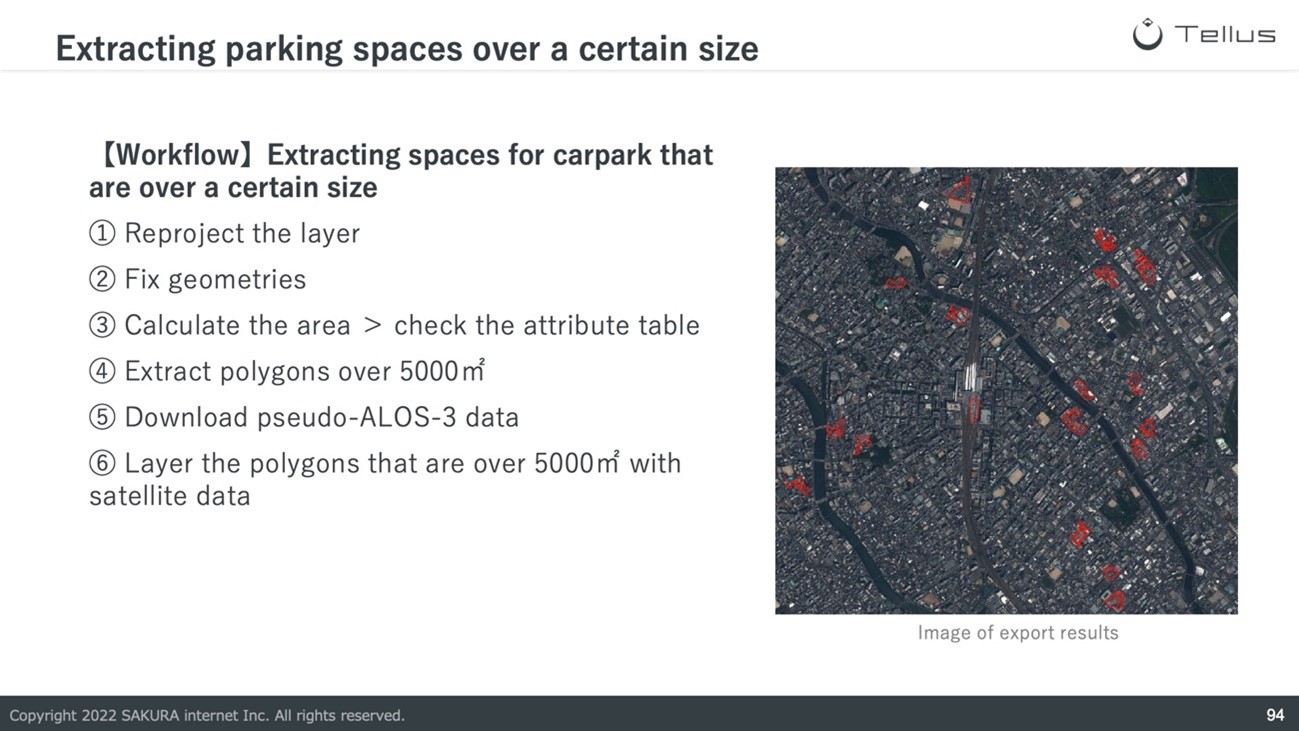
1. Reprojection of layers.
Tellus-VPL results are exported in a coordinate system using latitude and longitude. As coordinate systems using latitude and longitude are not suitable for calculating areas, we will reproject the results so that it uses a plane rectangular coordinate system.
From the menu bar, select “processing” > “Toolbox,” and a “Processing toolbox” will be shown on the right.
By selecting “Vector general” > “Reproject Layer” from the “Processing toolbox,” the “Reproject Layer” panel will be shown.
Select “VPL_work_id=●●●,” the output results of “Tellus-VPL,” as the input payer.
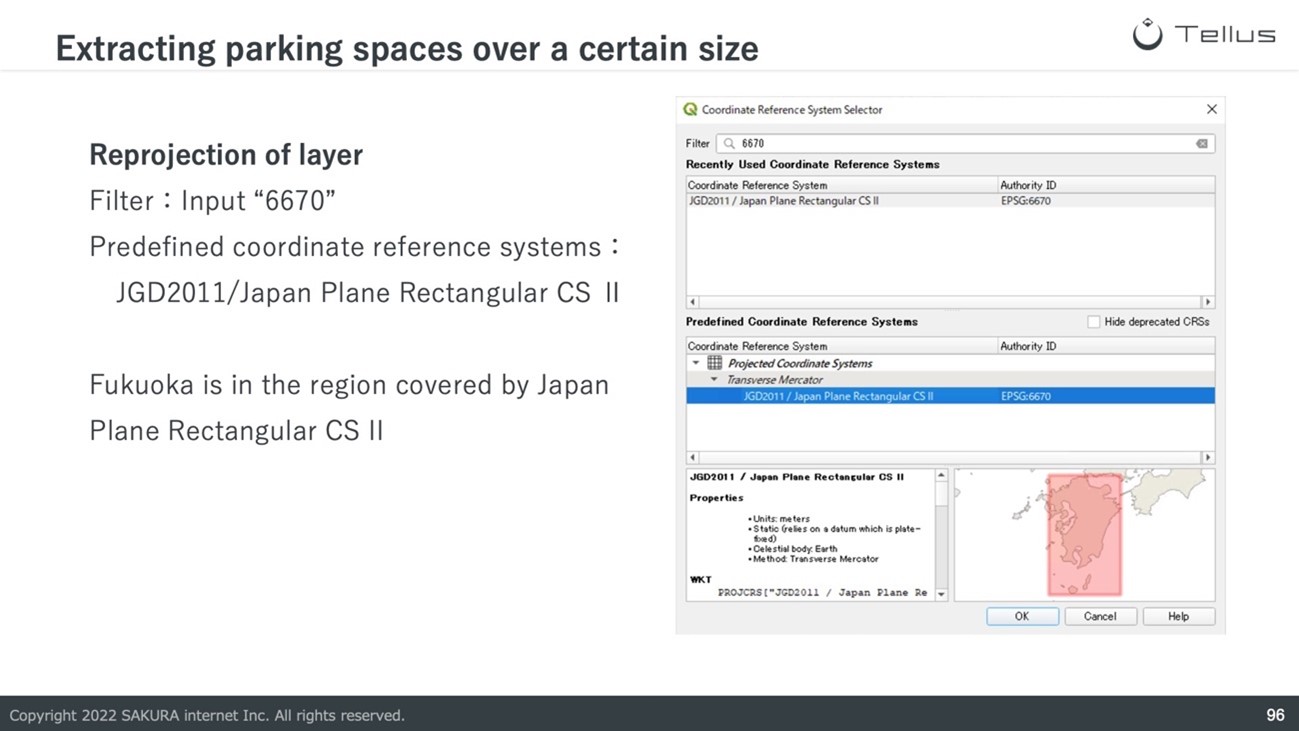
For the Target CRS, click the Earth icon on the right, input 6670 into Filter, select “JGD2011/Japan Plane Rectangular CS II” from predefined coordinate reference systems and click on “ok” > “Run.”
※ The target CRS differs for different regions. In this tutorial, we are using Japan Plane Rectangular CS II as we are processing data from Fukuoka, Japan.
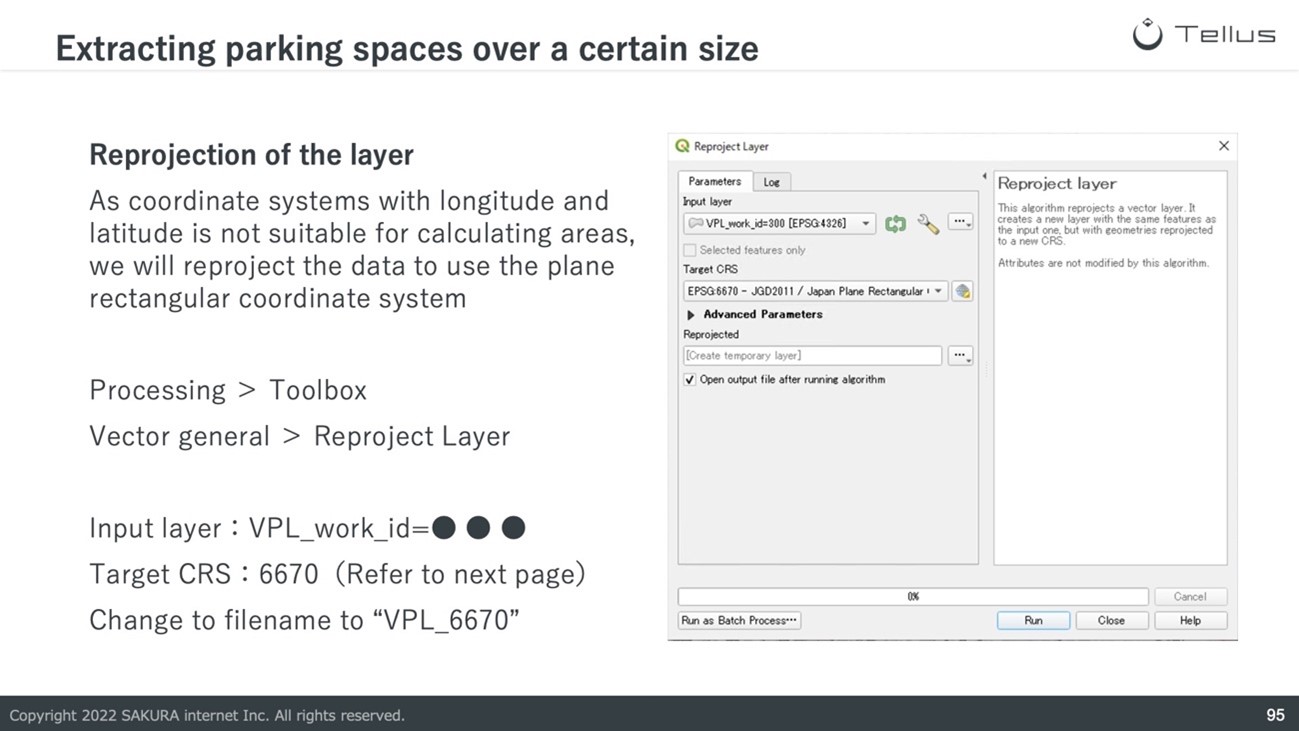
A layer with the name “Reprojected” should be added to the layer panel. Let’s change the layer’s name to “VPL_6670” by right-clicking on the layer and clicking “Rename Layer.”
2. Fix geometries
There may be invalid geometries in the calculation results of Tellus-VPL. As errors may occur in calculating areas at this state, we will fix the geometries of the results.
From the processing toolbox, select “Vector Geometry” > “Fix Geometries,” and the “Fix Geometries” window is shown.
Select “VPL_6670” as the input layer and click “Run.”
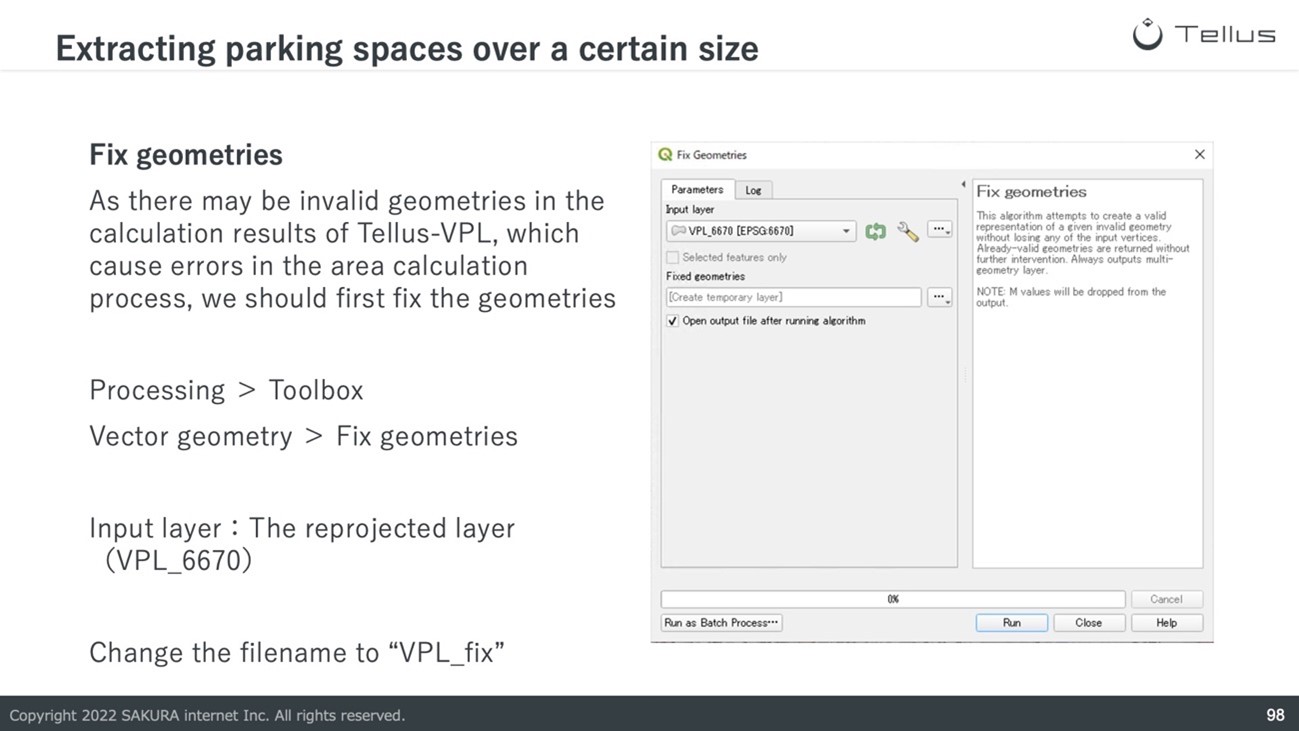
As the layer would be added to the layer panel with the name “Fixed Geometries,” let’s change the layer’s name to “VPL_fix.”
3. Calculate the area and confirm the attribute table of geometries>属性テーブルの確認
With the above steps, we have finished the preparation for calculating the area of the output result.
By selecting “Vector Geometry” > “Add Geometry Attributes,” an “Add Geometry Attributes” table is shown.
Select “VPL_fix” as the input layer, and click on Run with “layer CRS” as the selection for “Calculating using.”
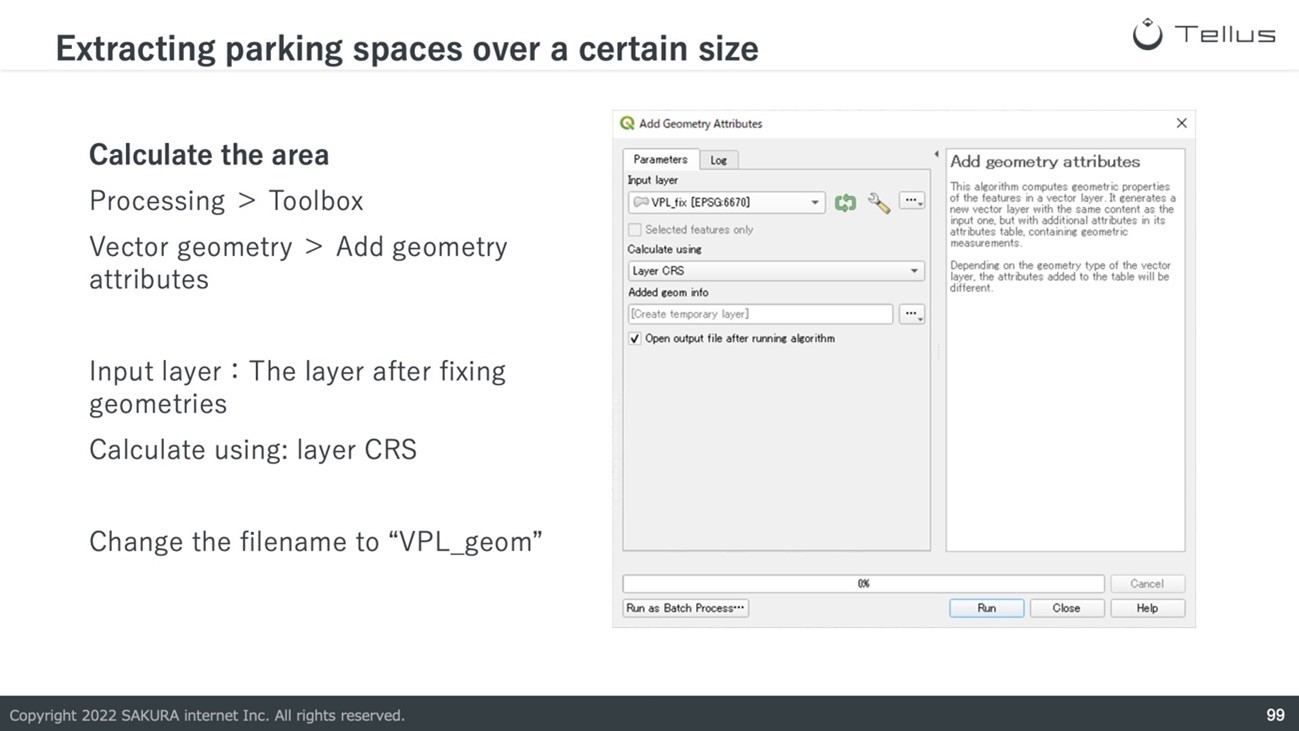
As a layer with the name “Added geom info” is added to the layer panel, let’s change the layer’s name to “VPL_geom.”
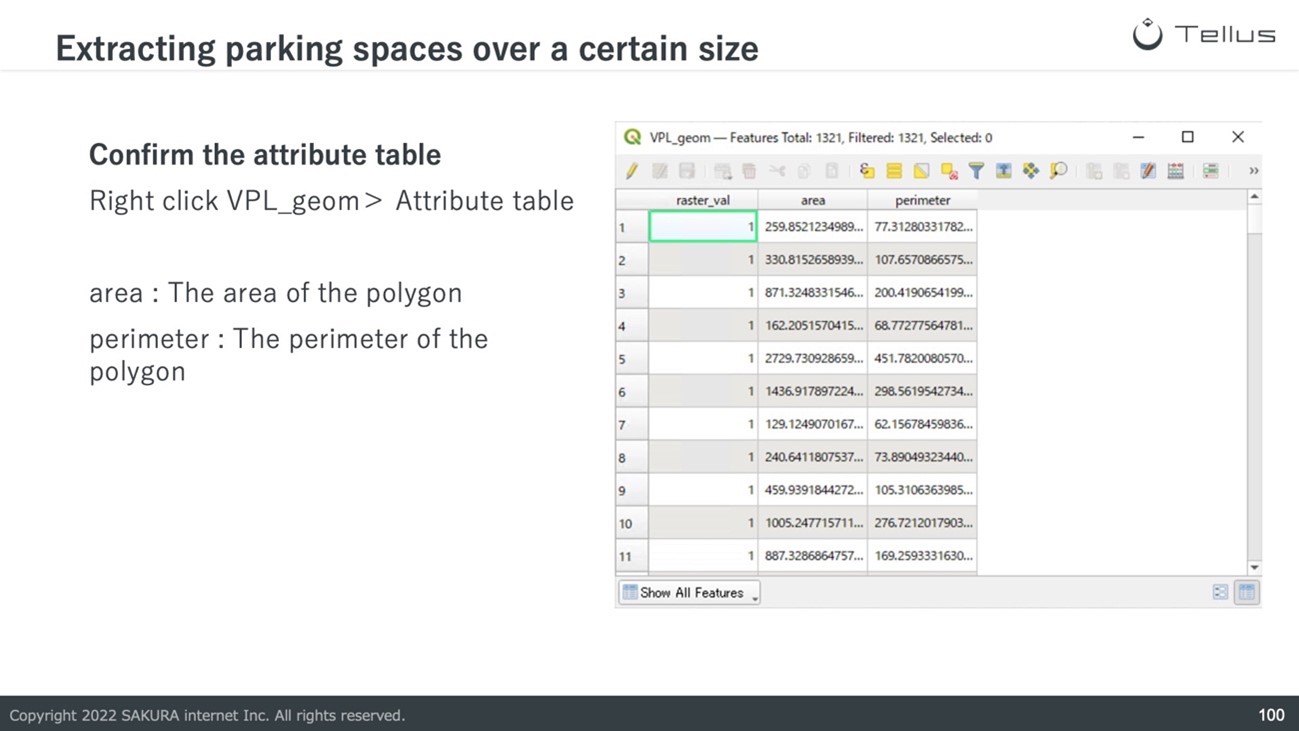
By right-clicking on “VPL_geom” in the layer panel and clicking on “Open Attribute Table,” the attribute table is shown. We can confirm that areas of the sites are calculated in the field with the name “area.”
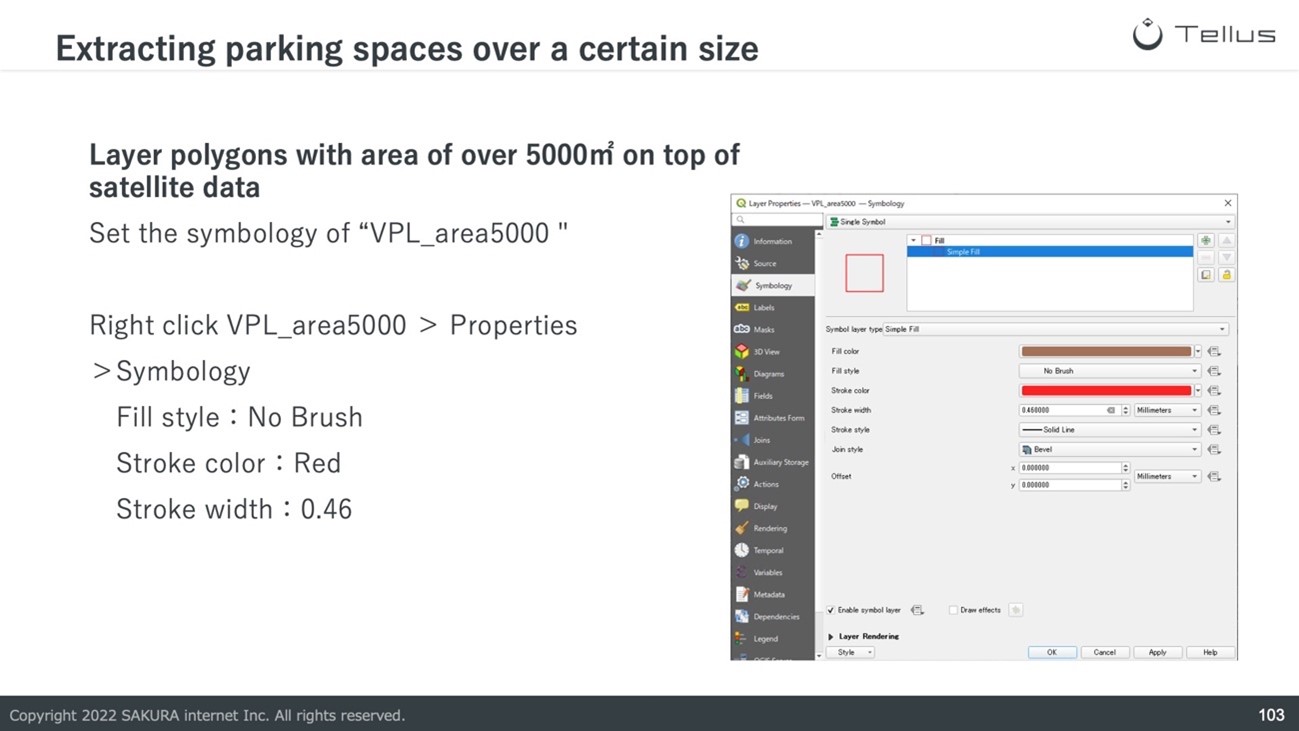
4. Extract polygons over 5000m2
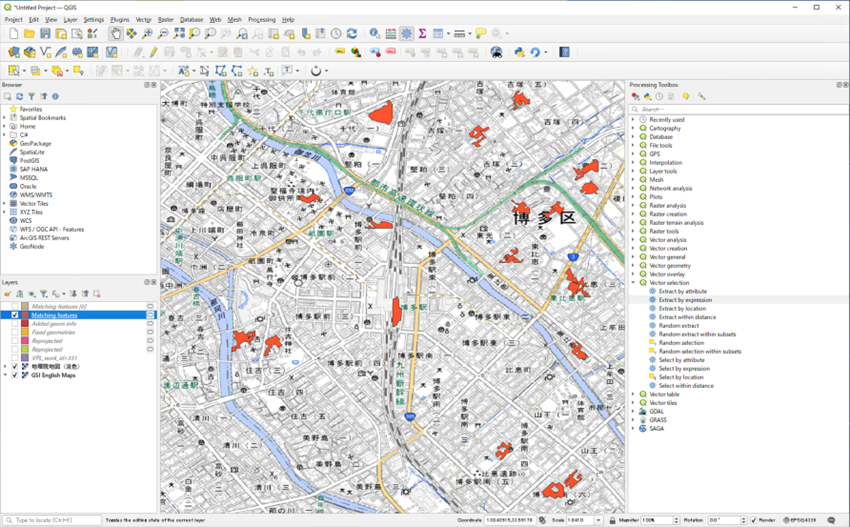
From the “Processing Toolbox,” select “Vector Selection” and “Extract by Expression” to show the “Extract by Expression” window.
Select “VPL_geom” as the input layer and type in ‘”area” >= 5000 ‘ for the expression. With this expression, we can extract potential sites with the requirement of “The area field is not less than 5000 m2.“
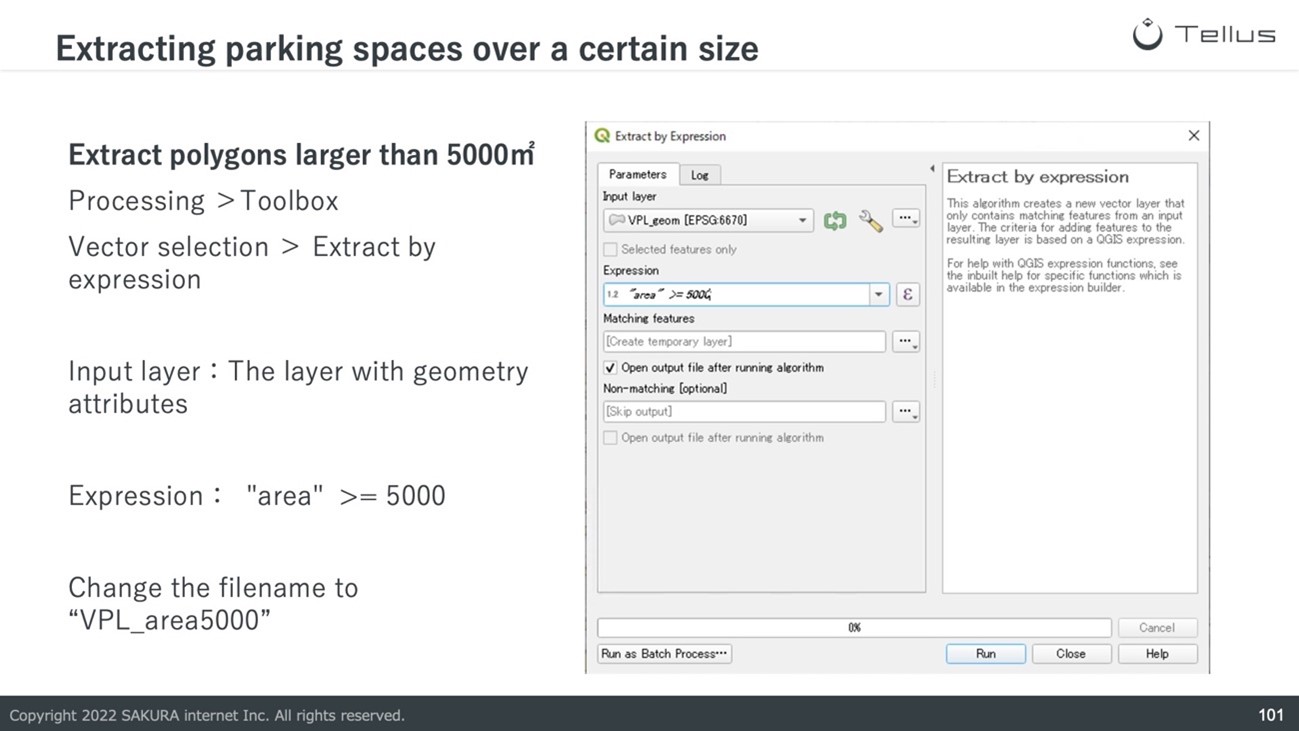
As a layer with the name “Matching features” is added to the layer panel, let’s change the layer’s name to “VPL_area5000.”
With the above procedures, we were able to extract the potential sites for new car parks with an area of over 5000m2.
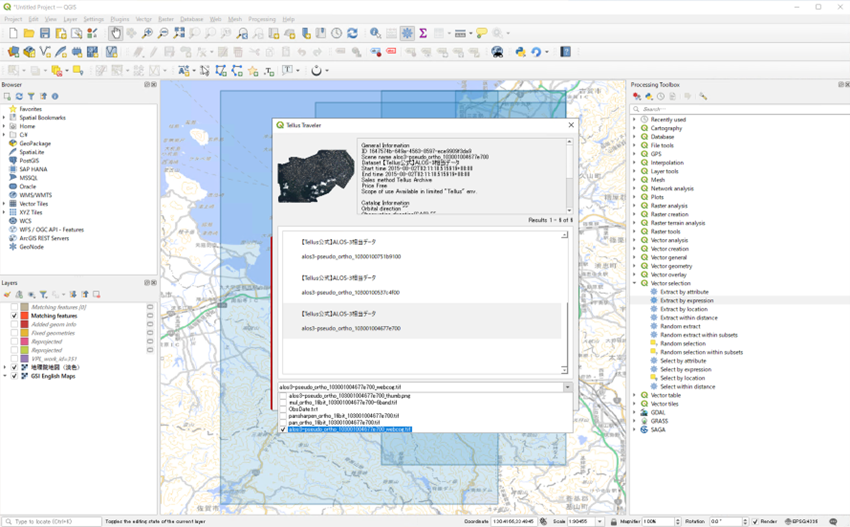
5. Download pseudo ALOS-3 data from Traveler
At last, let’s download the pseudo-ALOS-3 data used for analysis and layer that with Tellus-VPL extraction results to confirm the analysis results.
■Procedures
1. Click on the “Tellus icon” from the menu bar to launch the plugin.
2. From subject datasets, click on “Clear” and put a checkmark into “【Tellus公式】ALOS-3相当データ”
3. Put a checkmark into “AOI (Area of Interest),” click on “Draw on Canvas,” and drag the mouse around Hakata station.
4. Click on “Search” and a list of search results are shown.
5. From the list of search results, select the scene with name “alos3-pseudo_ortho_103001004677e700” and put a checkmark into “alos3-pseudo_ortho_103001004677e700_webcog.tif” in the pulldown below.
6. Click on “Download.”
7. After downloading the data, a dialog showing “Do you want to add the downloaded TIFF file to your map?” should be displayed. By clicking on “Yes,” the data is shown on the map.
From the layer panel, move “alos3-pseudo_ortho_103001004677e700_webcog.tif” so that it is below “VPL_area5000” to layer “VPL_area5000” above the satellite data.
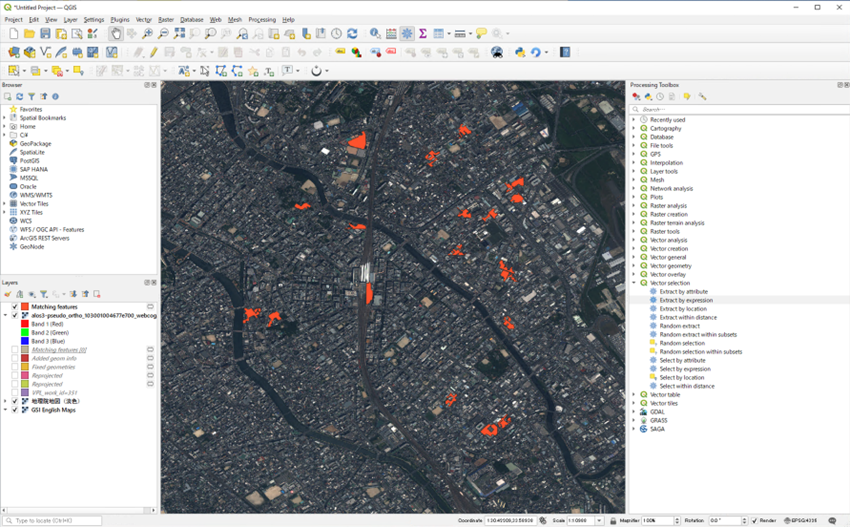
Right-click on “VPL_area5000” > Open the “Symbology” tab from the “Properties” menu and adjust the settings so that it is easy to confirm areas where the extracted sites cover the satellite data.
As the area around Hakata station is highly developed, there are few empty plots of land. By confirming the results, we can see that areas already used as car parks are extracted correctly.
Extracting Changes in Urban Area Using Tellus-DEUCE
This section will look at how to extract urban area changes using Tellus-DEUCE.
Tellus-DEUCE is a tool that uses deep learning technology to automatically extract changes in urban areas and buildings from AVNIR-2 and pseudo-ALOS-3 optical satellite data taken at two different periods.
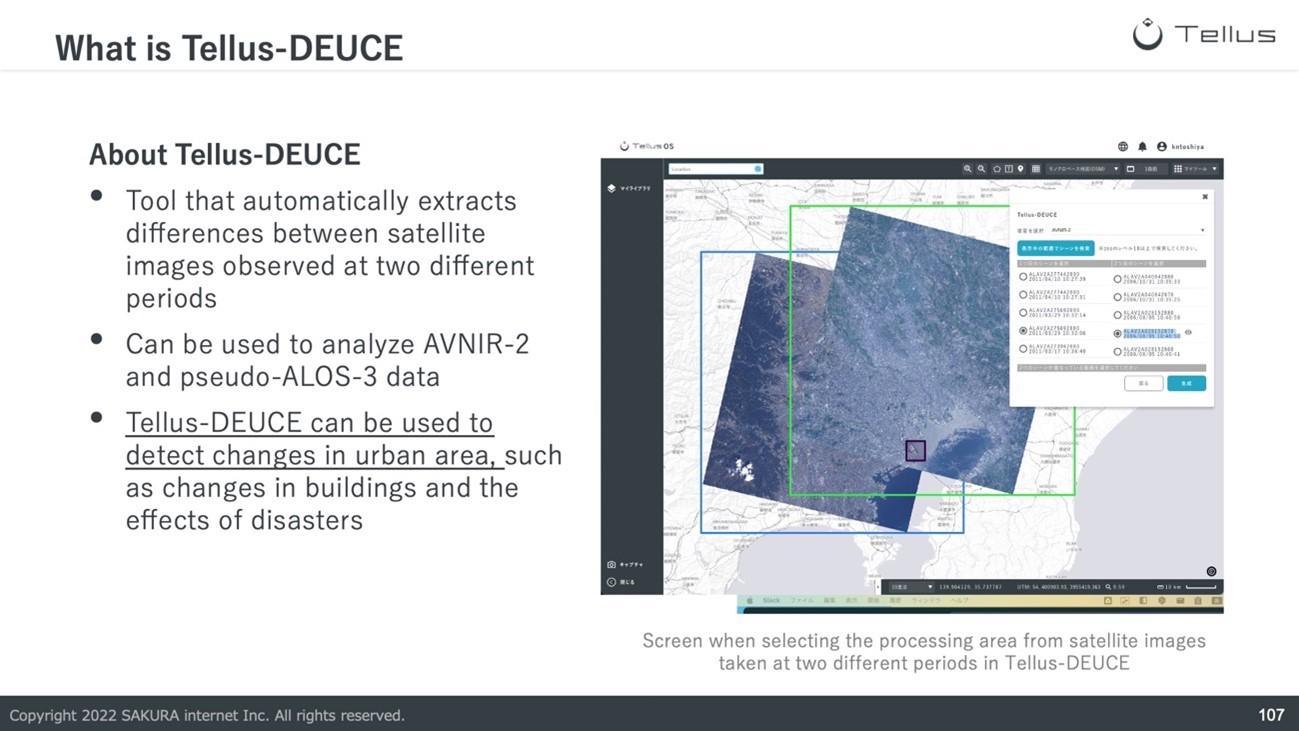
By using tools like Tellus-DEUCE to extract changes between satellite images between two different periods, we can understand the construction situation of buildings in remote locations and the effects of disasters.
Such technology can be used in a wide range of industries, including to understand the rebuilding of structures in the real estate industry, the economic growth of cities in the finance industry, the damaged areas in disasters for the insurance industry, and to understand the construction and development situations of overseas projects in the trading and construction industries.
Please check out (this article) for more information on Tellus-DEUCE
Automatic extraction of changes in cities and buildings from two satellite images! New Tellus tool “Tellus-DEUCE” is now available.
Let’s try to extract the changes around Haneda Airport(139.783135,35.549461) with Tellus-DEUCE from the Tellus plugin as in practice with Tellus-VPL.
The procedure for this practice is first to select the base scene and the scene that would be used as the comparison target. Then, the base scene on the map would be represented as green polygons, while the comparison target would be blue polygons.
After that, extraction of changes would start by zooming into the area on the map where the two scenes overlap and clicking on “Search in Displayed Area.”
■Procedures
1. Click on the “Tellus icon” from the menu bar to launch the plugin.
2. Select the Market tab and select “Tellus-DEUCE(API): from tools.
3. Select “AVNIR-2” from “Satellite” and click on “Search in Display Area” when the area around Haneda Airport is shown. Through this step, we would be able to search for scene that contain Haneda Airport.
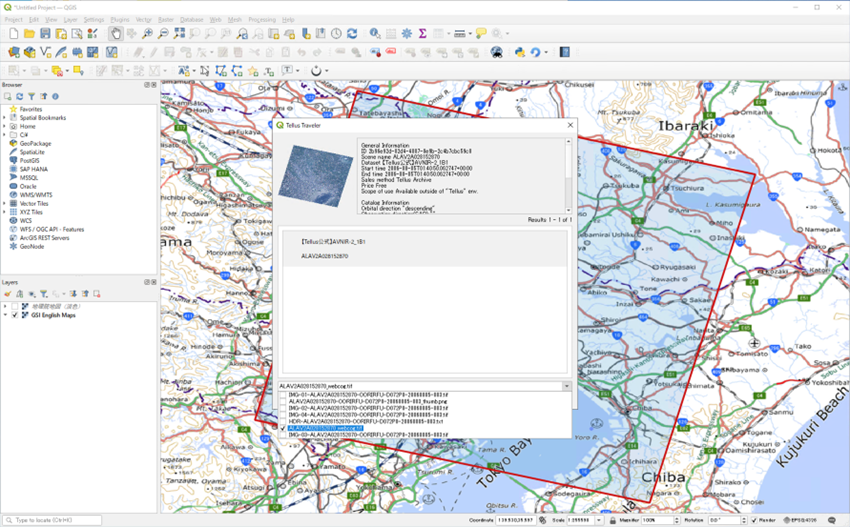
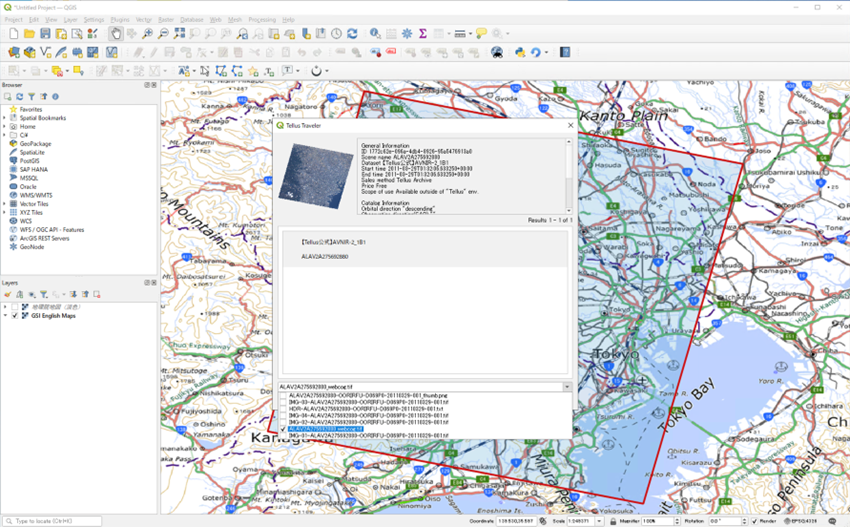
4. Select “ALAV2A028152870-2006-08-05T01:40:50+00:00” as base (green) and “ALAV2A275692880-2011-03-29T01:32:06+00:00” as comparison target (blue).
5. Click on “Execute Processing within the Range of the Display” when showing the area around terminal 3 of Haneda Airport.
▼The area around the map canvas will be processed.
▼It may take a few minutes until the processing is completed.
6. When the processing is completed, click on “Refresh” so that we can click on the button to “Display Processing Results”
7. By clicking on the “Display Results” button, the results of the operations would be downloaded and added to the map canvas
※ Step 6 is skipped in the video as processed data is used.
The result when changes in Haneda Airport from 5th Aug. 2006 to 29th Mar. 2011 are extracted with AVNIR-2 satellite data is shown below. The area around terminal 3 is colored yellow.
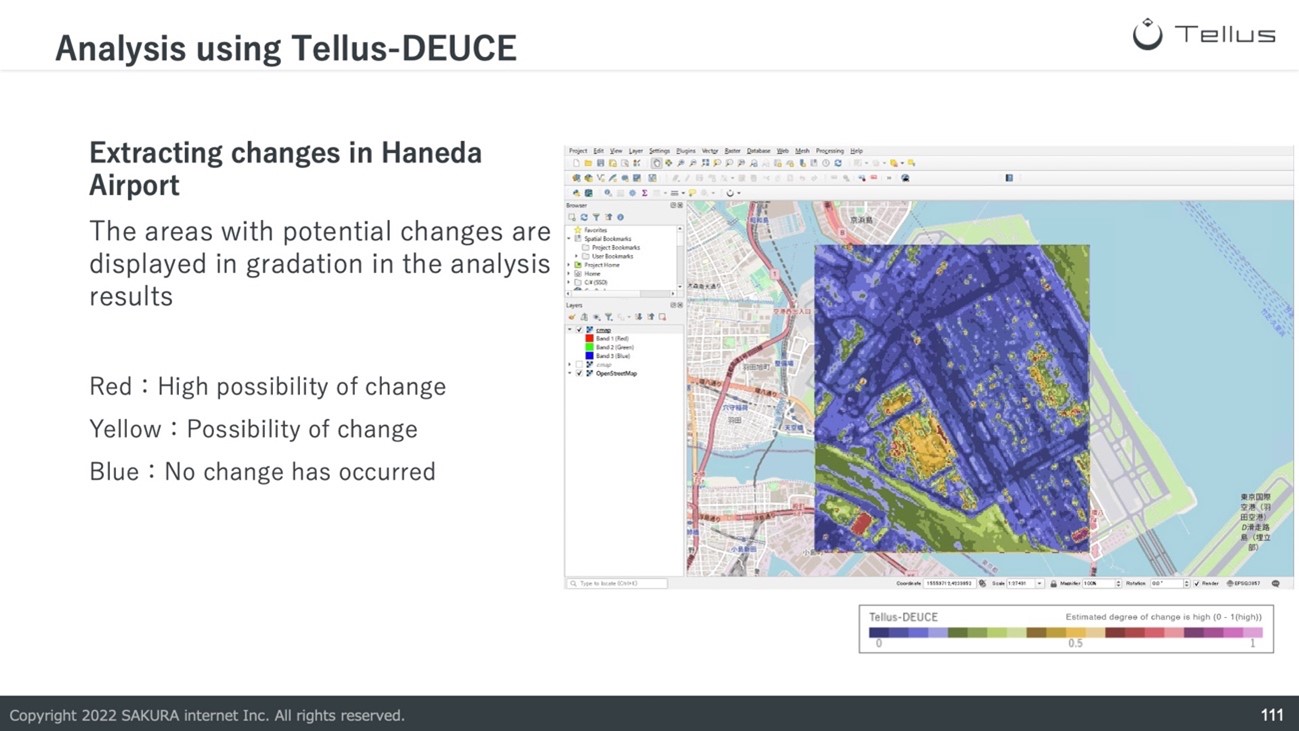
The operation results for Tellus-DEUCE are shown in gradations according to the probability that changes have occurred. The gradation is as below.
Red: High possibility of change
Yellow: Possibility of change
Blue: No change has occurred
As we may not know whether the changes are extracted suitably, let’s download the data used in this analysis from Traveler, display multiple map views, and confirm the results.
First, please download AVNIR-2 satellite data from two different periods with the following steps.
■Procedures
1. Click on the “Tellus icon” from the menu bar to launch the plugin.
2. In subject datasets, click on “clear” and put a checkmark into “【Tellus公式】AVNIR-2_1B1”
3. Put a checkmark into “Filter by Scene Name” and enter “ALAV2A028152870.”
4. A list of search results is shown by clicking on the “Search” button.
5. From the search result, select the satellite data with scene name “ALAV2A028152870,” and put a checkmark into “ALAV2A028152870_webcog.tif” in the pulldown list.
6. Click on “Download.”
7. After downloading the data, a dialog showing “Do you want to add the downloaded TIFF file to your map?” should be displayed. By clicking on “Yes,” the data is shown on the map.
※ Please repeat the above steps with the scene name “ALAV2A275692880” and filename “ALAV2A275692880_webcog.tif” to download and display the second satellite data.
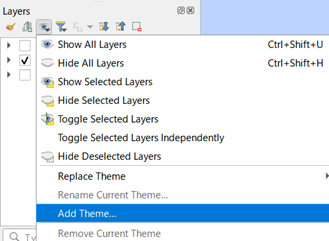
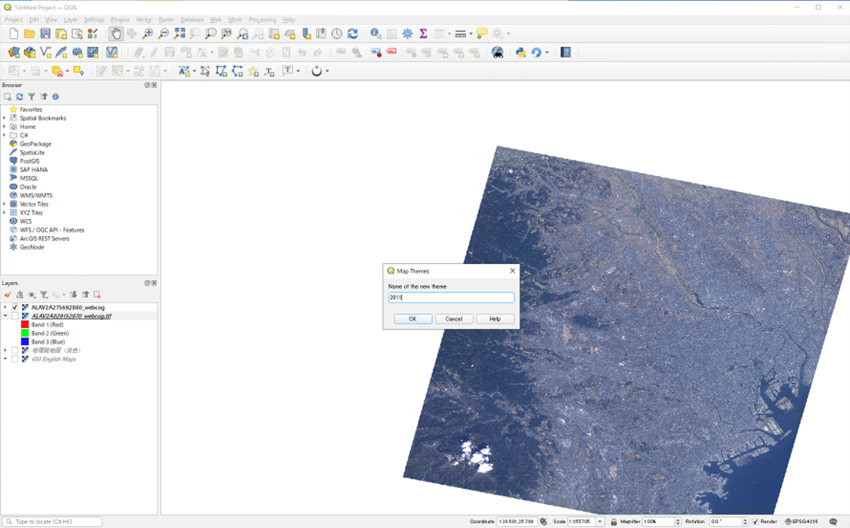
After completing the download of satellite data, we will add “themes.”
From “Manage Map Themes” in the layer panel, click “Add Theme” when only each satellite data is displayed.
To allow us to quickly identify the themes, change the name of “ALAV2A028152870_webcog.tif” to “2006” and that of “ALAV2A275692880_webcog.tif” to “2011.”
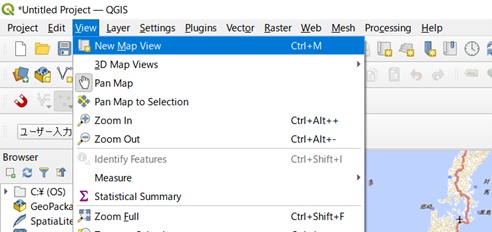
After that, we will add a “New Map View.”
From the menu bar, click on “View” and “New Map View.” By repeating this step twice, two new map views are added.
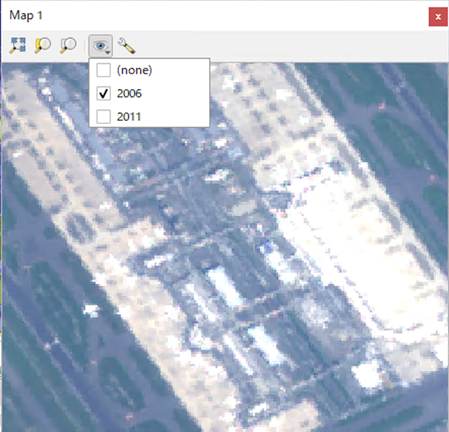
From the “Set View Theme” section at the top of each view, set “2006” as the view for “Theme 1” and set “2011” as the view for “Theme 2.” Through this step, views that we created previously will be added to the views.
After that, select “Synchronize View Center with Main Map” and “Synchronize Scale” to synchronize the scale and display area to the main map.
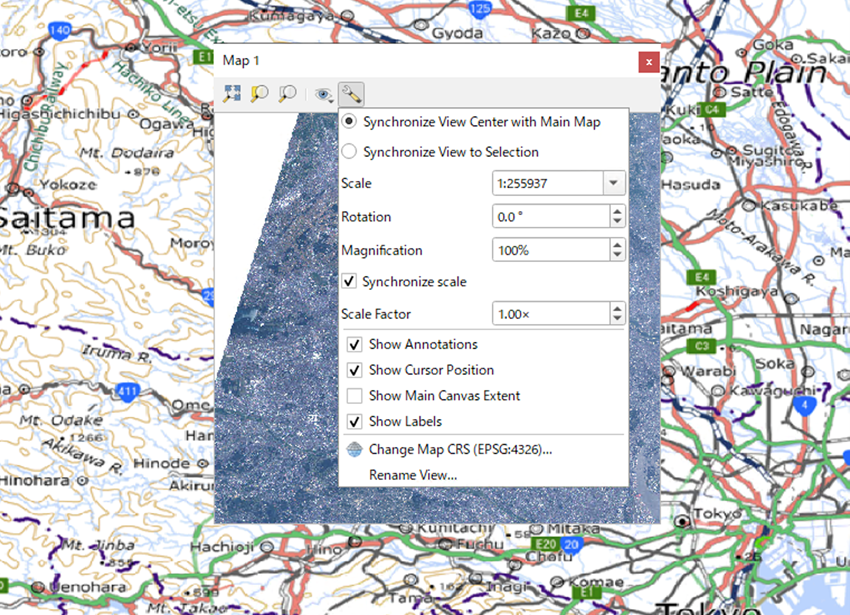
It is also possible to dock the views to the display by holding the left mouse button at the view’s title bar and then moving it to the bottom of the map. Let’s dock Map 1 (2006) to the left bottom corner and Map 2 (2011) to the right bottom corner.
Then, we will show the results of Tellus-DEUCE (Color map) on the main map. By doing so, the contents below should be displayed.
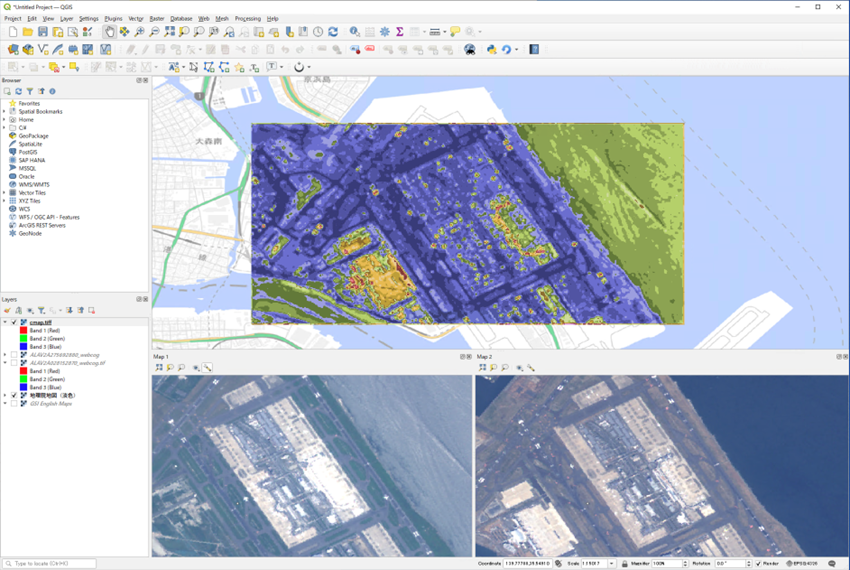
By comparing the map views, we can see that the empty plot of land in the bottom left map view (5th Aug. 2006) has changed to a terminal building and apron (location for aircraft to park for activities such as loading, unloading, and refueling) in the bottom right map view (29th Mar. 2011).
_By comparing the results to the map view above, we can also see that the locations are colored in yellow, meaning that the plugin was able to detect changes between periods correctly.
Through the above process, we used Tellus official tools to automatically detect potential sites for car parks around Hakata station with Tellus-VPL and automatically extract changes between satellite data from two different periods with Tellus-DEUCE.
Extracting target information automatically from satellite data improves the efficiency of tasks that can only be performed with human eyes or site investigation.
The tools introduced in this section can also be used in the free web-based version of Tellus. If interested in the tools, please create an account for Tellus at the following link and try out the tool.
(Click here to create an account for Tellus)
Summary
At last, we will look at the contents introduced in this seminar.
Summary of Tellus
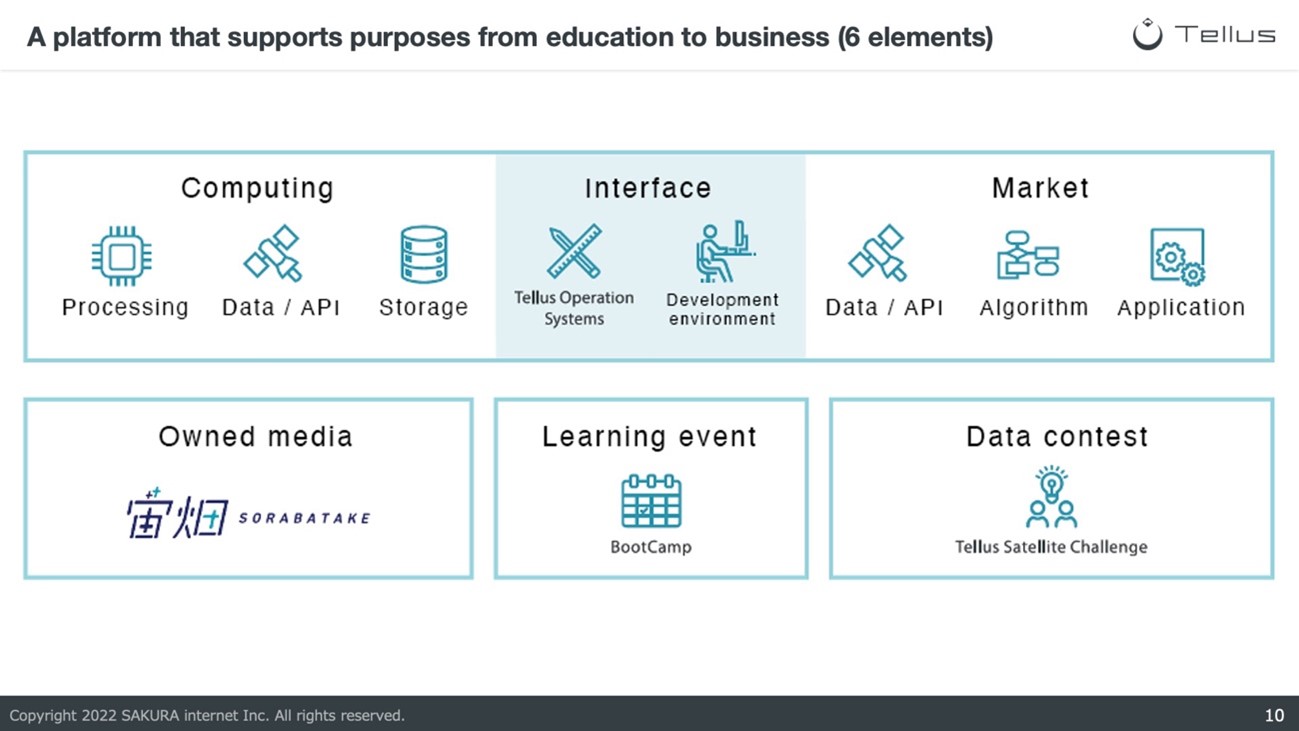
• Tellus is a satellite data platform aimed at creating business.
• Tellus aims to encourage the use of satellite data by allowing analysis of data on the cloud.Basic knowledge of satellite data
• The strengths of satellite data are broadness,” “strength against barriers by terrain,” “periodicity,” and “homogeneity.”
• The spatial resolution and swath of each satellite are different.
• Optical images can in intrinsically understood but are affected by weather.
• SAR images are unaffected by the weather but cannot be intrinsically understood.What is QGIS?
• QGIS is a tool for the analysis and processing of location information data
• Display vector data and raster data on QGIS
• Create new vector data (points)Analysis using Tellus official tools
• Automatic extraction of potential sites for car parks using TellusVPL
– Operational efficiency is improved by extracting the subject features with satellite data and AI image recognition technology.
– Analyze the results in QGIS and filtering the subject features.
• Extract changes in an urban area with Tellus-DEUCE.
– It can automatically extract changes in urban areas from satellite data from two different periods.
– Monitoring changes in streets and buildings and the effects of disasters.
Conclusion
Above is the report of the “QGIS Analyzation Hands-on Using Satellite Data from Tellus.” Most seminar participants did not have much experience using Tellus, QGIS or satellite data. Through this seminar, a large portion of the participants learned about the basics of satellite data and was able to imagine use cases of satellite data in their businesses.
Using “Tellus Satellite Data Master with QGIS,” we can analyze satellite data provided through Tellus on QGIS without preparing a high-speed internet connection or analyzation environment.
Please get in touch with us through the Tellus contact form if you want to use “Tellus Satellite Data Master with QGIS.”
As we will hold similar seminars in the future, please look forward to the next one.