【Hands-on guide to】what you can learn through combining different pieces of Tellus satellite data together
Satellites can observe objects using different frequency bands all at once. You can choose different combinations of frequency bands to emphasize specific features. In this article, we will tell you how to create altered images by changing the combination of frequency bands.
Satellites can simultaneously observe objects using different frequency bands. If you read Do you know this versatile feature? What you can see by combining different pieces of satellite data #Learn-Satellite-Data-with-Manga, you might feel like trying to do it yourself and seeing the result. If so, why not give it a try now? In this article, we will tell you how to combine frequency bands on Tellus OS and the development environment.
1. Sample data
Here, we use data from Landsat-8, which uses several frequency bands for observation.
2. How to combine different frequency bands on Tellus OS
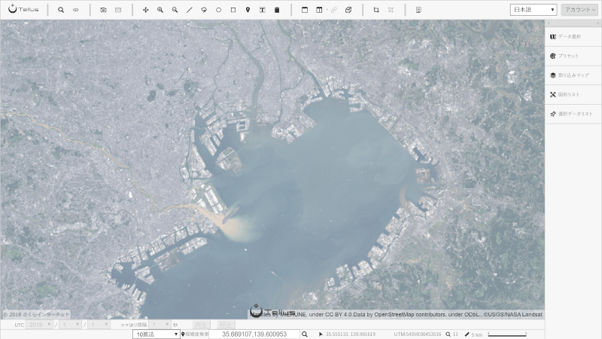
First, choose an image for your target area.
Click “Selected data” on the right side of the screen to see information about the chosen image. Band4, Band3 and Band2 are assigned to R, G and B, respectively by default.
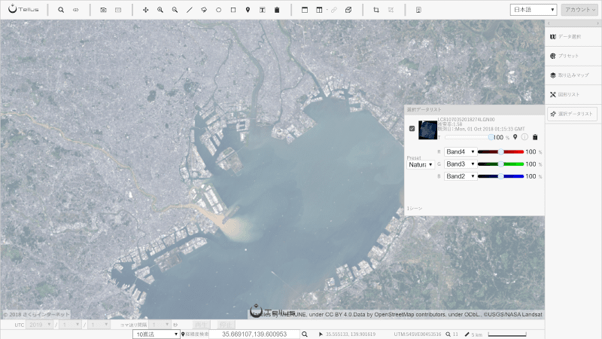
For instance, you can change the band for R to change to another combination.
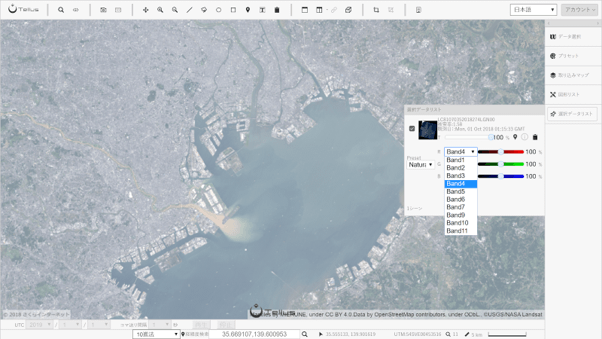
You might, however, have no idea which band to assign? In that case, you can click “Presets” to show preset Tellus combinations.
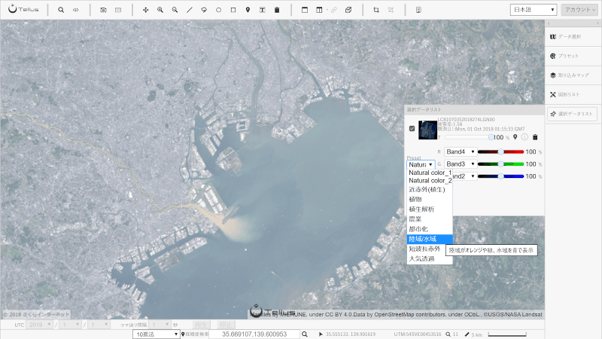
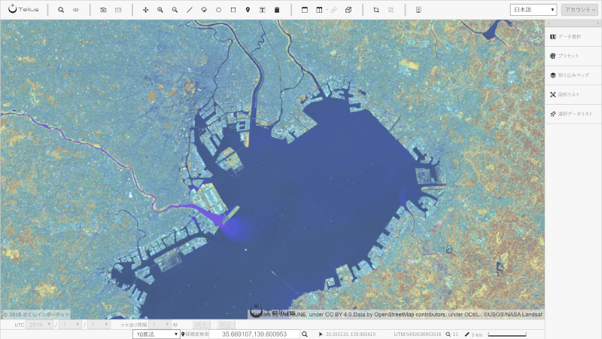
For example, if you choose “Land/Water”, water and soil are emphasized. Check for yourself as to what other combinations look like.
3. How to combine different frequency bands on the development environment
You can combine frequency bands basically in the same way as with Tellus OS. Bands can be assigned to R, G and B in any combination to create images suitable for your purpose. The program below is to get a satellite image (a tile) with a specified combination of frequency bands. See [How to Use Tellus from Scratch] How do you get an image larger than a map tile? Four tips on handling map tiles for how to get a map tile.
The program above displays a usual True Color image.
import requests
import json
import math
from skimage import io
from io import BytesIO
%matplotlib inline
TOKEN = '自身のトークンを貼り付けてください'
def search_landsat8_scenes(min_lon, min_lat, max_lon, max_lat):
url = 'https://gisapi.tellusxdp.com/api/v1/landsat8/scene'
headers = {
'Authorization': 'Bearer ' + TOKEN
}
payload = {'min_lat': min_lat, 'min_lon': min_lon,
'max_lat': max_lat, 'max_lon': max_lon}
r = requests.get(url, params=payload, headers=headers)
if not r.status_code == requests.codes.ok:
r.raise_for_status()
return r.json()
def get_Landsat8_blend_tile(z, x, y, option, params={'opacity':1, 'r':4, 'g':3, 'b':2,
'rdepth':1, 'gdepth':1, 'bdepth':1, 'preset':None}):
"""
Landsat-8のブレンドタイル画像を取得する
Parameters
----------
z : int
タイルのズーム率
x : int
タイルのX座標
y : int
タイルのY座標
option : dict
APIパスのオプション(path, row, productId)
params : dict
クエリパラメータ
Returns
-------
img: ndarray
タイル画像
"""
url = 'https://gisapi.tellusxdp.com/blend/landsat8/{}/{}/{}/{}/{}/{}.png'.format(
option['path'], option['row'], option['productId'], z, x, y)
headers = {
'Authorization': 'Bearer ' + TOKEN
}
r = requests.get(url, params=params, headers=headers)
if not r.status_code == requests.codes.ok:
r.raise_for_status()
return io.imread(BytesIO(r.content))
import numpy as np
def get_combined_image(get_image_func, z, topleft_x, topleft_y,
size_x=1, size_y=1, option={}, params={}):
"""
結合されたタイル画像を取得する
Parameters
----------
get_image_func : function
タイル画像取得メソッド
引数はz, x, y, option, params
z : int
タイルのズーム率
topleft_x : int
左上のタイルのX座標
topleft_y : int
左上のタイルのY座標
size_x : int
タイルを経度方向につなぎわせる枚数
size_y : int
タイルを緯度方向につなぎわせる枚数
option : dict
APIパスのオプション(z,x,y除く)
params : dict
クエリパラメータ
Returns
-------
combined_image: ndarray
結合されたタイル画像
"""
rows = []
blank = np.zeros((256, 256, 4), dtype=np.uint8)
for y in range(size_y):
row = []
for x in range(size_x):
try:
img = get_image_func(z, topleft_x + x, topleft_y + y, option, params)
except Exception as e:
img = blank
row.append(img)
rows.append(np.hstack(row))
return np.vstack(rows)
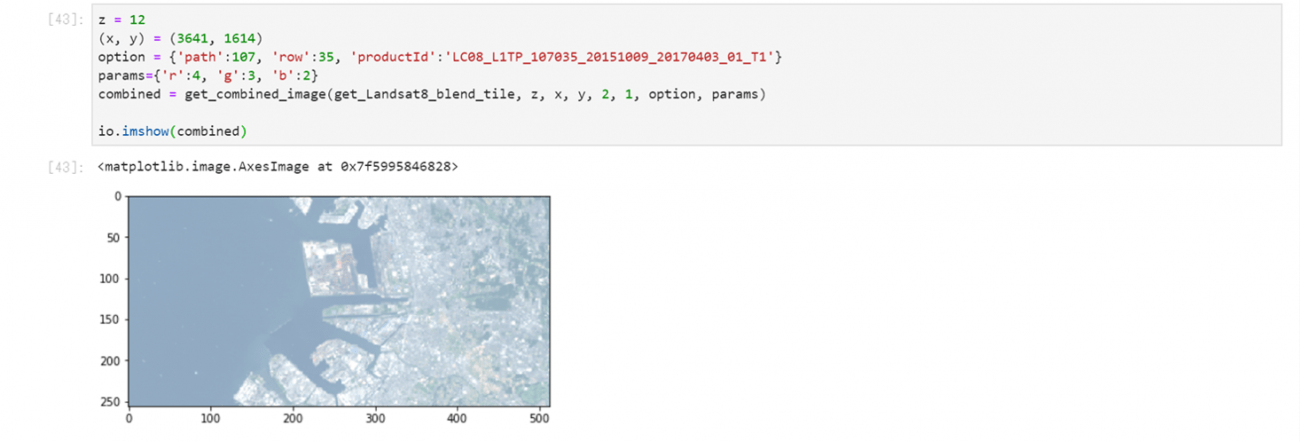
z = 12
(x, y) = (3641, 1614)
option = {'path':107, 'row':35, 'productId':'LC08_L1TP_107035_20151009_20170403_01_T1'}
params={'r':4, 'g':3, 'b':2}
combined = get_combined_image(get_Landsat8_blend_tile, z, x, y, 2, 1, option, params)
io.imshow(combined)The program above displays a usual True Color image.
You can change each of the parameters below to get an image with another frequency band combination.
params= {‘r’:7, ‘g’:6, ‘b’:5}
Let’s assign other bands (numbers) to these r, g and b.
For example, the following frequency band combination emphasizes heat sources. Red conspicuous spots are likely to be heat sources.
z = 12
(x, y) = (3641, 1614)
option = {'path':107, 'row':35, 'productId':'LC08_L1TP_107035_20151009_20170403_01_T1'}
params={'r':7, 'g':6, 'b':5}
combined = get_combined_image(get_Landsat8_blend_tile, z, x, y, 2, 1, option, params)

io.imshow(combined)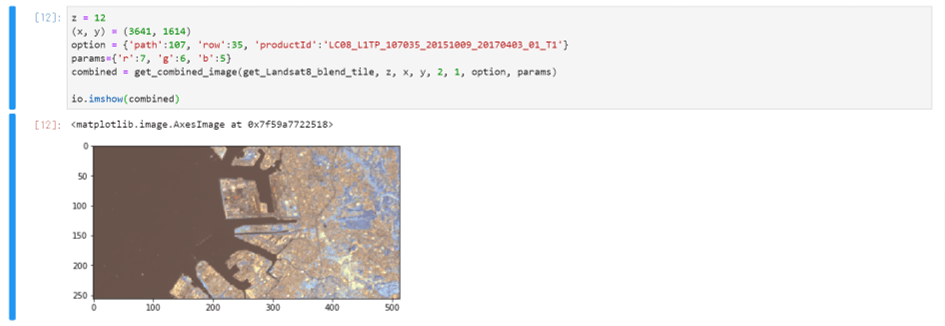
You can make vegetation stand out as well by assigning the frequency bands as follows.
z = 12
(x, y) = (3641, 1614)
option = {'path':107, 'row':35, 'productId':'LC08_L1TP_107035_20151009_20170403_01_T1'}
params={'r':5, 'g':4, 'b':3}
combined = get_combined_image(get_Landsat8_blend_tile, z, x, y, 2, 1, option, params)

io.imshow(combined)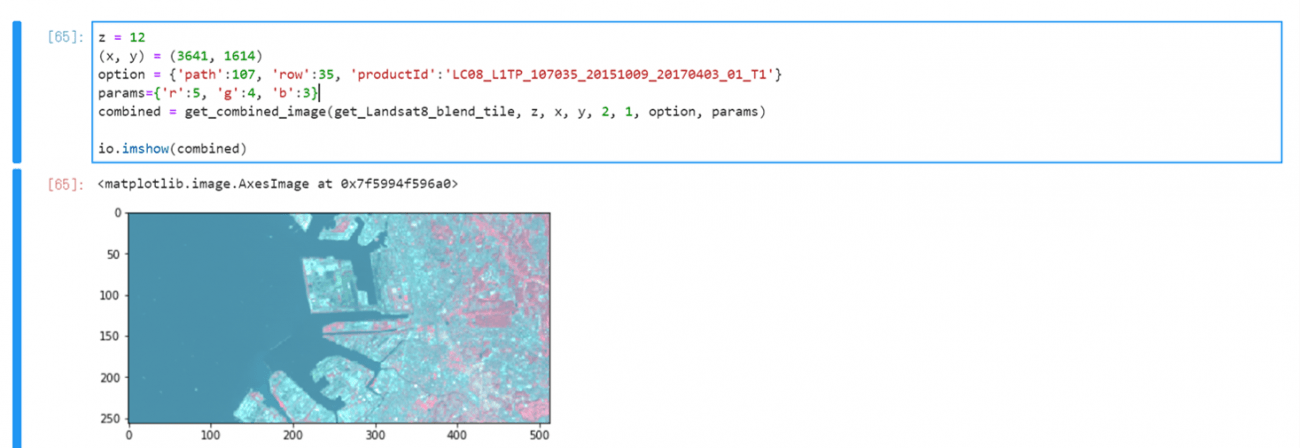
If you need to highlight water and soil, try the following combination.
z = 12
(x, y) = (3641, 1614)
option = {'path':107, 'row':35, 'productId':'LC08_L1TP_107035_20151009_20170403_01_T1'}
params={'r':5, 'g':6, 'b':4}
combined = get_combined_image(get_Landsat8_blend_tile, z, x, y, 2, 1, option, params)

io.imshow(combined)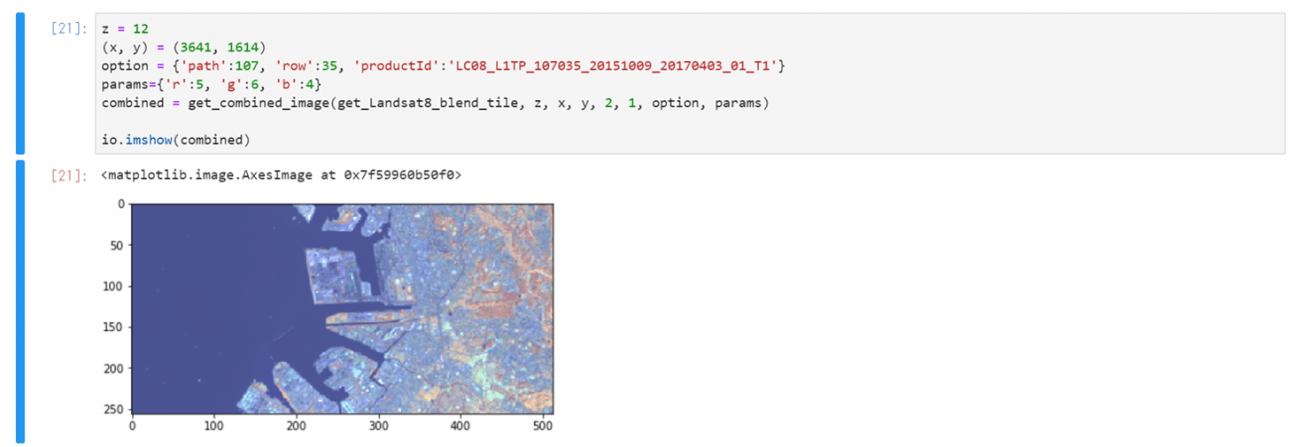
4. Summary
Even images of the same place can be viewed completely differently with various combinations of frequency bands. You should look at things from different angles if you want to really understand them. Satellite data serves very well for this purpose because it can focus precisely on a variety of aspects.
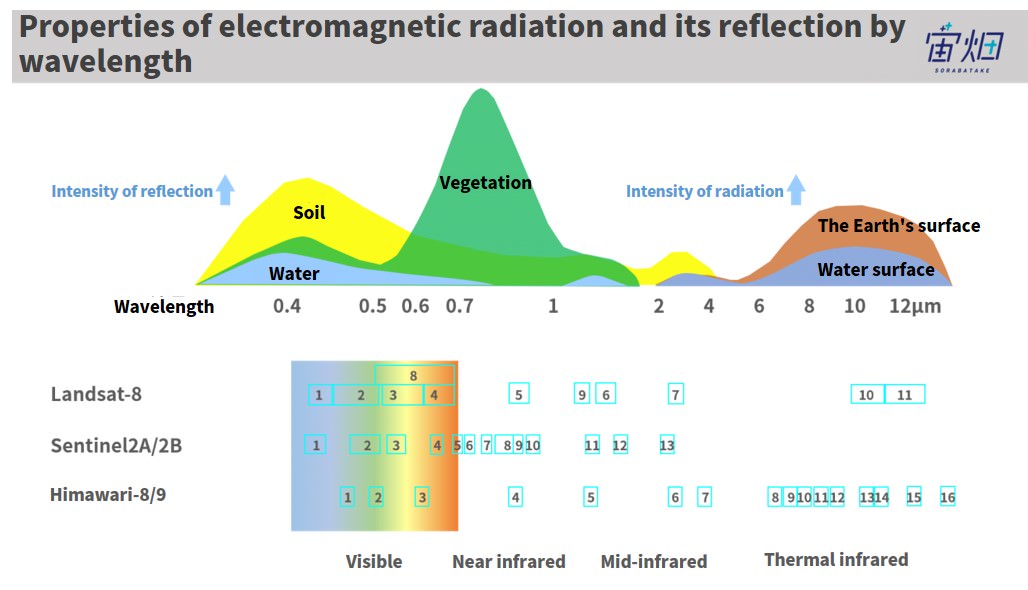
The presets on Tellus are only a fraction of the numerous combinations of frequency bands possible. The important thing is to understand the properties of each wavelength (i.e. what objects effectively reflect which wavelengths) and then try their combinations. However, it is quite hard to find the appropriate combination on the first attempt. It might be a good idea to look for suitable combinations of frequency bands by trying many to see what types of objects they emphasize. That is, you can find the proper combination for your analysis by looking at satellite data with different band combinations. Doesn’t sound so hard, does it?
Register for the satellite data platform “Tellus” here. *See API Available in the Developing Environment of Tellus for how to use Jupyter Notebook on Tellus.