The basics of satellite data — What it tells us, types, observation interval, resolution and use cases
What can we actually gain to know from satellite data? How do we gain this knowledge? How frequently? How is satellite data used in the actual real world? We are going to answer all these questions.
“Satellite data” — data obtained from satellites — attracts attention now.
For example, the first Japanese satellite data platform “Tellus“, which SAKURA Internet has developed, on request by the Ministry of Economy, Trade and Industry (METI), announced that it would create an alliance with 21 firms and organizations, including entities that lead the “non-space” industry, such as Mercari and ABEJA.
Many people say, “Satellite data is interesting!” but the chances are there are not many people who know about types, observation interval and resolution of satellites, or how to get their data.
We are going to tell you the basics of satellite data in this article.
The content is a bit difficult and bulky, but it’ll give you the knowledge necessary to understand satellite data!
(1) Types of satellite data (types of sensors, frequency of observation)
There are many types of satellite data out there. Data obtained from satellites includes not only optical photographs like aerial photos you see on “Google Maps”, but density of vegetation, the Earth’s surface temperature, etc.
In this chapter, we’ll show you what observation data you can get from satellites, categorizing the data by methodological properties such as type of sensor and frequency of observation.
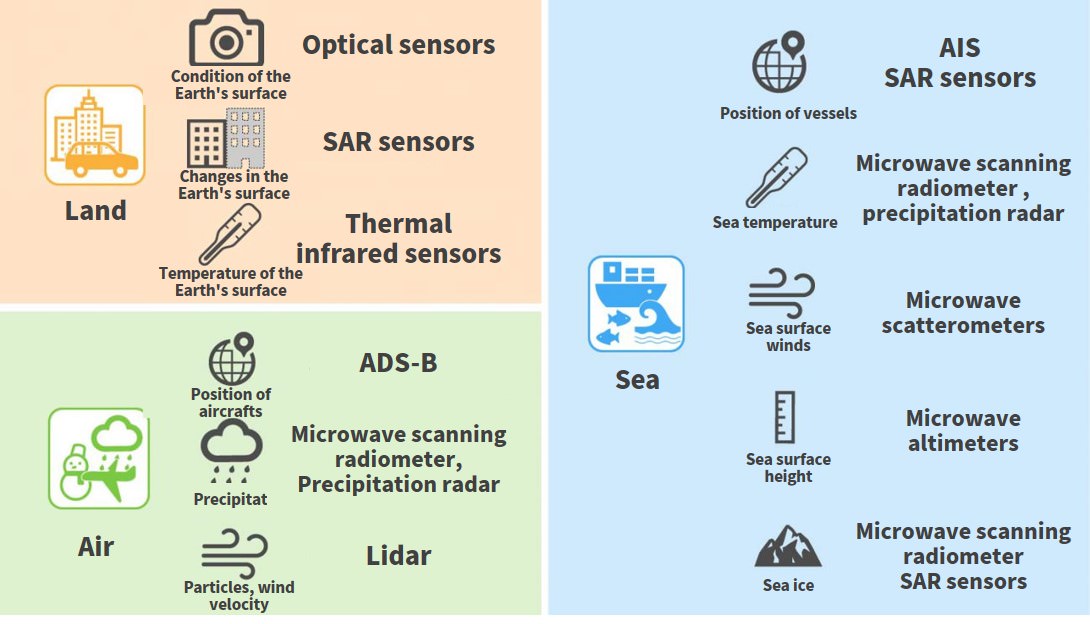
We will explain what satellite data tells us by categorizing it into three groups of “land”, “sea” and “air”. Examples of data you can get in each category, and sensors needed to get it are outlined in the figure above.
We use the word “examples” here because they are not the complete set of “what satellite data tells us”. Actually, we need further discussion about “what satellite data can tell us and how we can use it”. This is one of the reasons why satellite data business is exciting.
So we suggest you learn “what you can see” using several types of sensors to collect satellite data; “how they work”; and their “advantages and disadvantages”.
You might find it slightly difficult, but once you become just a bit familiar with satellite sensors, you should be able to enjoy thinking,”Oh, I can probably find that out, too!”
Observe every corner of the globe with a digital camera! Optical sensors
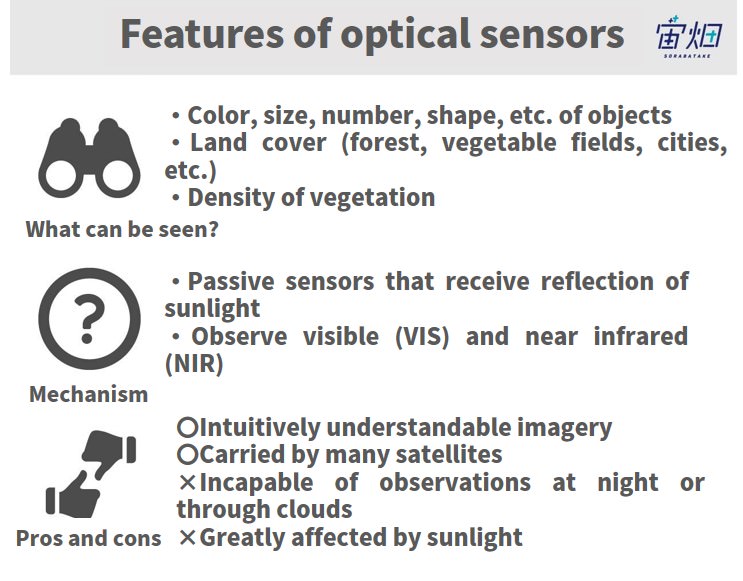
Optical are the most common satellites sensors.
Technically, optical sensors gather “visible (light)” — light within the wavelength range human eyes can perceive — and light in the nearby infrared range called “near infrared” as well.
Optical sensors are something like common cameras we use on Earth.
This type of sensor can see “colors” of objects, which are determined by sunlight reflected by the objects. Because optical sensors see reflected light, they can observe nothing on a pitch dark night or in areas under clouds.
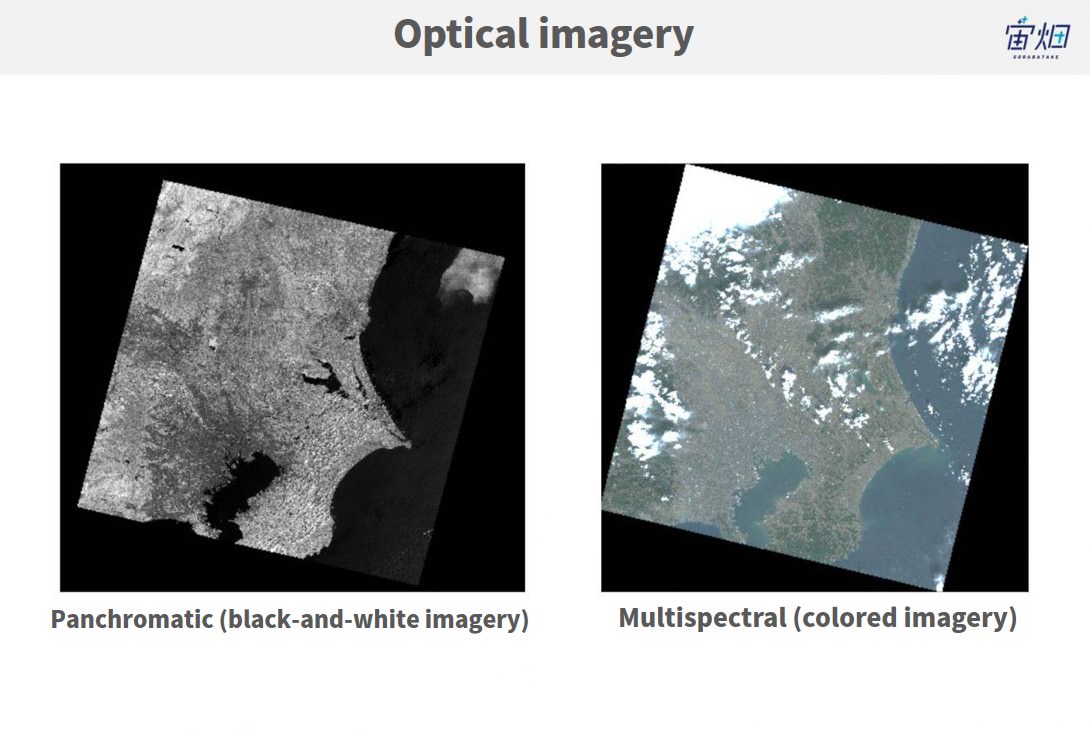
Black-and-white imagery is called “panchromatic” (abbreviated to PAN, panchro, etc.) and colored imagery “multispectral” (abbreviated to MS or multi).
Multispectral imagery is synthesized by stacking images captured by different wavelength bands corresponding, for example, red, green and blue colors (RGB).
When a sensor supports both panchromatic and multispectral imagery, panchromatic usually has a higher resolution.
Sharpened imagery synthesized by superimposing a panchromatic image on a multispectral is called “pan-sharpened imagery”.
Visible is abbreviated to VIS. Because reflected infrared light has wavelengths near those of visible, it is called near-infrared (NIR).
Visible and near-infrared light are collectively called VNIR for some sensors. Some satellites carry a sensor for the wavelength range called shortwave-infrared (SWIR), which is a little longer than NIR.
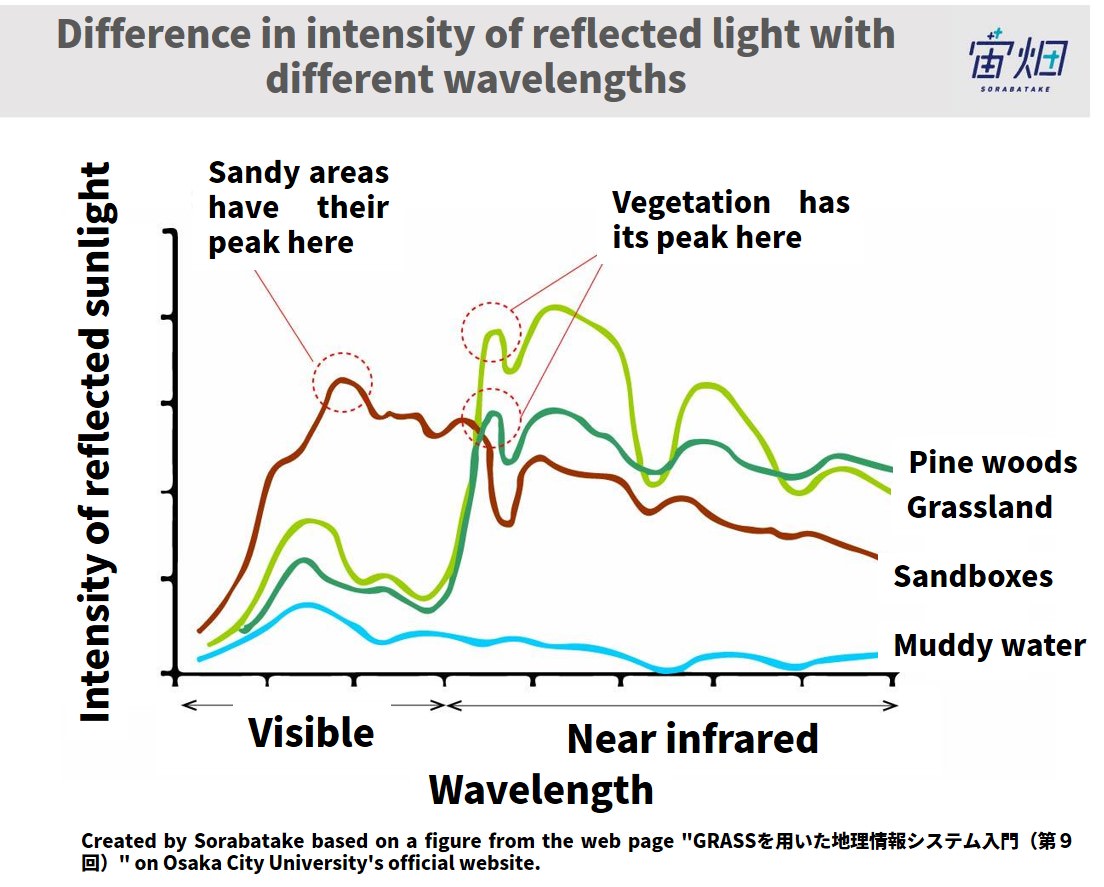
Using VNIR light, you can not only examine the condition of Earth’s surface but can distinguish the materials that make up the surface by analyzing the properties of reflected light because different objects reflect sunlight components with different wavelengths at different intensities (this is why different objects have different colors).
For example, as shown in the figure above, plants, water and sand reflect light with different wavelengths at different intensities, so you can distinguish these materials. Moreover, as each type of plant has a slightly different form of wave, you can identify types of plants by carefully examining the intensities of reflected light.
It is said that NIR in particular indicates density of vegetation, so that is why it is used for agriculture.
【Satellites with VNIR sensors】
Landsat-8 (OLI), Sentinel-2 (MSI), ALOS (AVNIR-2), GCOM-C (SGLI), etc.
■ Articles in Sorabatake about analyses using optical sensors
Satellite-Data
Sorabatake editorial department
You can see cherry blossoms from a satellite! How to find cherry blossoms using satellite imagery
Satellite-Data
Sorabatake editorial department
Identify the materials of tennis courts used in Grand Slams only using satellite data!
Observe through clouds or at night! Synthetic Aperture Radar (SAR)
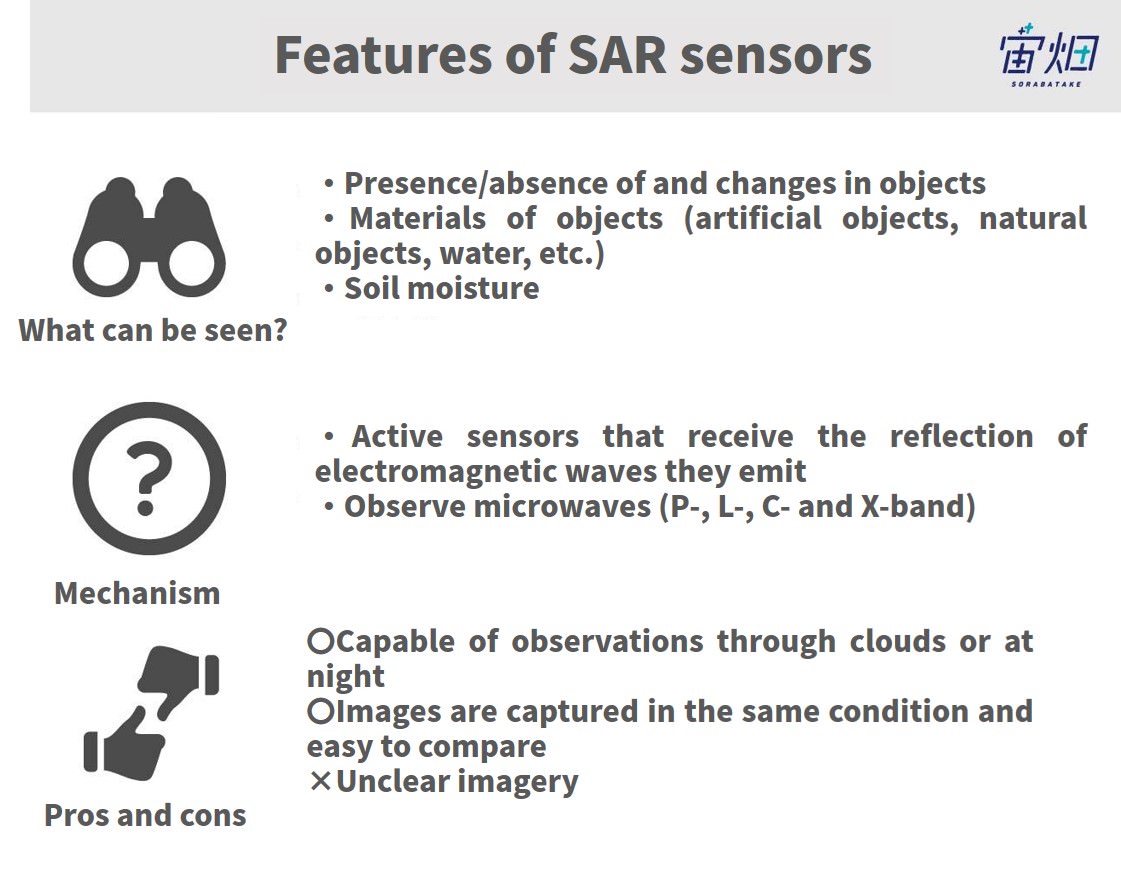
Synthetic Aperture Radar (SAR) emits microwaves from its sensor and receives with the sensor the microwaves reflected back off the Earth’s surface.
Rough surfaces look white as they reflect back more radio waves to the satellite, and smooth surfaces look black as they reflect radio waves in directions away from the satellites.
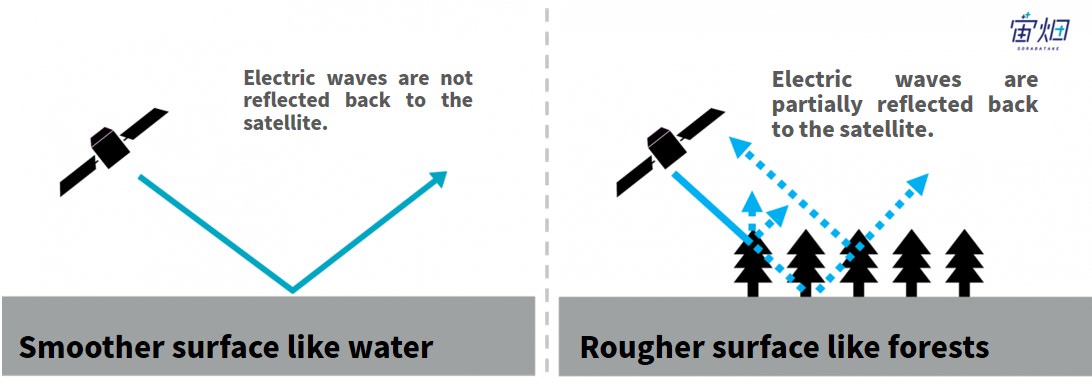
SAR sensors don’t produce as smooth imagery as visible sensors, but they make rough imagery like that you see in a pregnancy ultrasound test.
Because SAR sensors observe the reflection of radio waves they emit themselves, they always capture images under the same condition. For this reason, SAR sensors are more suitable to detect changes in images of the same area captured at different times, compared to optical sensors, which are affected by sunlight conditions.
Radio waves penetrate clouds, so SAR sensors can observe the Earth’s surface under cloud. Moreover, since they emit microwaves themselves, they can observe the Earth’s surface day and night.
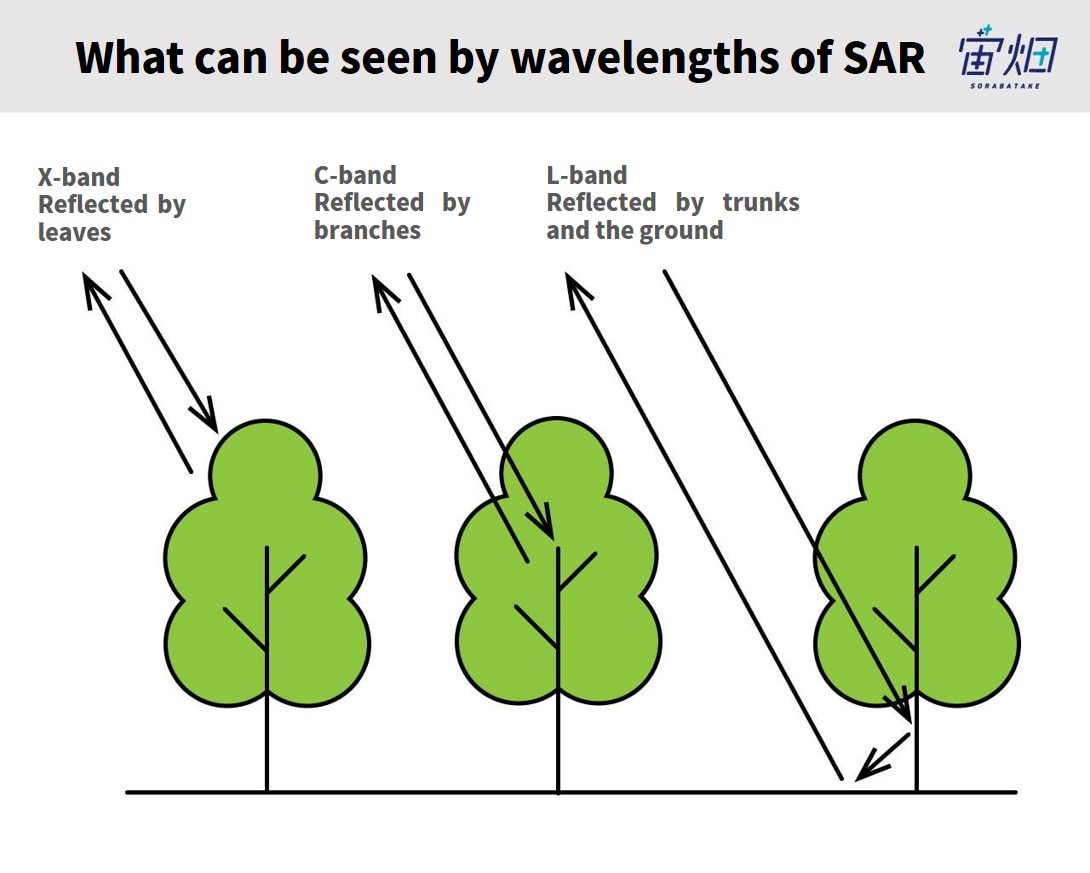
There are SAR sensors that deal with different frequencies just as optical sensors. L-band (1 – 2 GHz), C-band (4 – 8 GHz) and X-band (8 – 12 GHz) are the common wavelength bands, with the first having the longest wavelength and the last the shortest. Light with different frequencies is reflected by different materials.
L-band microwaves, which have the longest wavelength, penetrate foliage and branches of trees and grass, so we can see the condition of the ground. L-band is suitable to observe, for instance, extensive crustal movements. C-band microwave is reflected by branches. X-band microwaves, which has the shortest wavelength, is reflected by foliage and grass. X-band is more suitable to see smaller features than L- and C-band.
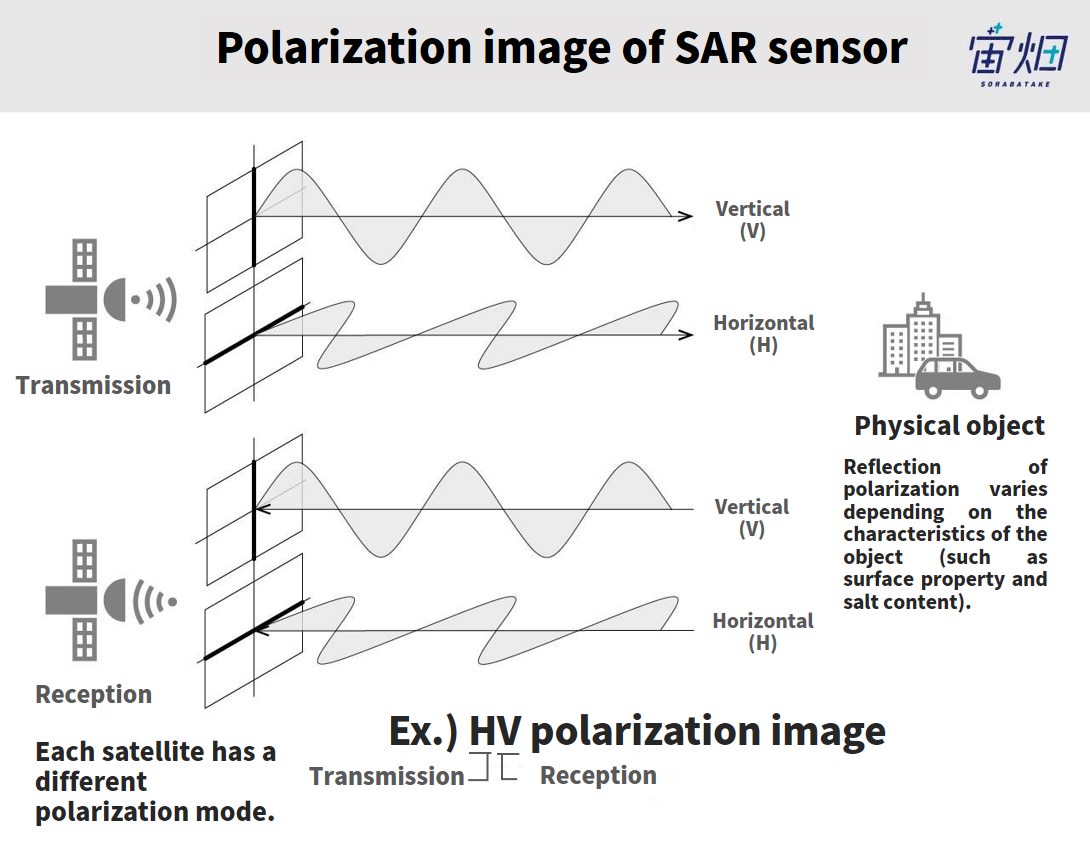
Furthermore, SAR satellites have a feature called polarized waves. Microwaves emitted by SAR sensors can be broken down into horizontal and vertical components of polarization, which have different directions of oscillation, as shown in the figure above.
SAR satellites can emit horizontally (H) or vertically (V) polarized waves and receive the reflected waves horizontally (H) or vertically (V).
The combination of horizontal emission and horizontal reception is called HH, horizontal emission and vertical reception HV, vertical emission and vertical reception VV, and vertical emission and horizontal reception VH. Some larger satellites can receive microwaves both horizontally and vertically at the same time. This feature is called, for instance, HH-HV.
Polarized waves are used to distinguish objects. Incident radio waves are reflected differently by objects with different properties (surface properties, salinity, etc.). This difference in intensity of reflection is visualized in resulting imagery.
For example, rice paddies, plastic greenhouses and lotus fields have different polarization properties, so they look different in satellite imagery. You can also analyze the difference in salinity among sea to date each pieces.
【Satellites with SAR sensors】
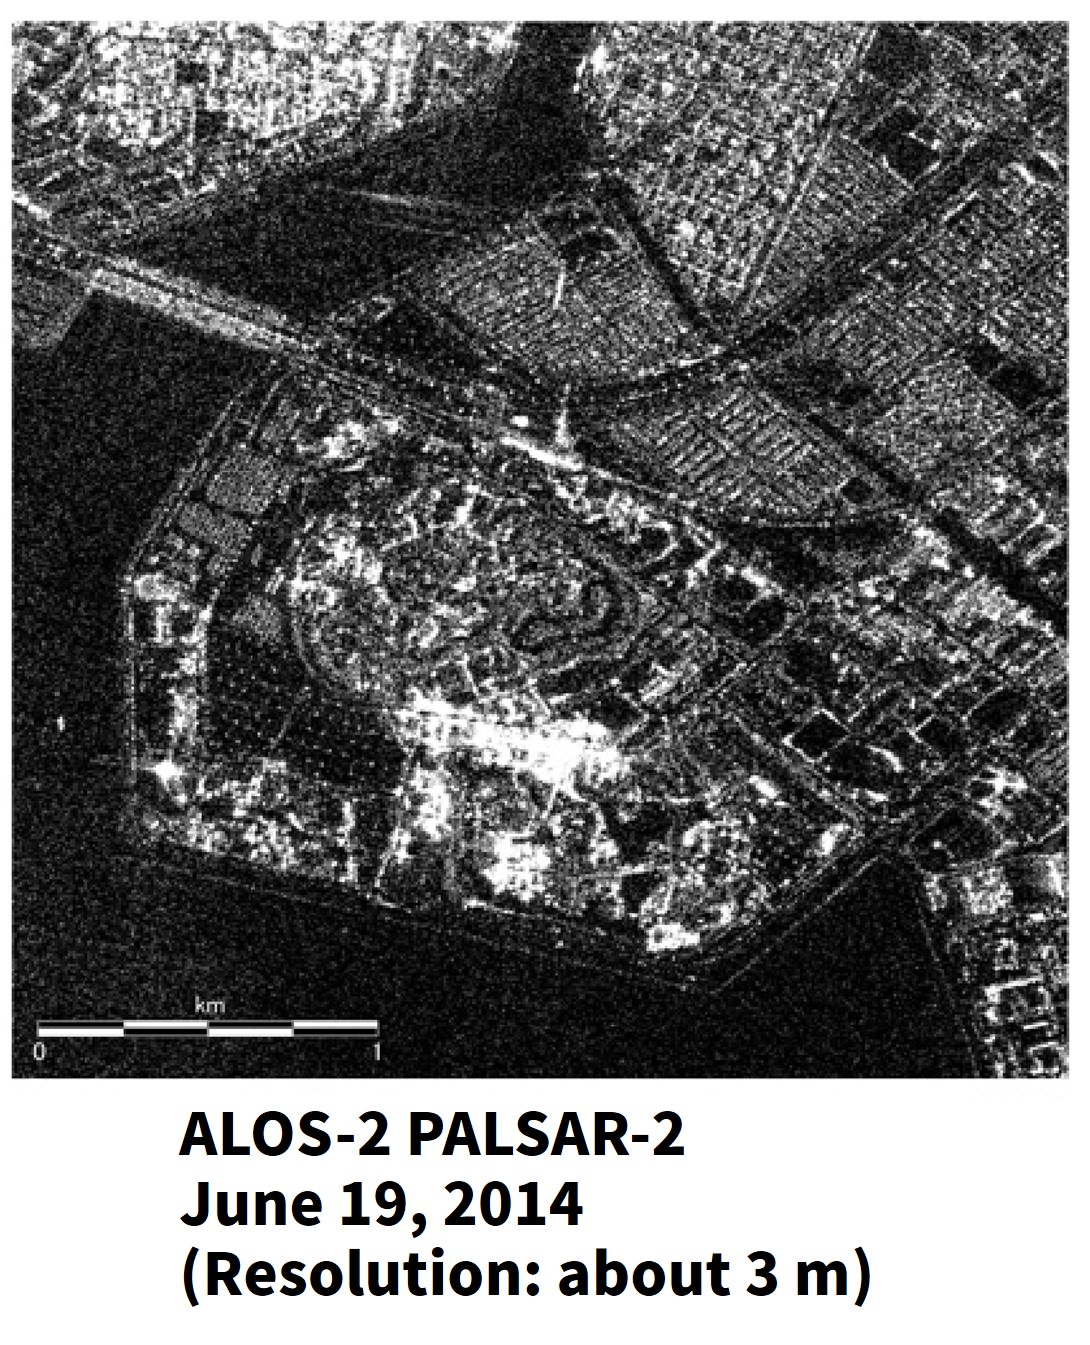
ALOS-2 (PALSAR-2; L-band), Sentinel-1 (C-SAR; C-band), ASNARO-2 (X-band)
Special
Sorabatake editorial department
The Basics of Synthetic Aperture Radar (SAR): Use cases, Uses, Sensor, Satellite, and Wavelength
Spacecraft
Sorabatake editorial department
What is an SAR satellite? ASNARO-2 expands the potential of the space industry
Spacecraft
Sorabatake editorial department
Small radar satellites attract the world’s attention! — The potential of Japan
Get the temperature of the Earth's surface and the sea surface! Thermal infrared sensors
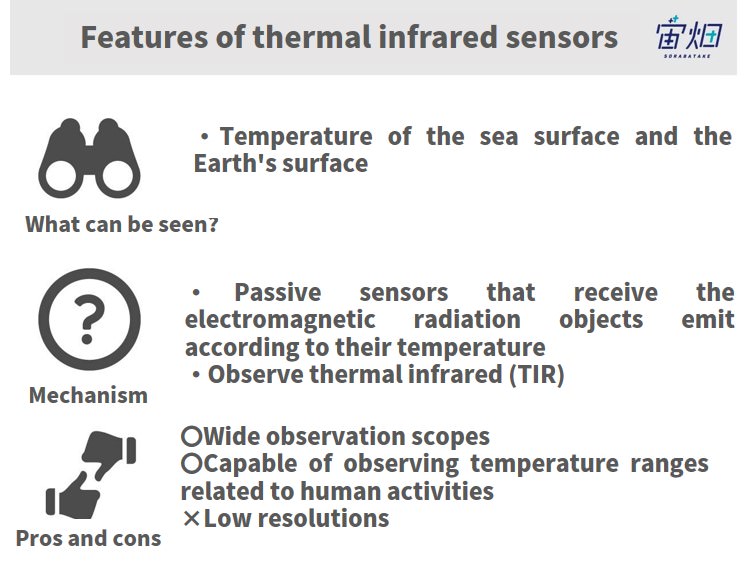
Thermal infrared sensors see light with wavelengths longer than visible light.
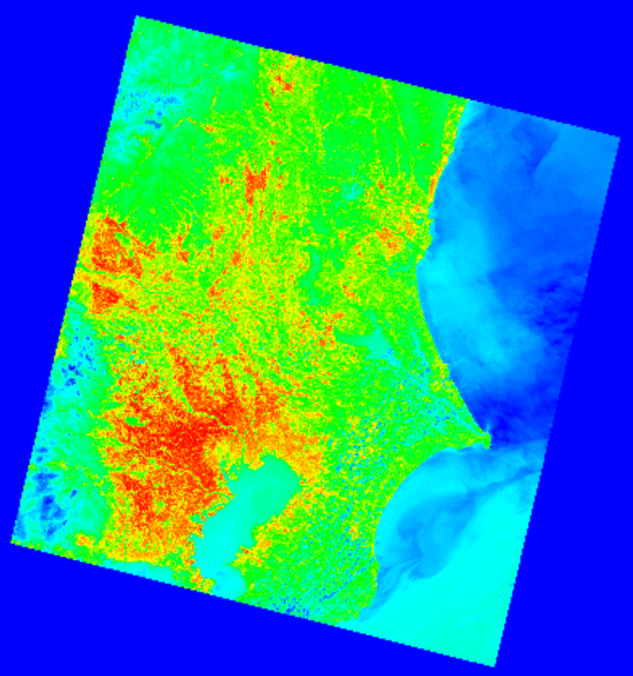
As the name suggests, they observe the temperature of the Earth’s surface. While visible and reflected infrared sensors see reflection of sunlight, thermal infrared sensors see the electromagnetic waves emitted by objects themselves, so they can capture images even at night. The thermography used for screening for infectious diseases at airports is implemented by thermal infrared sensors.
Thermal infrared is often abbreviated to TIR.
Thermal infrared sensors have lower resolutions than optical ones due to infrared’s frequency. The American satellite Landsat-8 has a resolution of 15 m for panchromatic imagery, 30 m for multispectral and 100 m for thermal infrared. The resolution of the geostationary satellite Himawari is 2 km.
【Satellites with TIR sensors】
Landsat-8 (TIRS), Himawari (AHI), GCOM-C (SGLI), etc.
■ Articles in Sorabatake about analyses using thermal infrared sensors
Satellite-Data
Sorabatake editorial department
Is the venue for Tokyo Olympic marathon really so hot? Compare the present temperature to temperatures in the past.
Analyze the conditions of the atmosphere! Lidar
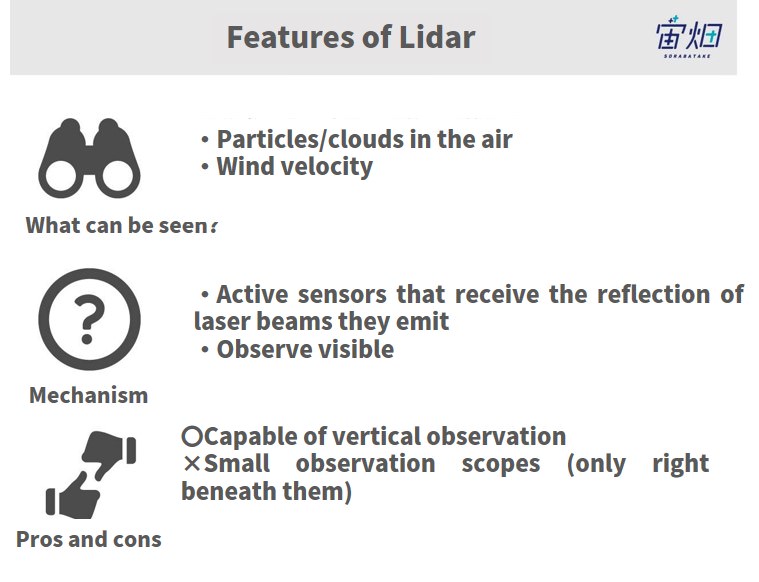
Lidar adopts a similar mechanism as SAR sensors but using visible light (laser beams), not microwaves. It measures the density of particles in the atmosphere from the reflection of laser beams. By measuring the Doppler effect using lidar, you can know movements of particles in the atmosphere, that is, wind velocity.
While optical sensors can only get two-dimensional information, lidar sensors can obtain vertical information as well, which can be used, for instance, to understand the structure of the atmosphere. However, because lidar uses laser beams, it can only target a small area at a time.
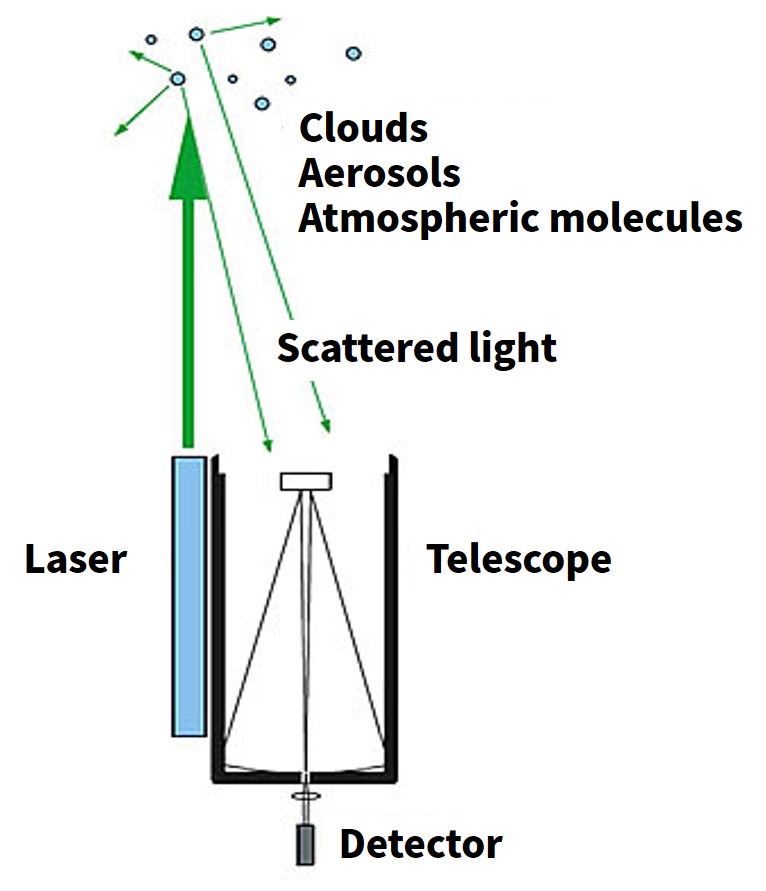
Credit : National Institute for Environmental Studies
【Satellites with lidar sensors】
EarchCARE (ATLID), ADM-Aeolus (ALADIN), etc.
Good at observing watery objects!Microwave Scanning Radiometer
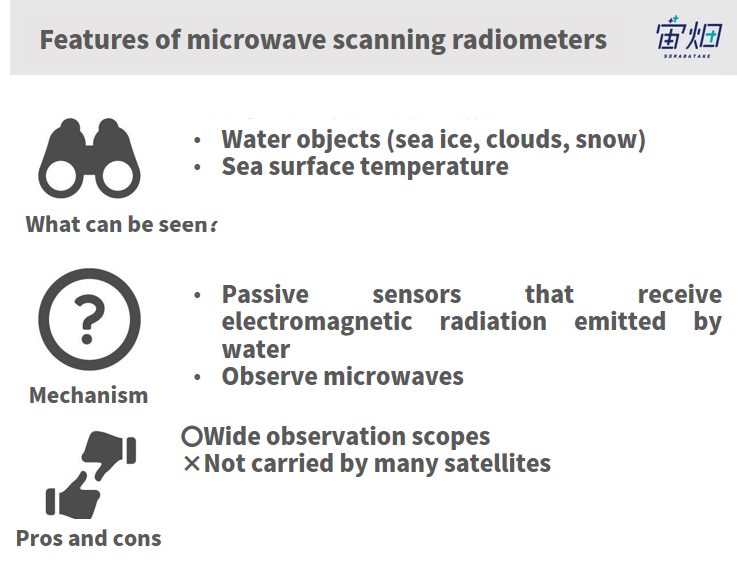
Microwave scanning radiometers (MSRs) passively observe microwaves. MSRs can observe temperature distribution, absorption properties of gases in the atmosphere, absorption and scattering properties of water and ice particles, etc.
They have large observation scopes thanks to the properties of microwaves, though there are not many satellites carrying an MSR. Unlike optical and SAR sensors, data doesn’t come in the form of imagery, so a high degree of expertise is needed to analyze it.
【Satellites with MSR sensors】
GCOM-W (AMSR2), GPM (GMI), etc.
■ Articles in Sorabatake about analyses using MSR data
Satellite-Data
Sorabatake editorial department
Want to see floating ice in Hokkaido! How to locate floating ice using satellite data
Satellite-Data
Sorabatake editorial department
The Northern Sea Route attracts attention amid global warming! Check out its pros, cons and potential using satellite data
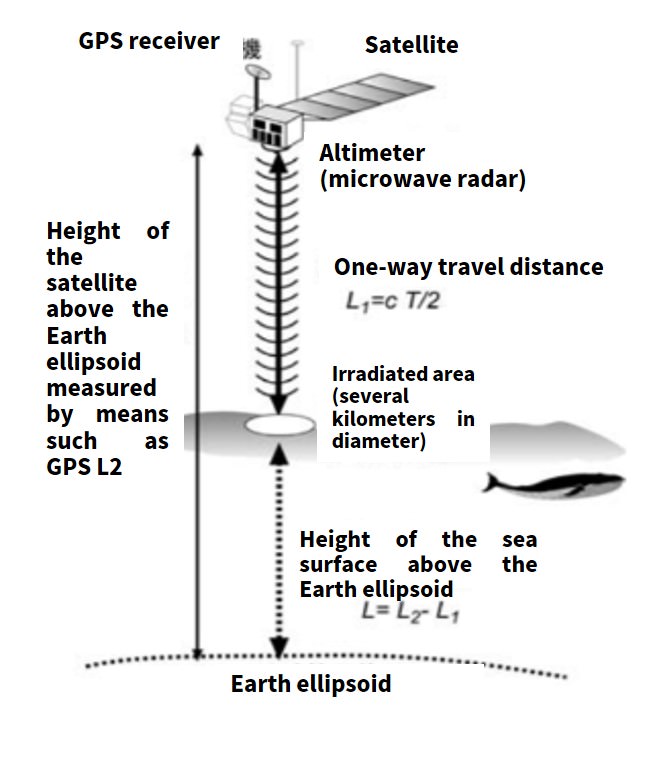
Measure the precise height of the sea surface! Microwave altimeters
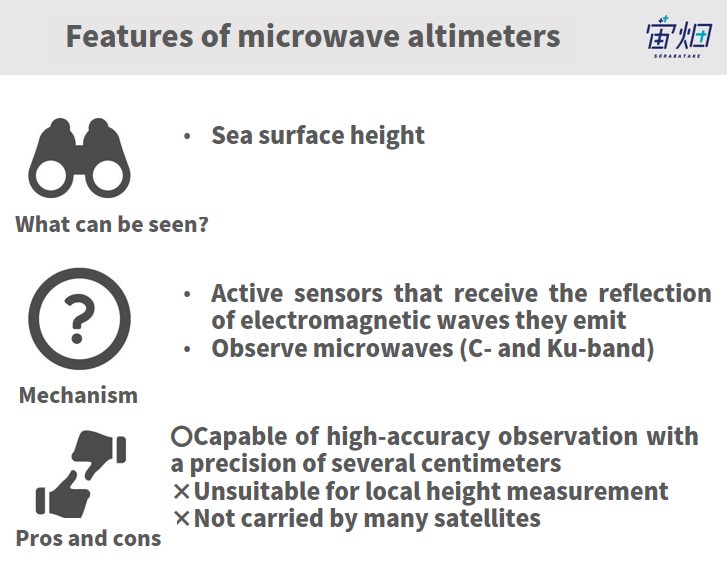
Microwave altimeters calculate the height of areas from the time interval between the emission of microwave pulses and the reception of their reflection.
Although the vertical accuracy is very high, height is calculated as the mean height of the whole area onto which microwaves are emitted (several km in diameter), so they are used to measure the height of the sea surface. Microwave altimeters are more suitable to measure the height of macro features like tides than micro features like waves.
Reference: アルチメーター(高度計)- 人工衛星で海面の起伏をはかる
Observe sea surface winds! Microwave scatterometers
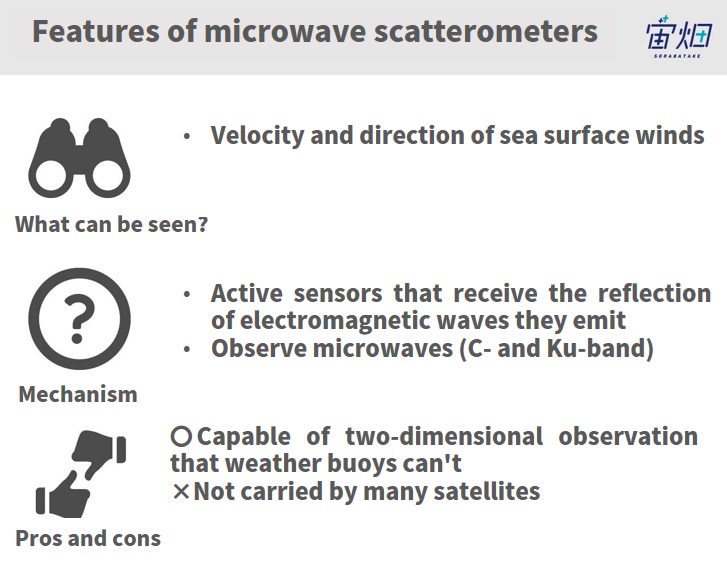
When microwaves are emitted on to the sea surface, components of surface waves with similar wavelengths are scattered and this is perceived as a signal by the radar. Intensity of these signals are affected by directions and strengths of surface winds.
It means microwave scatterometers can observe sea surface winds.
【Satellites with microwave scatterometers】
SEASAT (a radar scatterometer), Midori 2 (SeaWinds), MetOp-B (ASCAT), etc.
Precipitation radar & cloud radar
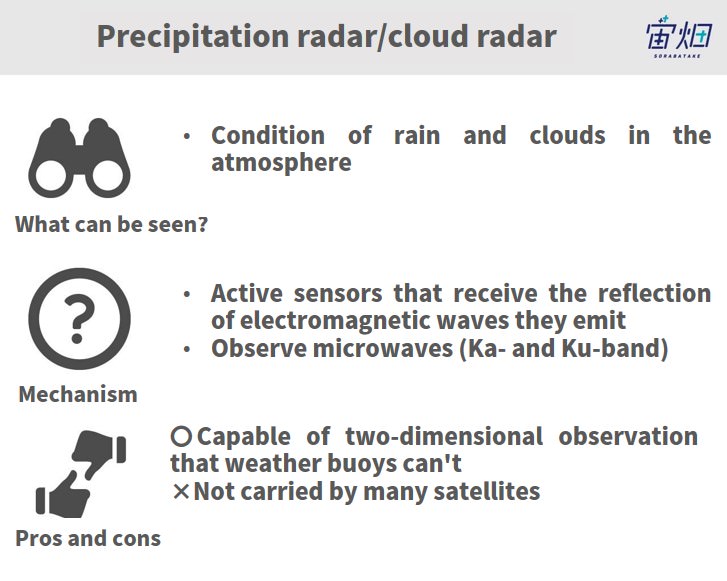
The condition of rain, clouds, etc. in the atmosphere can be examined through microwaves with a wavelength that is reflected by precipitation particles, such as raindrops and water particles in clouds (Ka-/Ku-band).
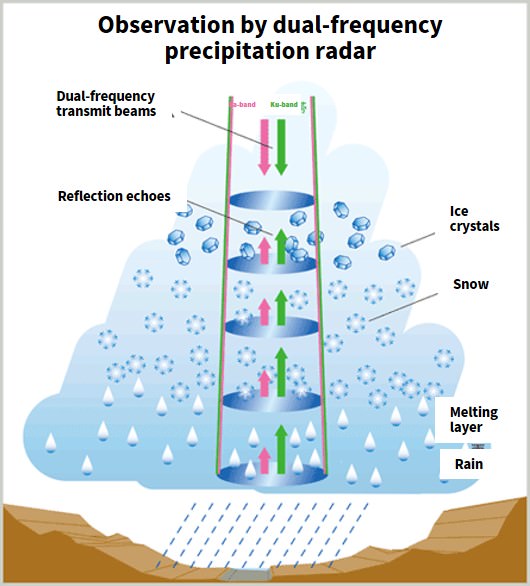
【Satellites with precipitation radars】
GPM (DPR) and some other satellites
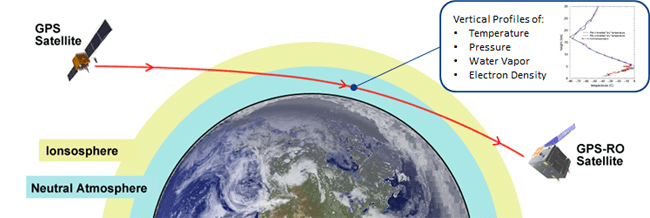
GPS RO (Radio Occultation)
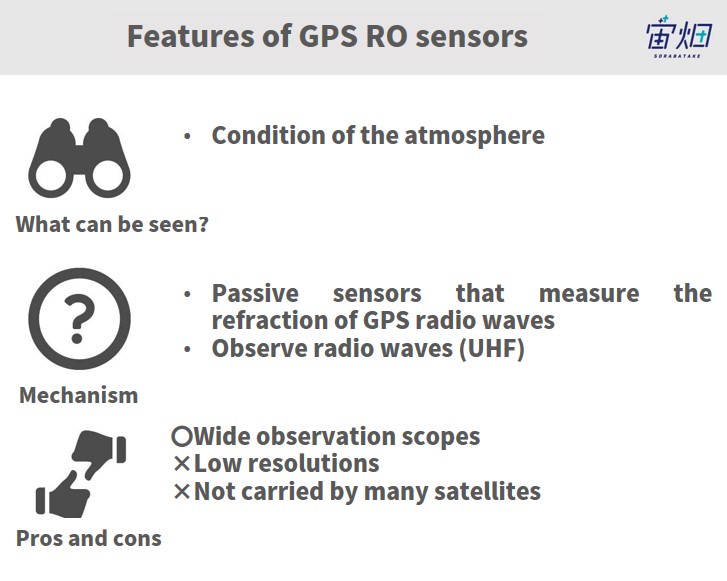
GPS RO is an observation technique similar to precipitation radar, but it looks at how GPS radio waves are scattered.
As GPS RO does not need to emit radio waves itself, it has the advantage of being smaller..
【Satellites with GPS RO receivers】
Spire, PlanetiQ, etc.
We introduced several types of data from satellite observations above.
Satellite data is, however, not limited to observation data. Data that is transmitted via radio waves from the Earth and collected by satellite is also called “satellite data”.
We’ll show you two types of such satellite data next.
AIS (Automatic Identification System; vessel information collection
Vessels sailing on the sea that fall under certain categories are required to keep transmitting radio signals according to regulations in order to let others know their position, speed, etc. for collision prevention and other purposes.
You can track your cargo on the sea by checking these signals using satellites.
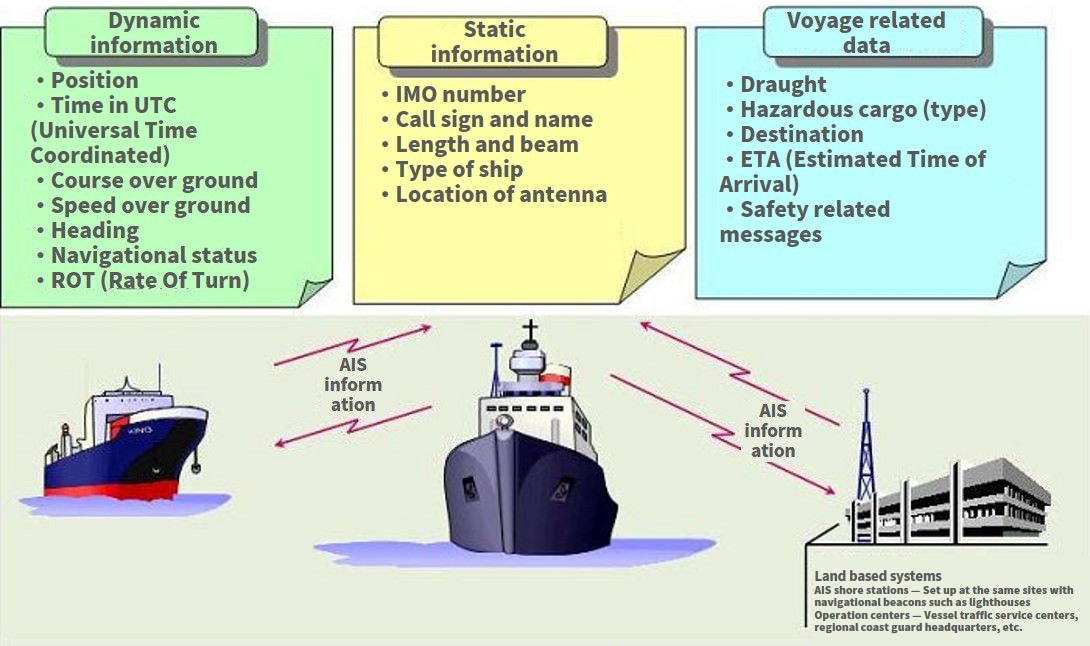
【Satellites with AIS receivers】
Spire, Iridium NEXT, etc.
■ Recommended articles in Sorabatake about AIS
News
Sorabatake editorial department
Detect illegal operations using small SAR satellites & AIS information【Weekly Space Industry News, Jan. 21 – Jan. 27】
Satellite-Data
Sorabatake editorial department
The potential of the space industry from the viewpoint of AIS
ADS-B (Automatic Dependent Surveillance-Broadcast; aircraft information collection)
ADS-B is like the aircraft version of AIS through which aircraft information is collected, including category, airspeed, identity and turning, ascending and descending movement.
The disappearance of the Malaysia Airlines aircraft prompted its implementation. ADS-B is going to become mandatory in North America and Europe in 2020.
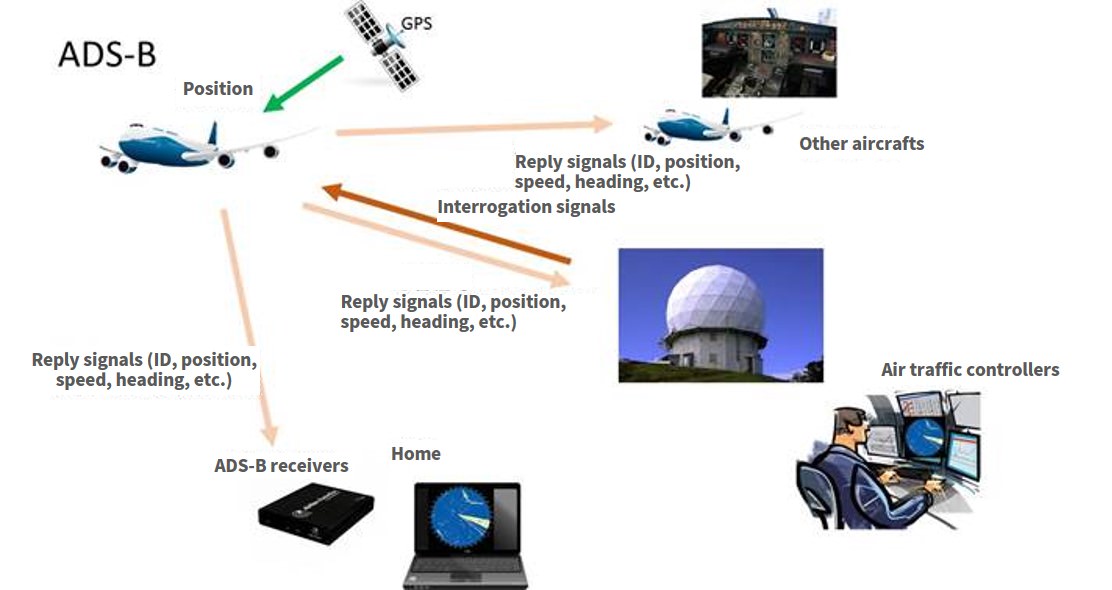
【Satellites with ADS-B receivers】
Spire, Iridium NEXT, etc.
(2) Observation interval and observation time (recurrent period and mean local solar time)
In the previous chapter, we explained what satellite data tells us, and the mechanisms and types of sensors to obtain that data.
So when and how often do satellites make observations? If observation interval is very long, that data is useless for change detection, right?
When you think about observation interval, you should know first there are two broad categories of satellites that stay at different altitudes: geostationary satellites and low-Earth-orbit satellites.
Geostationary satellites always stay at a position from which their target spot can be observed, orbiting at the same speed as the Earth’s rotation so that they can obtain necessary data anytime.
On the other hand, each low-Earth-orbit satellite has different observation time and interval. “Recurrent period” and “local solar time” are the indicators for observation interval and observation time, respectively.
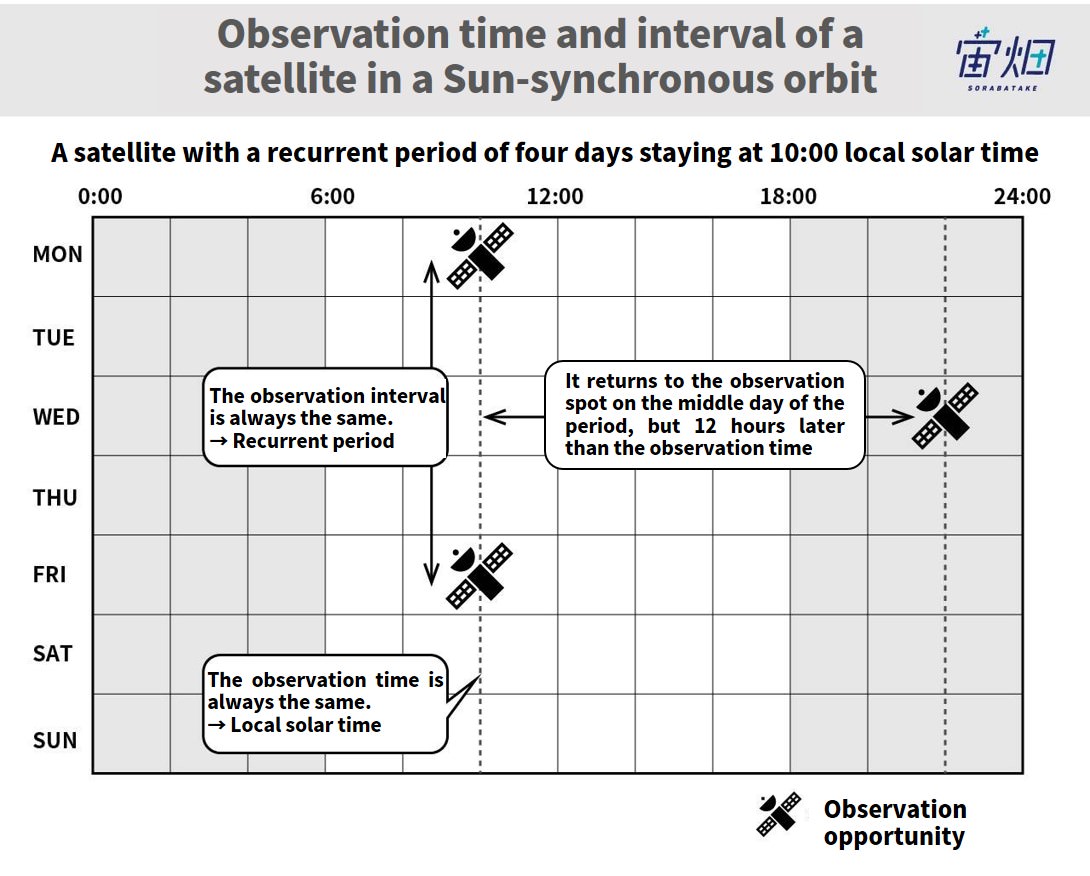
Observation time = local solar time
What you should learn next is “local solar time”.
The local time at the spot on the Earth right under a satellite in an orbit called a Sun-synchronous orbit, and is always the same. The time at this spot is known as the “local solar time”.
It means if a satellite crosses the equator at 10:00 local solar time, it can observe areas across the globe only at 10:00 or 12 hours ahead at the opposite time of 22:00. It can’t make any observations at other times. Technically, local times are set based on each country’s reference point, so there is a gap of about one hour between local solar time and the corresponding real local time.
Usually, Sun-synchronous orbits are chosen for satellites with optical sensors to keep them facing in the same direction with respect to the Sun, because they are greatly affected by sunlight.
Since obliquely incident light produces better imagery, orbits before or after noon are usually taken (on the noon orbit, light comes from right behind satellites, making it too bright). When the Sun heats the Earth’s surface, it generates ascending air currents, which in turn produces clouds, so it is preferable to make observations at as early a time as possible. For this reason, the majority of satellites take an a.m. orbit rather than a p.m. one.
Some recent microsatellite constellations, however, give priority to shorter observation intervals over orbits. Such satellites don’t factor in local solar time.
SAR sensors are not affected by sunlight while making observations, but they need higher power to actively emit radio waves, so SAR satellites usually take the orbit at 6:00/18:00 local solar time to keep generating power all the time using sunlight. This orbit runs between day and night and is accordingly called the Dawn-Dusk orbit.
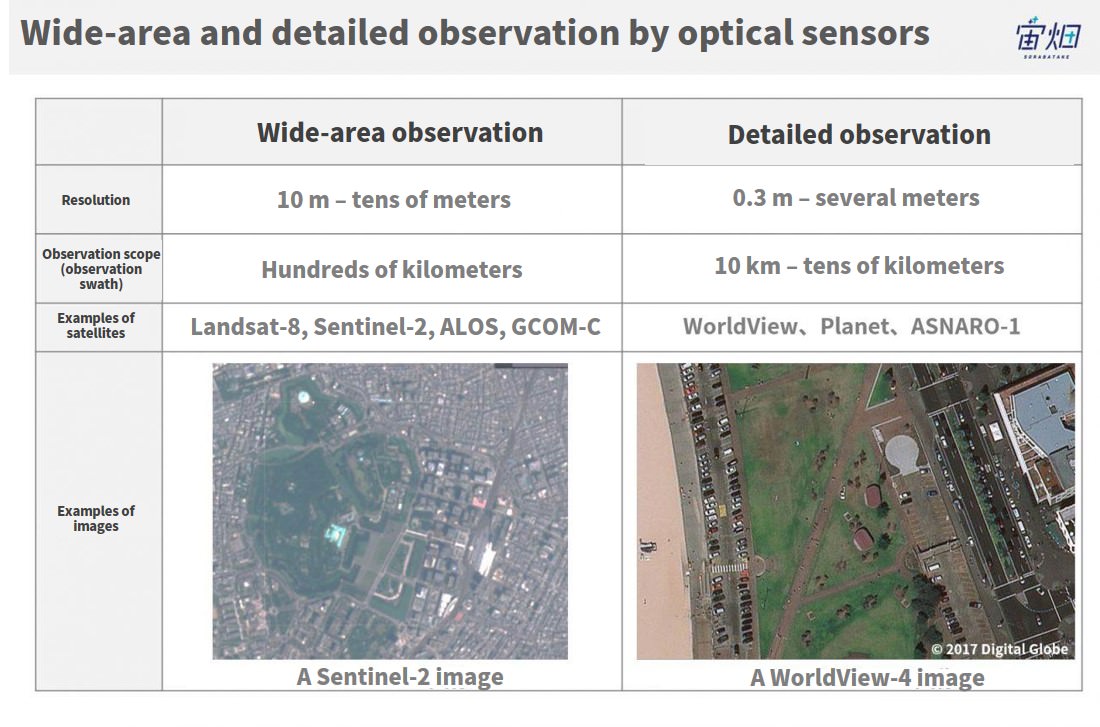
(3) Resolution and observation scope (resolution and observation swath)
Perhaps you may think that resolution is the important factor for satellite imagery. It’s important in particular for optical and SAR sensors.
Due to the mechanism of sensors’, a higher resolution makes the observation scope smaller, and, in the opposite way, to observe a wider area at any time, you have to lower the resolution.
The lateral width of an observation scope is called the observation swath. Satellites are designed for either wide-area or detailed observation based on their mission.
Satellites for wide-area observation keep observing areas right under them to capture images collectively covering the whole surface of the globe.
Satellites for detailed observation have smaller scopes, so usually their operators move the cameras to observe specific areas at the request of each customer.
However, recent microsatellites like Planet simulate wider observation scopes by increasing the number of units, to observe every corner of the globe.
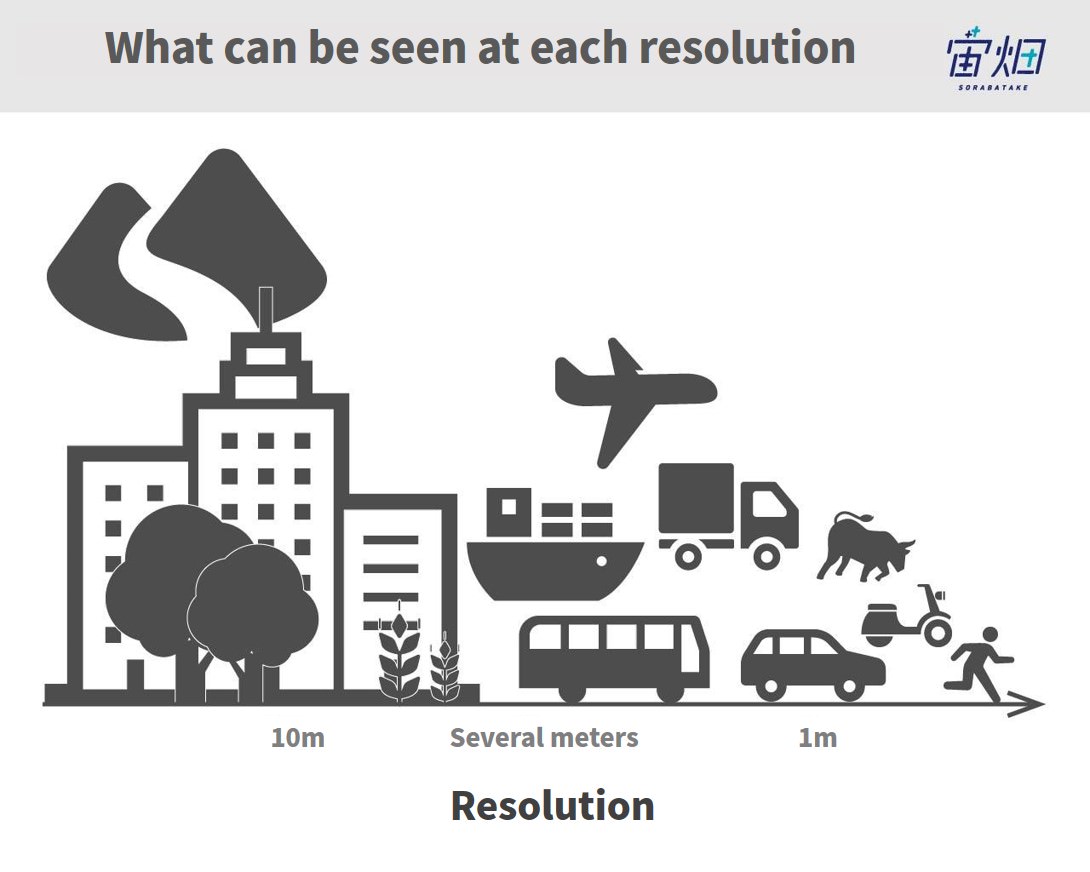
It’s hard to imagine what can be seen only from figures of resolution, isn’t it?
For your reference, we’ve put in the figure below some examples of objects that can be seen by satellites’ optical sensors with different resolutions.
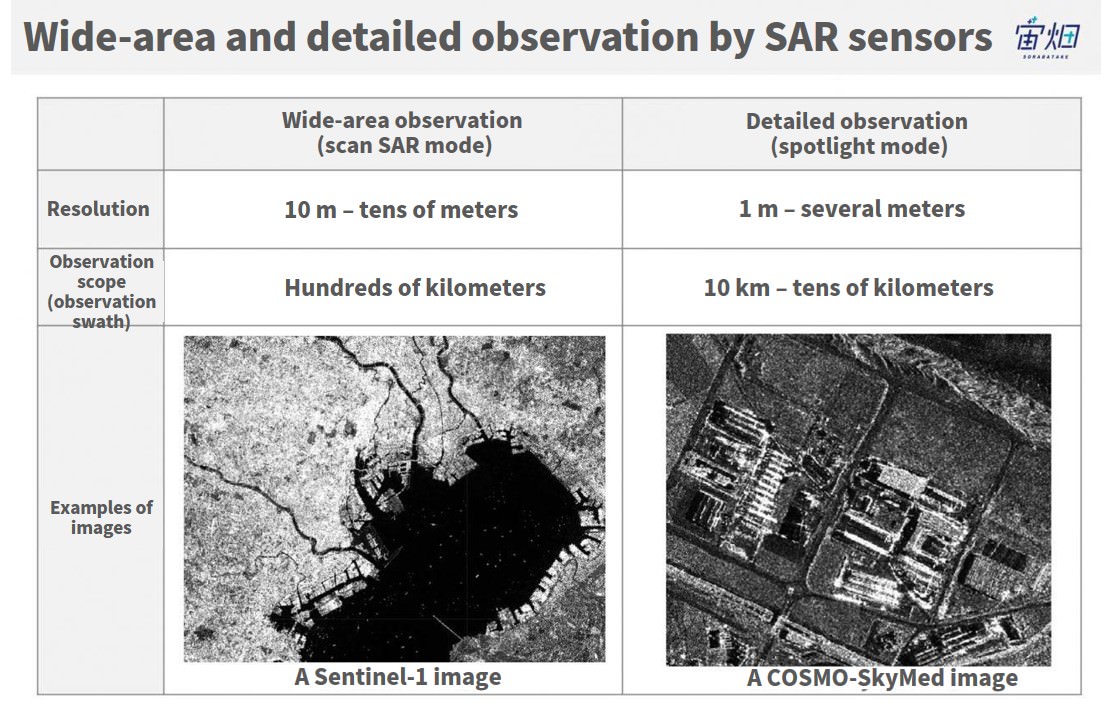
A SAR sensor can conduct both wide-area and detailed observation depending on observation modes. When necessary, SAR satellites keep focusing on the same spot to get higher resolution imagery.
SAR imagery is not as clear as optical imagery; you should be aware that SAR and optical imagery with the same resolution don’t even look the same.
Satellite-Data
Sorabatake editorial department
Can people be seen from artificial satellites? -Summary of GSD and local time by satellites-
(4) Use and analysis cases of satellite data
Now you’ve got the basics of satellite data. Congrats. So how is satellite data used and analyzed in the real world?
You can learn recent use cases with this space use landscape created by Sorabatake, but here, we are going to show you some textbookish methods of data analysis.
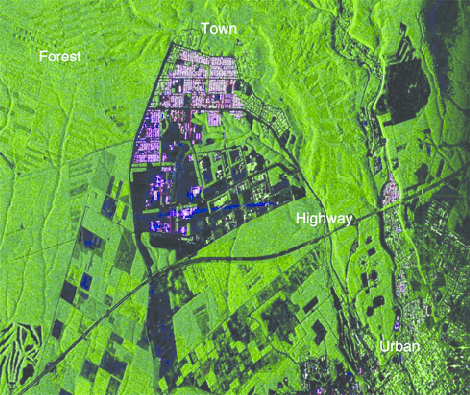
● Land cover types
As we explained in the section of visible/infrared sensors, satellites can identify land cover types, such as forest, rice paddy, vegetable field and commercial districts, from intensities of reflected light with different wavelengths.
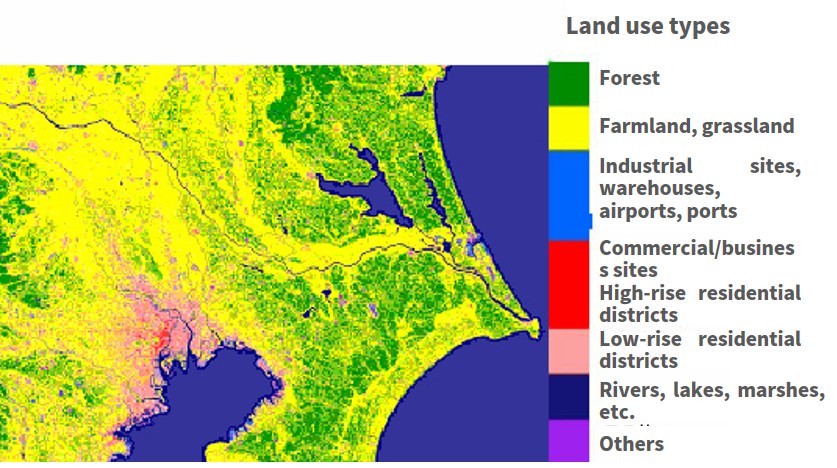
There are also cases where SAR sensors are used to identify land cover types through polarized microwaves.
■ Articles in Sorabatake about “land cover type” analysis
Satellite-Data
Sorabatake editorial department
Do urban areas really have higher proportion of Democrats than rural areas in the US? Check this out using satellite data
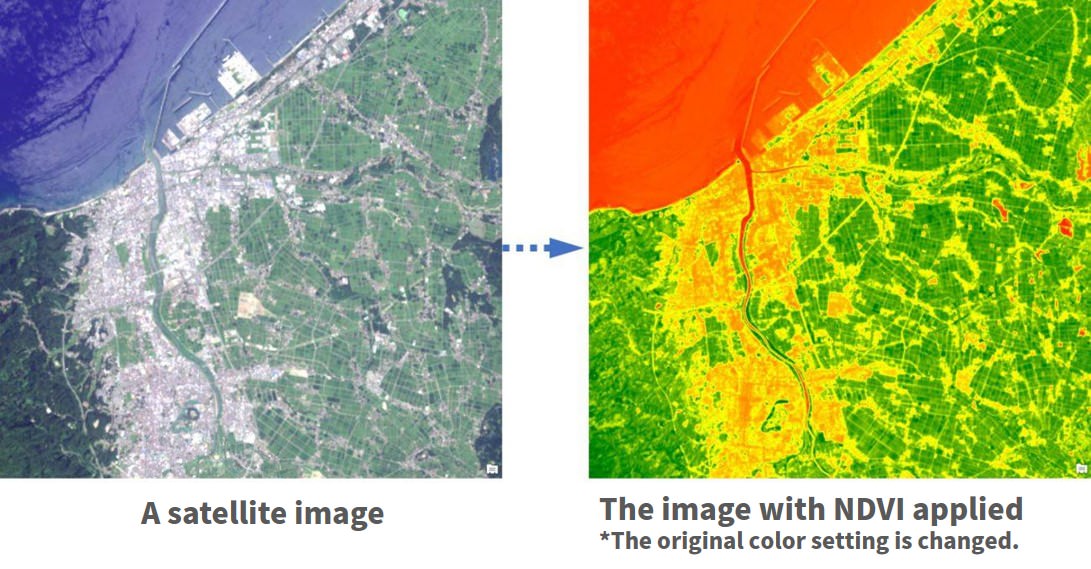
● NDVI (a vegetation index)
A vegetation index is an index invented to understand the condition of vegetation by means of simple calculation that uses satellite data, taking advantage of the way plants reflect light. It indicates quantity and vitality of plants. NDVI (Normalized Difference Vegetation Index) is a major vegetation index.
NDVI is obtained by calculating the intensity of red visible (R) and near infrared (NIR).

■ Articles in Sorabatake about “NDVI”-related analyses
Satellite-Data
Sorabatake editorial department
Check out autumn leaf spots using a satellite to determine the progress of fall foliage color change!
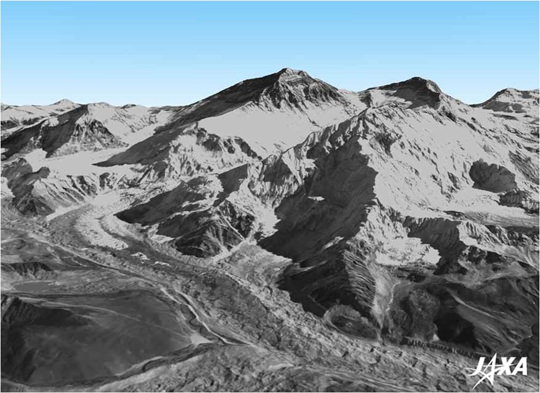
● DEM (Digital Elevation Model; three-dimensional elevation map)
You can produce three-dimensional models with altitude information from optical images of the same spot captured from two different directions.
JAXA is developing a high-precision digital 3D map that covers all the land on the globe from about three million satellite images captured by the Advanced Land Observing Satellite “DAICHI” (ALOS).
http://www.eorc.jaxa.jp/ALOS/aw3d/index.htm
■ Articles in Sorabatake about “DEM”-related analyses
Satellite-Data
Sorabatake editorial department
Do leading universities in the Hakone Ekiden have more slopes on their school routes? Check out this urban legend using satellite data
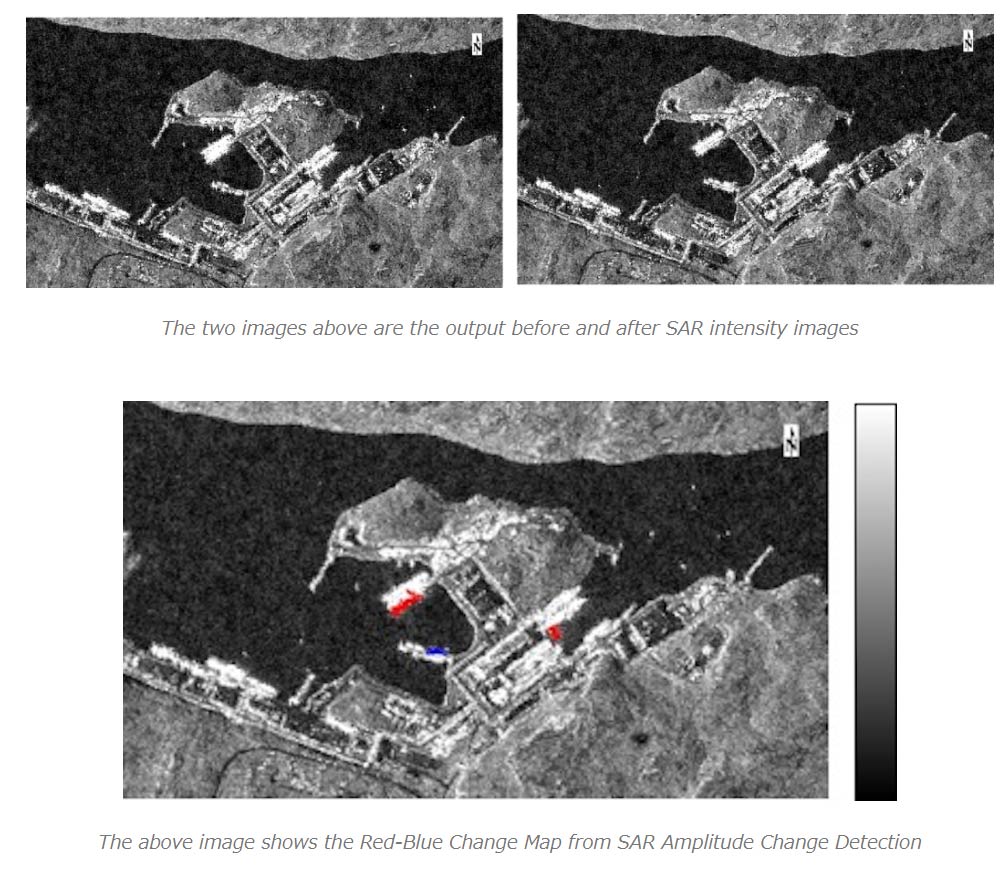
● Change detection
It’s hard to get a clear SAR image of the Earth’s surface compared to an optical image, but SAR imagery is great when it comes to change detection between two images captured at different times.
You can detect departure and arrival of vessel numbers between the two images below.
■ Articles in Sorabatake about analyses related to “change detection using SAR imagery”
Satellite-Data
Sorabatake editorial department
When Is Tokyo Disneyland Least Crowded? Congestion Prediction Challenge Using Free Satellite Data (Part 1)
(5) How to get (free and paid) satellite data
We told you the basics of satellite data in Chapter 1 to 3, and how satellite data is used in real life in Chapter 4.
The content has got rather voluminous, but, I suppose, once you read up until Chapter 4, many of you may be inclined to play with real satellite data.
However, is satellite data available to regular people? In fact, everything is virtually in place now for general citizens to view and actually analyze satellite imagery at low or no cost at all.
In this chapter, we’ll introduce websites where you can get satellite data and the satellites providing this data. With the basic knowledge of satellite explained in Chapter 1 to 3, you should be able to understand much more when viewing websites that supply satellite data.
Free satellite data
Data from governments’ satellites is often available for free. These are mainly satellites for wide-area imaging.
- The US government’s satellite data — LandsatLook Viewer
https://landsatlook.usgs.gov/
A revered optical sensor satellite designed for wide-area imaging. It makes an observation once a fortnight. Its data is the oldest among published satellite data, dating back to 1972. The latest unit is Landsat-8, which is the eighth in the series.
- EU government’s satellite data — Copernicus
http://www.copernicus.eu/
A series of satellites designed for wade-area imaging like Landsat. Sentinel-1, -2 and -3 carries out SAR, optical and ocean observations, respectively. Sentinel-2 has a resolution slightly higher than Landsat-8, maybe because it was developed with Landsat in mind. Sentinel-1 and -2 also operates at an observation interval of about five days, which is shorter than Landsat-8.
Copernicus is user-friendly, too, providing analyzing tools for each type of use case and each field where its data is used.
- Japanese Government’s satellite data — G-Portal
https://gportal.jaxa.jp/gpr/
JAXA’s satellite imagery is available for free. Japan’s satellite data doesn’t exceed Europe’s or the US’s in overall quantity, but Japan provides more data from microwave observations. G-Portal provides data of physical quantities such as precipitation and sea surface temperatures as well as imagery.
Moreover, Tellus, which was introduced in 2018, is expected to become a platform where you can get satellite data for free. Read this article for further information about Tellus.
You are encouraged to register for Tellus if not yet.
Paid satellite data
Paid data is basically detailed observation satellite data.
- DigitalGlobe
https://discover.digitalglobe.com/
You can buy images by the WorldView satellites with their highest resolution being 0.3 m, which is the highest for commercial use. DigitalGlobe is the biggest satellite data supplier in the world, offering satellite data used for national defenses.
Because their observation scopes are small due to high resolutions, image capturing is basically carried out by customers’ requests. They can observe any spot everyday with the five-unit array of satellites, namely WorldView-1 & -3 and GeoEye-1 & -2.
- Planet
https://www.planet.com/explorer/
Planet offers detailed observation satellite data like DigitalGlobe. Resolutions of Planet’s satellites are several meters. This is not as high as DigitalGlobe’s WorldView and GeoEye satellites, but it simulates a wide observation scope by launching more than 100 inexpensive units to make the observation interval shorter.
(6) Satellite data analysis software
After downloading satellite imagery, you need analysis software. We will list some pieces of satellite data analysis software below for you.
【Free software】
- EISEI
“EISEI” is a satellite image processing software developed by the Young Astronauts Club – Japan with JAXA researchers for educational purposes. You are not allowed to use it for commercial purposes. Read carefully the terms and conditions available at the link below before using EISEI. Note that it only supports Windows.
The software’s language is Japanese. It’s very easy to use for Japanese users with control buttons labeled in Japanese. We recommend it to beginners who want to first try out using satellite-data-analysis software.
- You can download EISEI here
http://www.yac-j.com/hq/info/eisei_kiyaku171226.pdf
QGIS
QGIS is a professional GIS application built on top of Free and Open Source Software (FOSS).
QGIS is an official project of the Open Source Geospatial Foundation (OSGeo). It runs on Linux, Unix, Mac OSX, Windows and Android and supports numerous vectors, raster, and database formats and functionalities (cited from https://www.qgis.org/en/site/about/index.html).
Its advantage is that you can get a lot of information by googling when you have troubles because there are many users of QGIS across the world. A number of books have been published about it, too. Although there is the Japanese version, you might find it a bit hard to use at first since it has lots of menus for analysis used by researchers.
- You can download QGIS here
https://www.qgis.org/ja/site/about/index.html
MultiSpec
Image analysis software developed mainly by Purdue University. As the name indicates, it specializes in multispectral image analysis. There is no Japanese version. It has a Mac, Windows and online version.
- You can download MultiSpec here
https://engineering.purdue.edu/~biehl/MultiSpec/index.html
【Software for commercial use】
ArcGIS
GIS (Geographic Information System) software provided by Esri. It doesn’t only process imagery, but comes with tools you can immediately use for your purposes.
ArcGIS includes plenty of map data you can use out of the box and various apps you can introduce into your business with simple configuration. You are able to access shared maps and information using the apps at any time, from anywhere, through any device.
- Check out this URL to learn about ArcGIS
https://www.esrij.com/products/arcgis/
ENVI
Another piece of image processing software provided by Esri.
Remote sensing image analysis application for professionals.
- Check out this URL to learn about ENVI
https://www.esrij.com/products/envi/
Special
Sorabatake editorial department
Process satellite data for free! Five recommended pieces of free satellite image analysis software
(7) This is the time to start using satellite data.
We outlined above the basics of satellites & satellite data, and cases and methods of analyses.
We are pretty happy if this post helps you understand satellite data even a little better.
This article is written as accurately as possible, but note that we skipped some details for simplicity. And we only explained principles, so we suggest you read the specs of each satellite referring to this article.
For further reading, we recommend this book.
Give it a try.
・基礎からわかるリモートセンシング(日本リモートセンシング学会, 2011)
This website, offered by the Remote Sensing Society of Japan (RESTEC), lists the specs of Earth observation satellites/sensors.
This website summarizes specific procedures of satellite data analysis.
The website of the satellite image analysis software ArcGIS gives you detailed information about GIS.
It offers an extensive glossary.
This is an I-tried-doing type blog by engineers.
As I have just introduced to you, there are a load of free satellite imagery out there as well as free analysis software. Don’t think too much, just give them a spin.
Please don’t forget to try Tellus, either. It will help you begin viewing and analyzing satellite data.
You can register for Tellus here