NDVI provided by Shikisai (GCOM-C) is available on Tellus!
We will be introducing the summary and directions for using the NDVI (normalized difference vegetation index) data provided by Shikisai (GCOM-C), that was added to Tellus OS on May 28, 2020.
The NDVI (normalized difference vegetation index) data that is recorded by Shikisai (GCOM-C), a satellite which keeps track of climate change, has been made available on Tellus from May 28, 2020.
In addition to climate change, the data recorded by Shikisai is expected to be useful in keeping tabs on things like natural disasters, natural resources, as well as agricultural development, yellow dust movements from northern China, and fishing zones.
This article will introduce the data provided by Shikisai implemented into Tellus, and give examples of how to use it.
★Register for Tellus here
1. The Data Provided by SHIKISAI (GCOM-C)
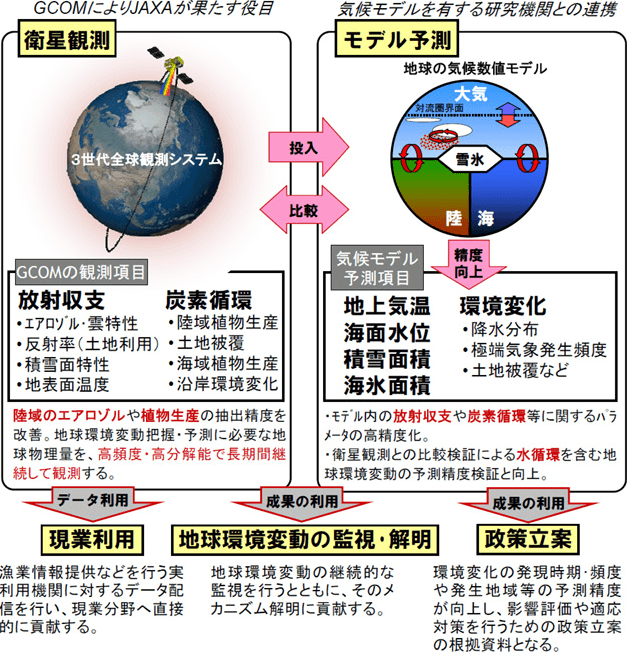
Shikisai is JAXA’s satellite used to observe climate change, equipped with a “second generation global imager” (SGLI) optic sensor that observes multiple wavelengths that range from near-ultraviolet to thermal infrared (380nm~12µm) and is capable of observing 28 different climate changes spread across the four categories of clouds, aerosol (dust in the atmosphere), sea color, and vegetation for half of the earth in one day, and the entire earth in two.
Up until now, Tellus has provided data from Shikisai on sea surface temperature, chlorophyll a concentration, earth surface temperature, all of which are available now on Tellus OS.
We introduce the details on these different data sets in the articles below, so be sure to check them out.
Sorabatake Articles About Shikisai (GCOM-C) Introduction to satellite data
Check out sea surface temperature and chlorophyll a concentration! SHIKISAI (GCOM-C) satellite data is released on Tellus!
Earth’s Surface Temperature Data taken by “Shikisai” (GCOM-C) will be Released on Tellus!
2. How to View Shikisai (GCOM-C)'s NDVI Data on Tellus OS
First, make an account by entering the necessary information on Tellus and log in to Tellus OS.
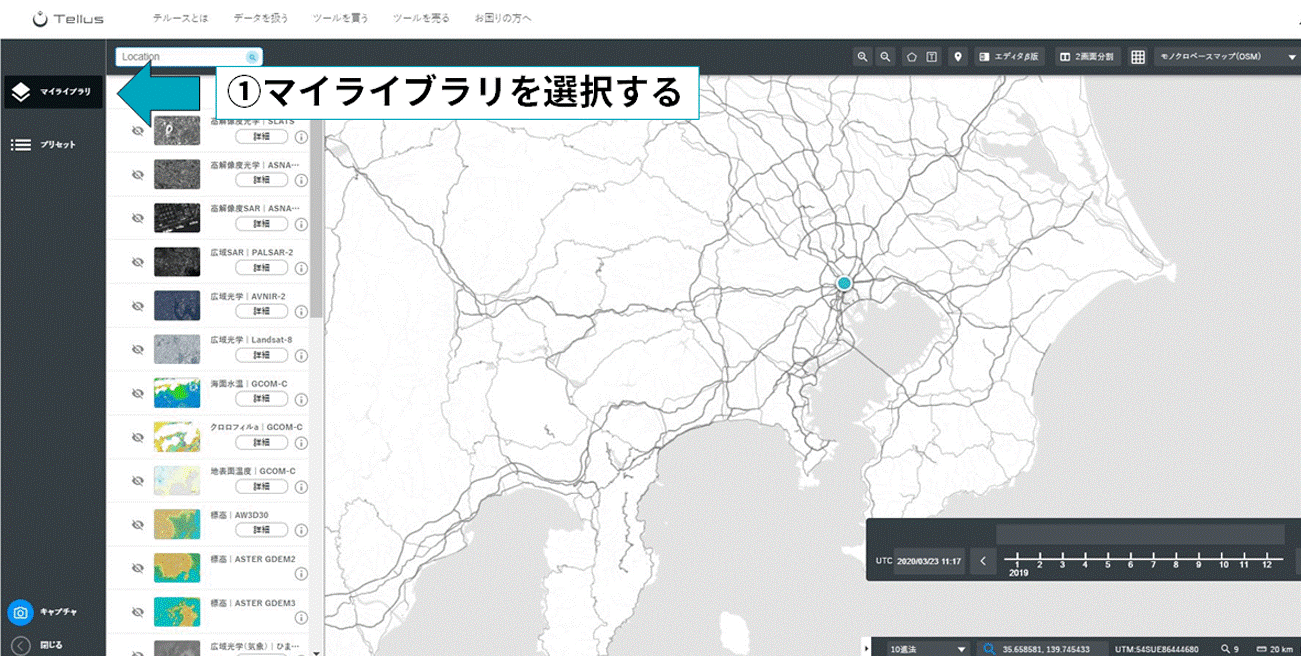
After opening Tellus OS, select “My Library” on the left menu.
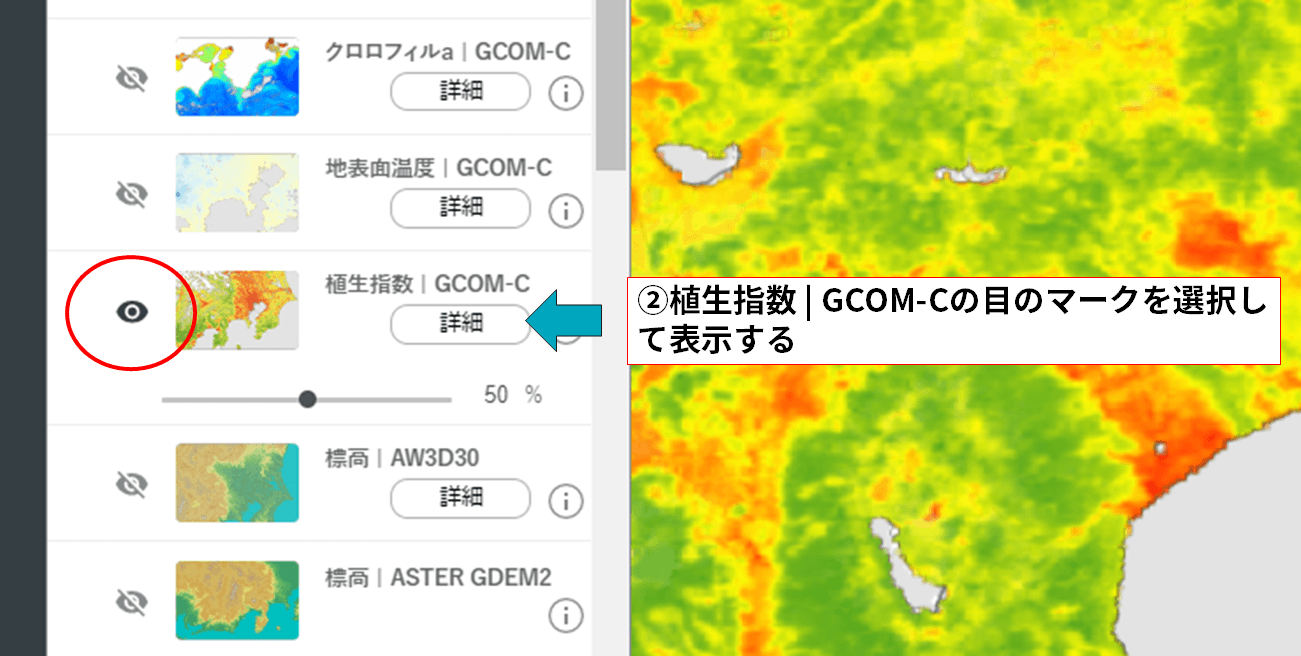
Search “Earth Surface Temperature/GCOM-C” and click on the eye icon to view the data.
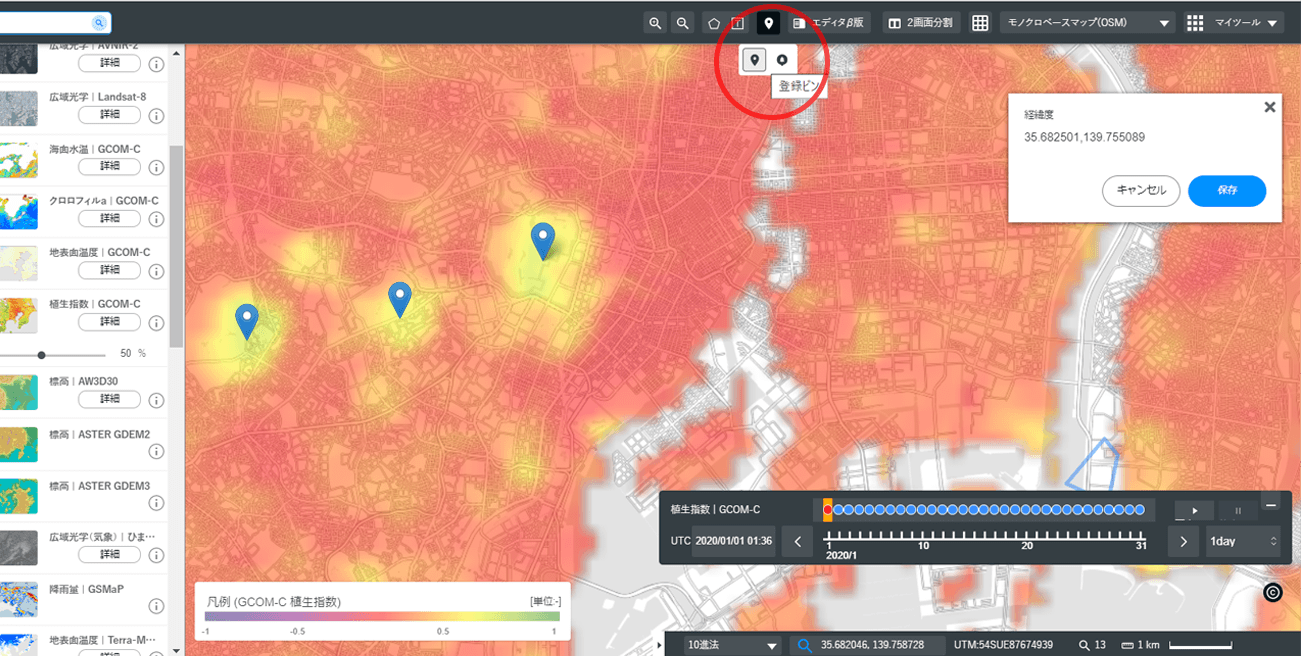
After you are able to view the data, move to an area where you would like to research and look up surface temperature.
If we use the 23 wards of Tokyo as an example, the pins in the picture below shows three points where there is a high vegetation index, from the left: Yoyogi Park, Akasaka Palace, and the Imperial Palace.
3. How to Use Shikisai (GCOM-C)'s NDVI Data
So what kind of things can we see by learning to use and understand NDVI (normalized difference vegetation index) data?
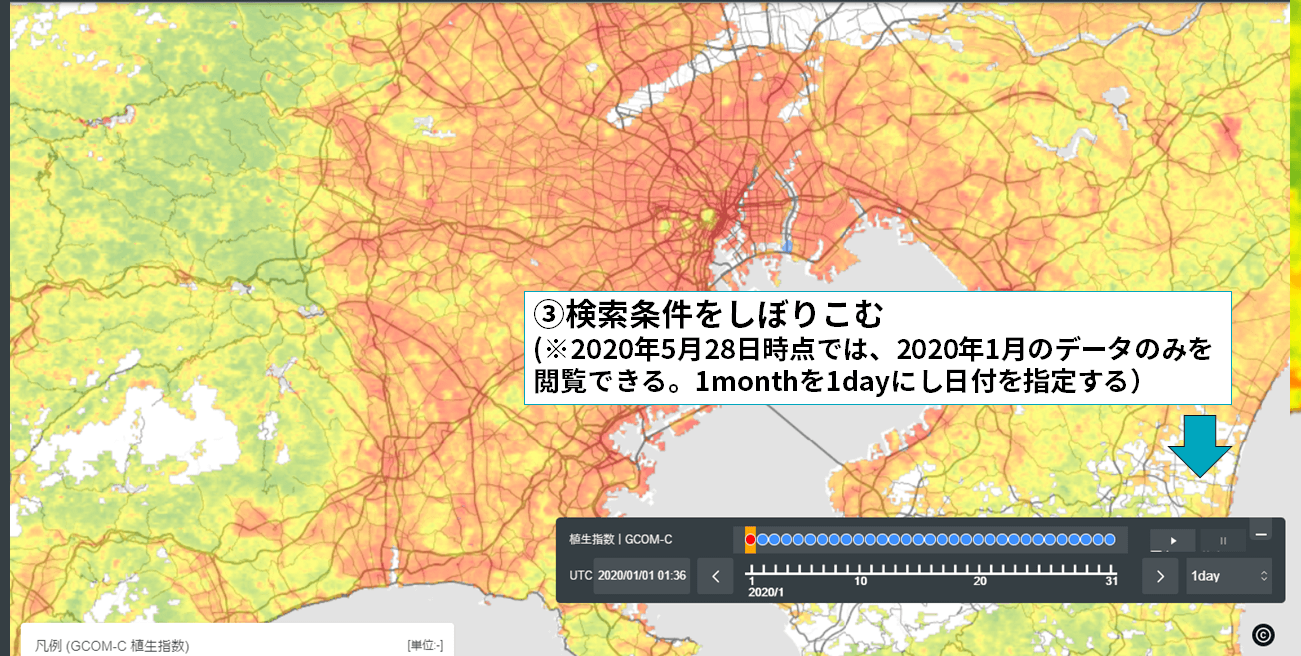
The first thing unique to Shikisai worth noting is how frequently it updates its data. At this point in time, the only period available to see is the month January 2020, which limits how much we can make use of its high-frequency capability, but at Sorabatake, we took a look at the forest fires that happened in Australia at the beginning of this year.
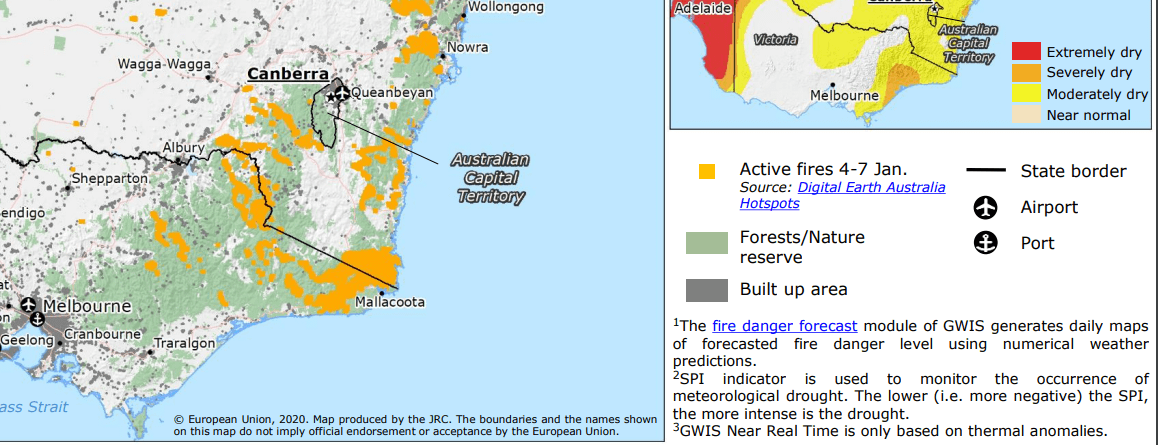
We knew from a news website that the fires occurred around the Canberra area in southern Australia in January 2020.
The orange areas show where the fires took place from January 4–7, 2020.
Let’s see how this looks on Tellus OS. Below is what it looks like when we pull up Shikisai’s vegetation index which we’ve explained in a previous article.
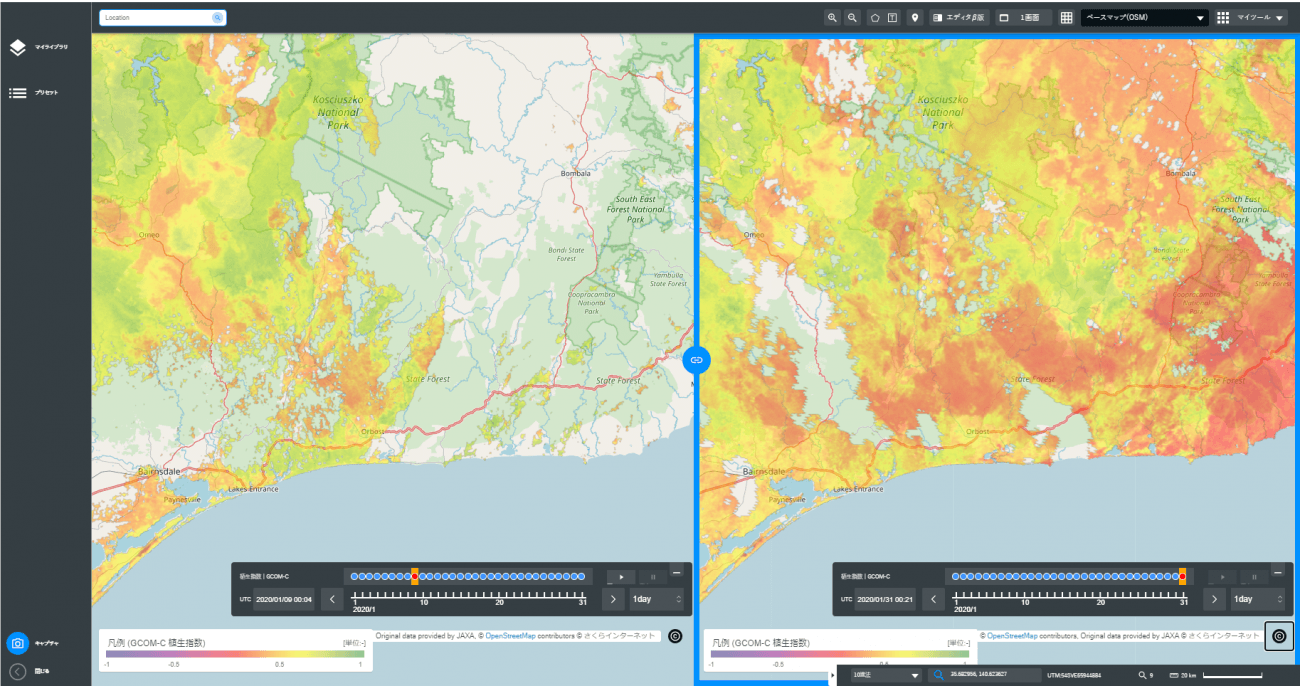
The smoke from the fires appears to have damaged some of the data, but the data we have shows that the red area is getting bigger, which signifies that there was a loss of vegetation.
Tellus doesn’t have a previous picture of this area’s vegetation, so we used the EO Browser to get an image from November 2019. This is what it looked like then.
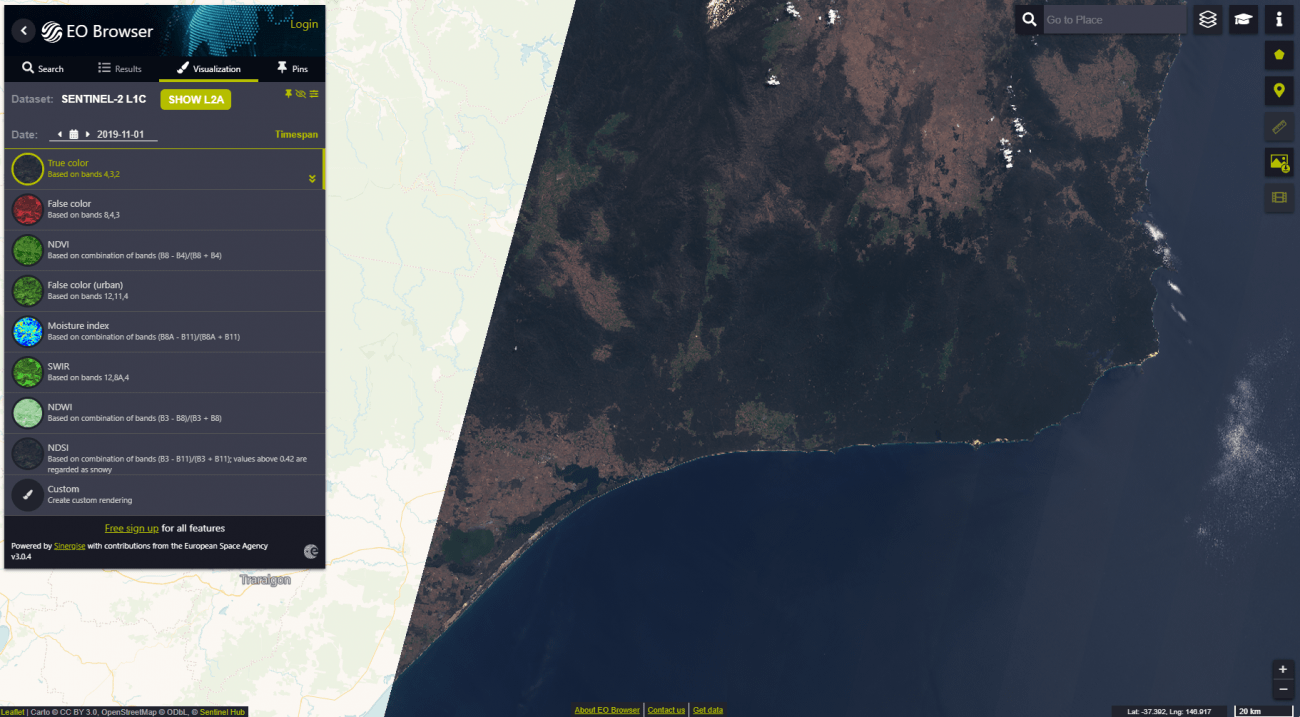
As you can tell, there was vegetation before. If you compare it to the red part taken earlier on January 31st, you can see that there is a lot less greenery.
In terms of using it for vegetation, it will likely be useful in watching over deforestation, or the removal of vegetation to cultivate new land. Try using Shikisai’s vegetation data for yourself to look at an area important to you.
4. Summary
That brings us to the end of our introduction of NDVI (normalized difference vegetation index) data provided by Shikisai (GCOM-C), available on Tellus OS from May 28, 2020. As of now, January 2020 is the only month available for NDVI data provided by Shikisai, but this will be updated from here on out.
We also plan on periodically releasing more types of satellite data on Tellus, and introducing more ways that it may be able to help your business. ★
We look forward to creative readers with new ideas on how to use satellite data to start new businesses.
★Register for Tellus here