When Is Tokyo Disney Land Least Crowded? Congestion Prediction Challenge Using Free Satellite Data (Part 1)
When Is Tokyo Disney Land Least Crowded? Congestion Prediction Challenge Using Free Satellite Data (Part 1)
Tokyo Disneyland is very nice to visit at any time of the year. We do not lose interest although we repeat visiting over and over, or rather, we should say that it gets more interesting to visit as we get old.
However, what we fear is the “crowdedness”.
Isn’t there any way we can go there on least crowded day?
So, here comes the 8th article of “Space Data Utilization”! This time, we will try to predict the congestion situation of Tokyo Disney Land using last year’s satellite data!
※This is 8th article of “Space Data Utilization”, a project which Sorabatake members seek for interesting people/objects/events through satellite images, updated irregularly.
We are still in the middle of studying and training, but we hope you will enjoy our reports. Casual advices are always welcome!
(1) Predicting Congestion Situation of Tokyo Disney Land Using Satellite Data (Interim Report)
As we should notice first, this analysis is not complete. It was not so easy to get a ticket to the dream land.
However, as we have shown above, we have succeeded in identifying areas with cars parked in the parking area using satellite data. Although it is not able to identify cars one by one, we can distinguish between vacant asphalt and parked areas.
(2) The Whole Aspect of This Project
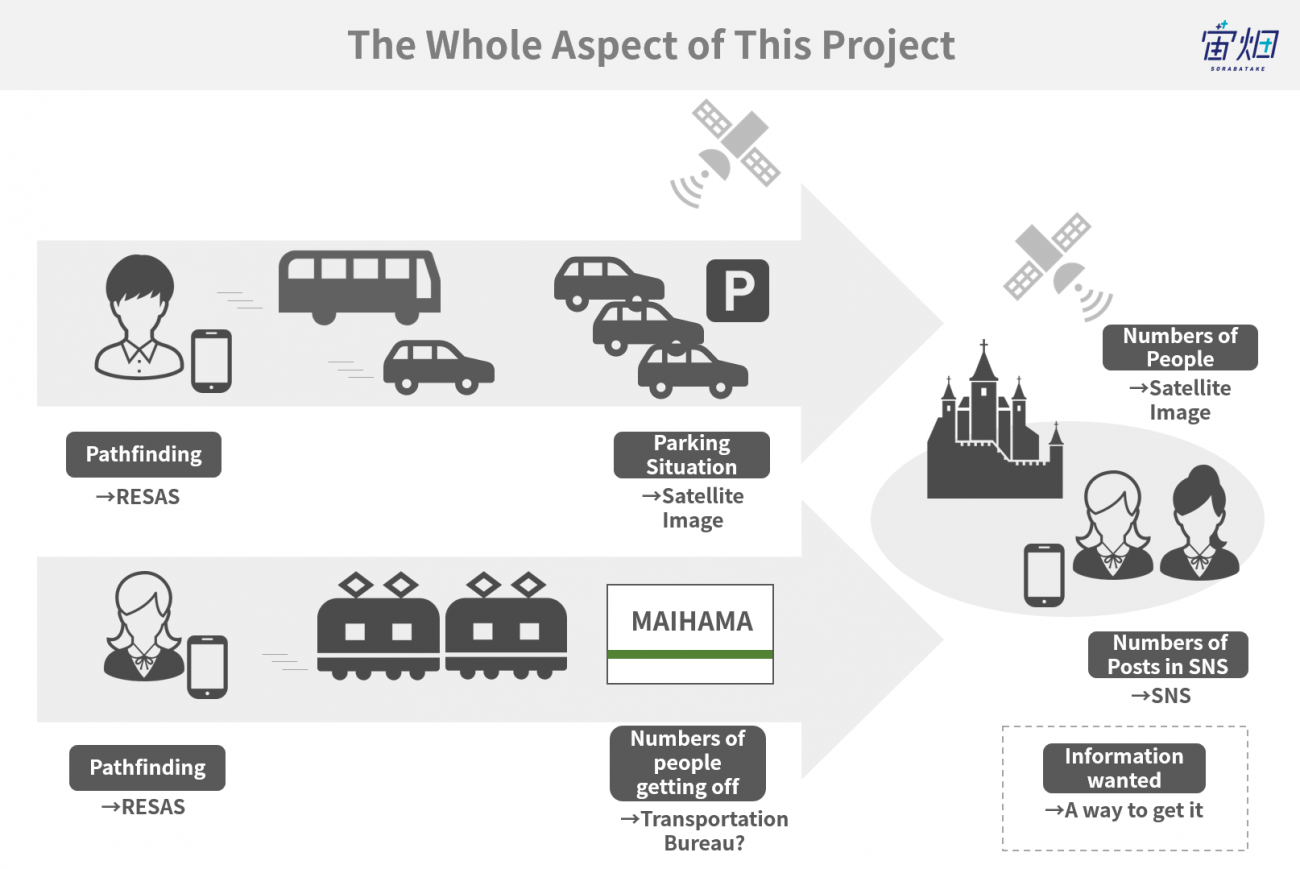
Now, we will explain how to carry out this project of predicting congestion situation of Tokyo Disney Land.
【Plan 1】Take a Image Inside the Park Using Satellite
This was the very first plan we got in mind.
However, as we have shown in past articles, it is impossible to catch the figure of humans with the low sensitivity of free satellite data.
Satellite data that shows figure of humans costs one million yen per image.
In order to analyze the congestion situation of a season, we will need at least two months image. If we buy them all, we will be bankrupt before going to Tokyo Disney Land. That’s putting the cart before the horse.
【Plan 2】Follow the Number of Posts in SNS
This too, seemed to be a nice idea, but it was difficult to distinguish between the post of “hey, I am in Tokyo Disney Land” and “hey, I want to go to Tokyo Disney Land”.
In addition, there are gaps in numbers of SNS users per generation, so there is the problem of low comprehensiveness in all generation.
It might be difficult to precisely predict the congestion situation inside the park using SNS posts.
【Plan 3】Check Up on the Means of Transportation to Tokyo Disney Land
The next plan was “predicting from the means of transportation to Tokyo Disney Land”.
Ways to get to the park are mainly two; (1)By train, and (2)By car.
(1) BY TRAIN
We made a hypothesis that if we could get to know the number of incoming and outgoing passengers of Maihama station, than we might be able to estimate the outline of the population visiting Tokyo Disney Land using trains.
As we searched,
・National Land Numerical Information The Number of Station Passengers Getting on and off
This data seemed to be effective, but it did not include daily data.
・Open Data Challenge for Public Transportation in Tokyo
This data, as you can see from its name, shows the open data of public transportation.
However, it needs an application in order to get access to the data (which we applied to it in a hurry).
・regional economic analysis system RESAS
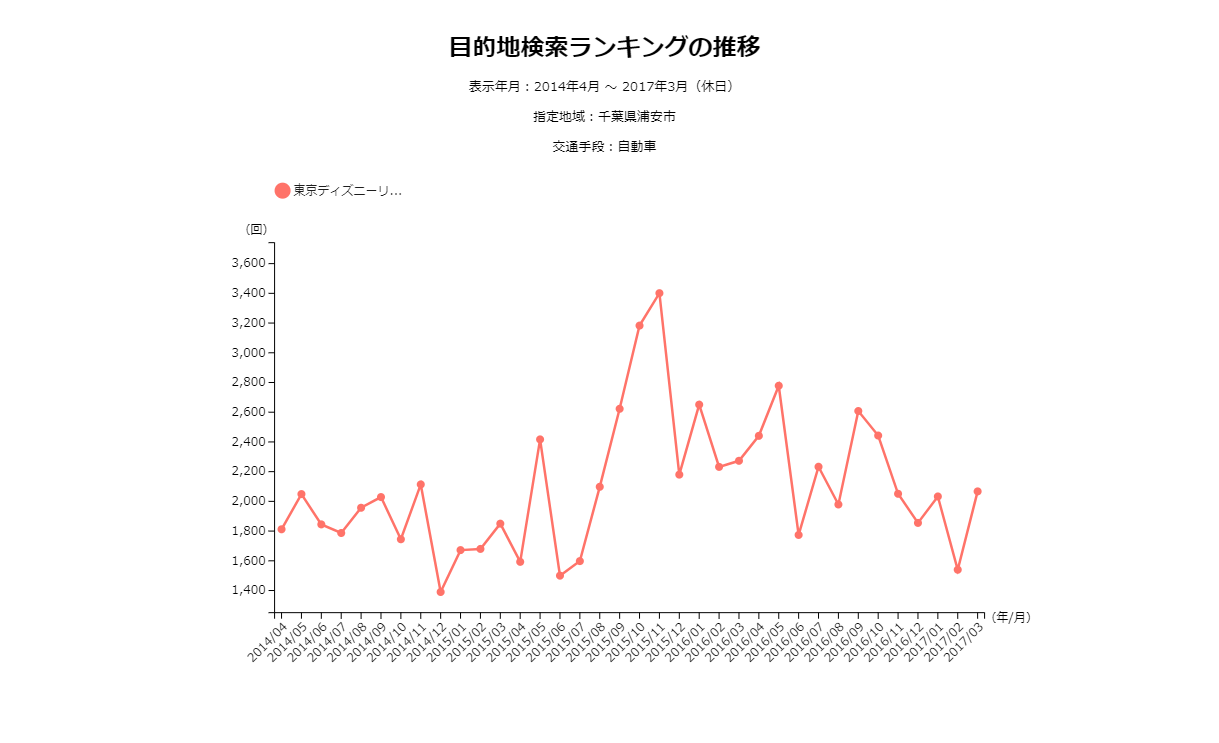
This is a system which Japanese government operates, and it shows “destination analysis” in the item of “tourism analysis”.
We can select two ways of transportation; car or public transportation.
It seems to be using a data from NAVITIME, for there is a mark of “NAVITIME” at the lower left of the screen.
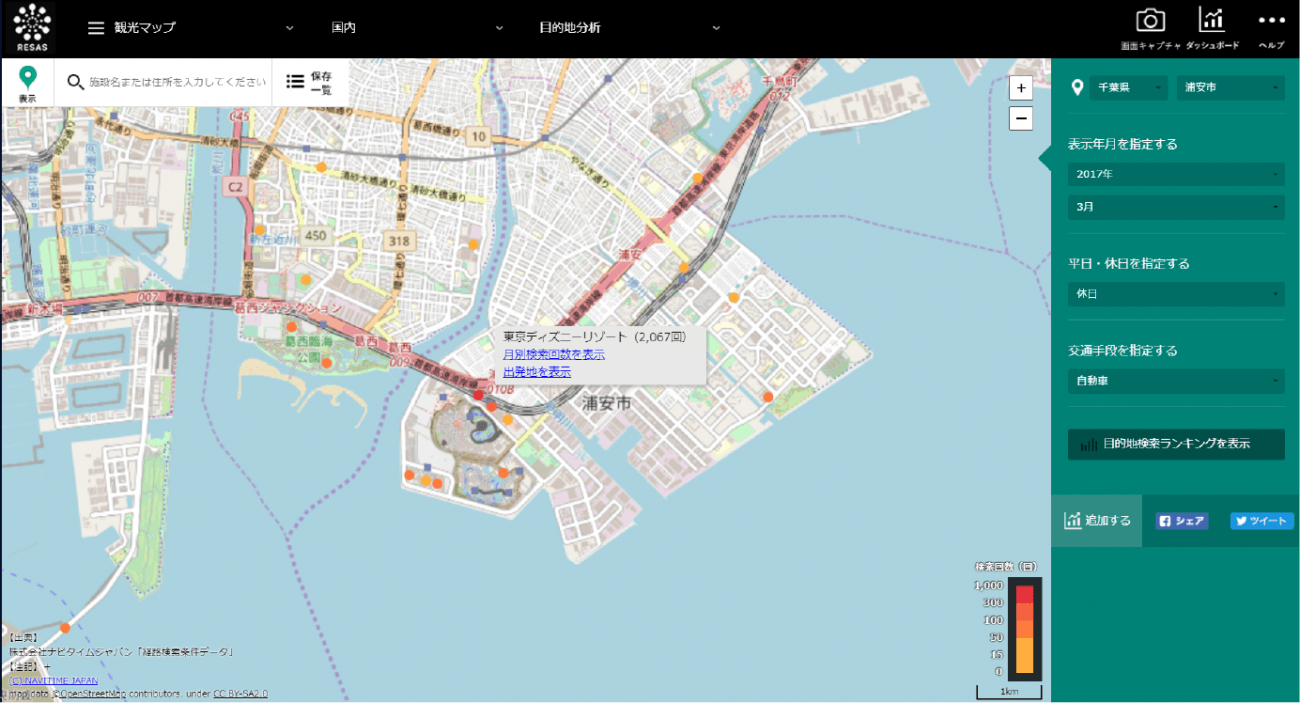
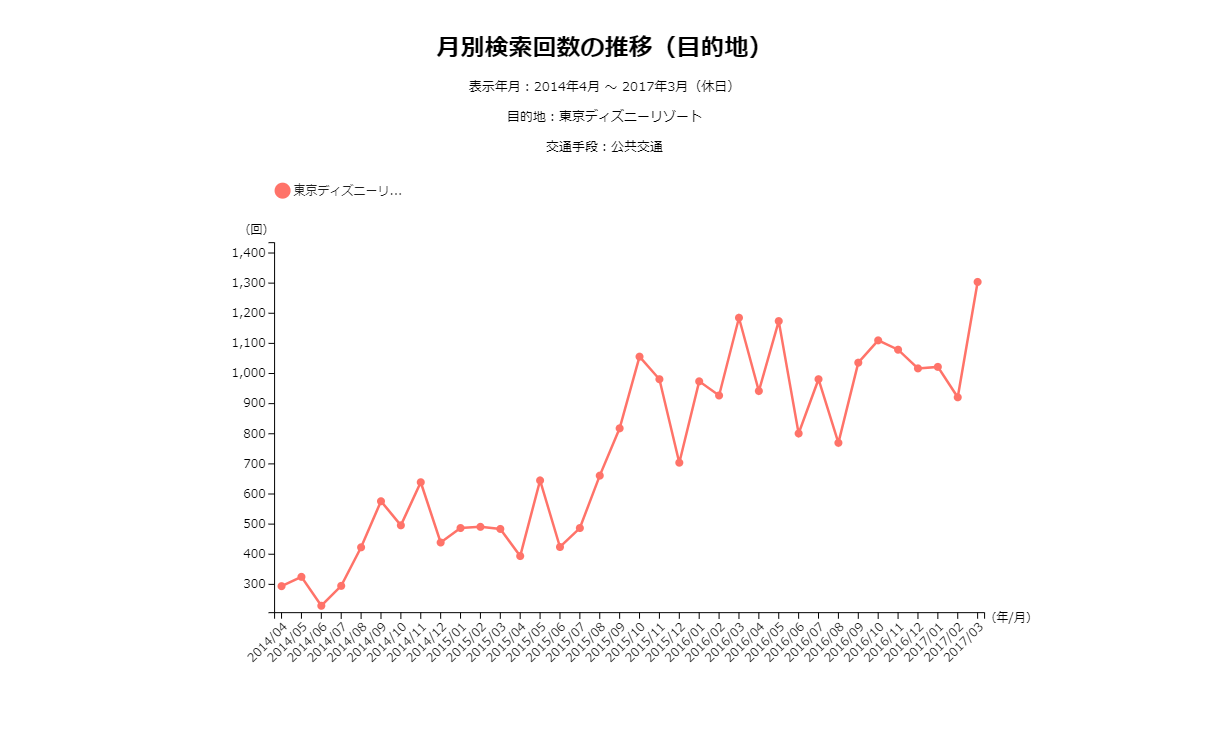
When we searched “Tokyo Disney Resort”, the graph showed a constant growth.
This data seems interesting, but it only shows monthly data, so it is not exactly the data we want now.
(2) BY CAR
We can also search about cars in RESAS.
However, this graph is also a monthly data.
NAVITIME is used when searching for destination. Then, what do everyone do when they arrive to their destinations?
They park cars in the parking lot.
Is there any good way to count the number of cars in the parking lot of Tokyo Disney Land?
…Yes, how about checking from the satellite?
It is not too much to say that we had been studying about satellite data for this!
We checked the satellite image of the parking lot of Tokyo Disney Land right away. As a side note, there is no multistory parking lot in Tokyo Disney Land.
(3)Checking the Parking Lot of Tokyo Disney Land From the Satellite
First, we check on the location of the parking lot of Tokyo Disney Land. It could easily be found from the official website.
https://www.tokyodisneyresort.jp/tdl/access/car.html
Now, we know that we can check on the location where it says “Guest Parking” in the website using the satellite image.
(This is off topic, but I sincerely wish that these information come out not just as an image but with location information.)
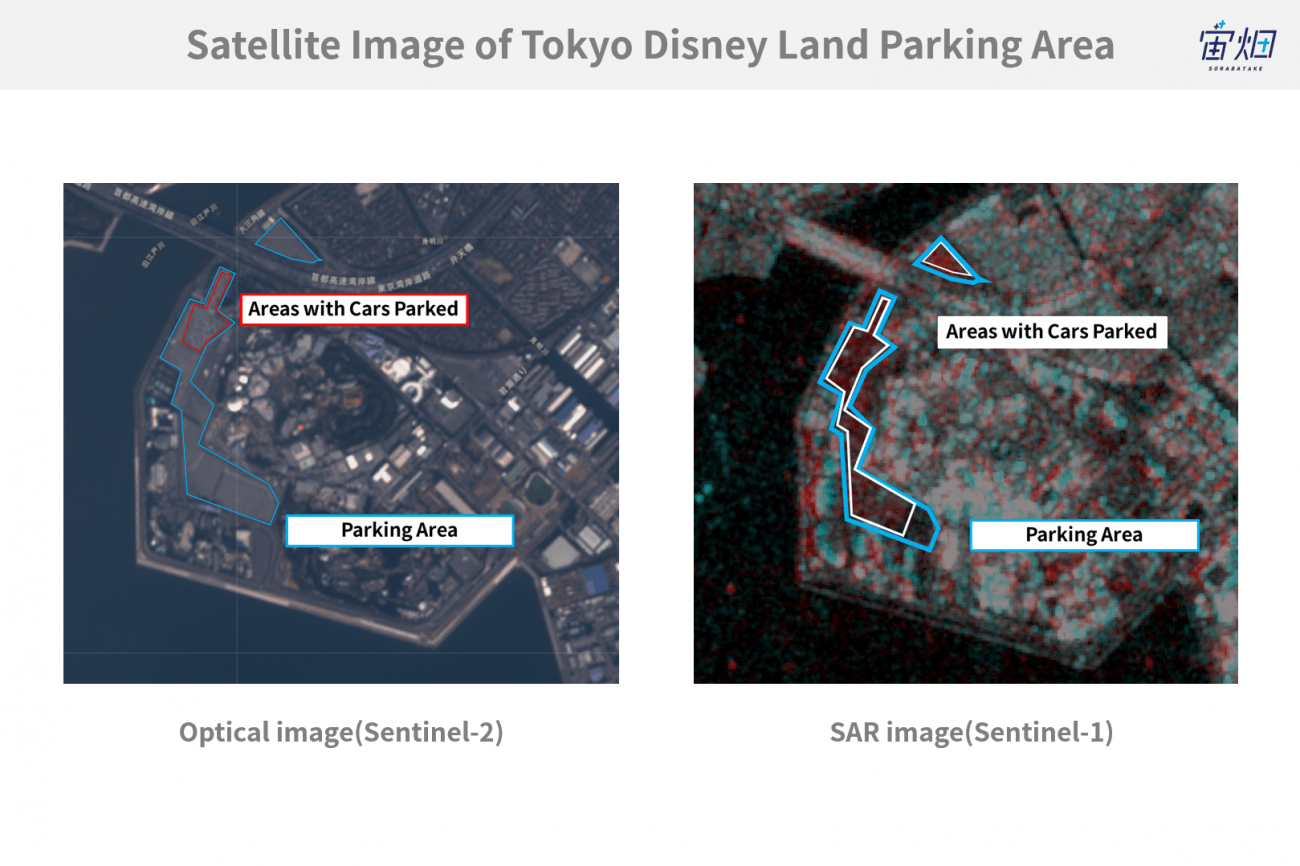
Checking the Parking Lot of Tokyo Disney Land Using Optical Image
There are many kinds of satellite image, but for now, we will check using the most typical “optical image” (an image like a photo).
Satellite called Sentinel-2 can be used without any cost, and has somewhat high resolution. It can be checked from
EO Browserwebsite.
This image below is taken last year.
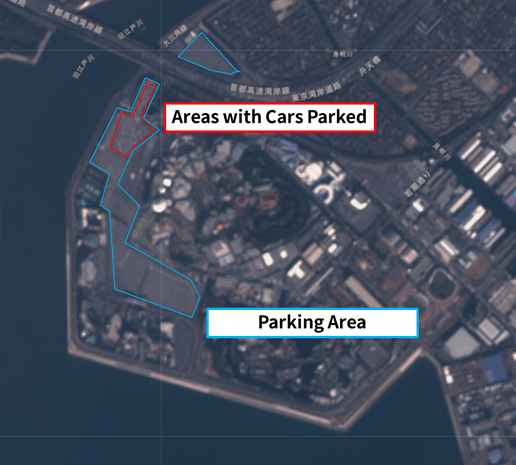
We can see the parking lot of Tokyo Disney Land.
We cannot catch the image of the cars one by one, but we can distinguish between vacant asphalt and parked areas where the asphalt in the picture seems to be reflected roughly compared to unparked areas.
However, there were many images that were obscured by a cloud. Therefore, we came to conclusion that it is difficult to check on the parking lot using only the optical image.
Checking the Parking Lot of Tokyo Disney Land Using SAR Image
What can be a big help when a image is obscured by a cloud?
Yes, it is SAR image.
It can observe regardless of clouds, for it observes using electromagnetic waves. However, the image is not so clear as optical image but rather grainy, so it is harder to interpret.
We checked the image of SAR satellite called Sentinel-1, which is another series of Sentinel-2. It is also open to the public on the EO Browser.
The actual image is below.
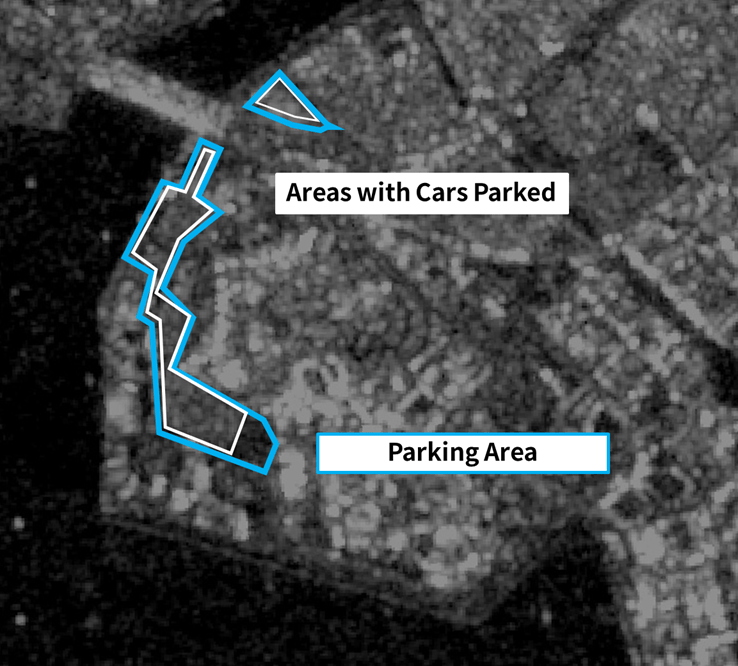
In SAR image, the vacant asphalt appears dark, and parked areas appears somewhat brighter by reflecting more backscattered radar pulse.
For comparison, we checked the image of the parking lot which assumed to be empty.
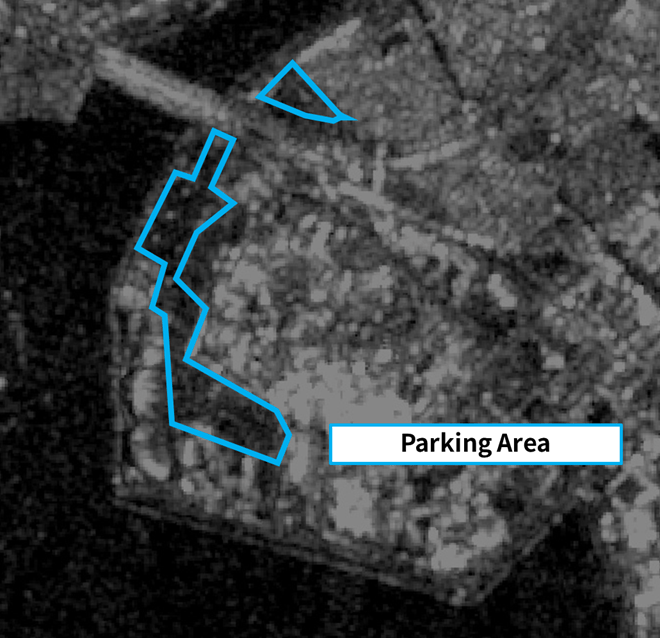
In this image, the whole parking lot appears dark.
From this, we found out that we can monitor the state of congestion of the parking lot using SAR image.
This is little off topic, but there is a point in our assuming that the parking lot is empty. We focused on the the time of the image taken.
This Sentinel-1 takes picture everywhere around the world at about 6 o’clock am and 6 o’clock pm. (For more information about Sentinel-1, click here)
We assumed that the image with parked cars is the picture taken around 6 pm, and the image with empty parking lot is the picture taken around 6 am.
*However, the official website does not clearly state the opening hours of the parking lot. Therefore, we could not assure that the parking lot was closed when the picture was taken at 6 am. In addition, there are some blogs that claims the parking lot opens around 5 or 6 am in regular weekdays, and opens earlier in high seasons. Still, we could say that the number of cars were much less compared to the picture taken at 6 pm.
(4)Monitoring Congestion Level of the Parking Lot Using Satellite Image Analysis
For further analysis, we chose to check on the SAR image that is not covered by clouds.
As we said in the previous chapter, SAR image appears roughly, so it is difficult to interpret by itself. We can see the difference by comparing an image with another.
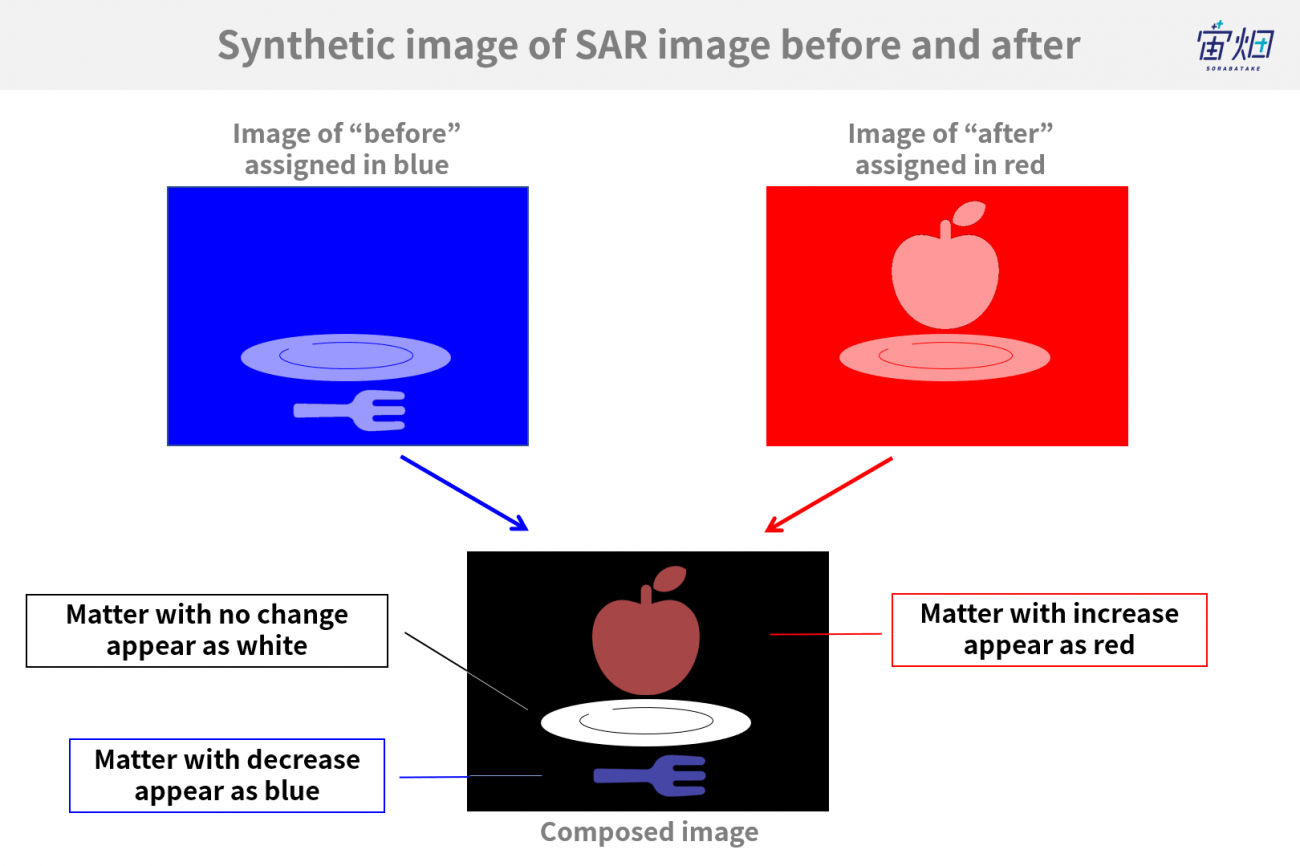
This image shows the basic rule of comparing before and after of the SAR image.
When synthesising the blue(=”before”) image and red(=“after”) image, the part which was only in either image stands out in either color.
In this example, apple was not in the “before” image, but it was in the “after” image. Therefore, it appears red after image synthesis. On the other hand, fork was in the “before” image, but it was not in the “after” image. Therefore, it appears blue after image synthesis. The plate which was in both image appears white after image synthesis.
By synthesising two different colored SAR images taken at different time of the day, we can find out the change during the time period.
Now, let’s take a look at the image of the parking lot of Tokyo Disney Land. This is a synthesised image of the parking lot without cars (=assigned to blue) and with parked cars (=assigned to red).
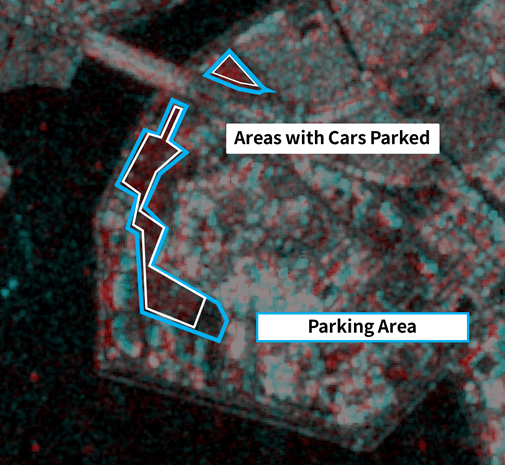
From this image, we can see that a part of parking lot appears red, which shows that there was increase in number of cars parked.
This time, the image we used for analysis is this;
・red:image of December 9, 2017 (Saturday) 6pm
・blue:image of November 9, 2017 (Thursday) 6am
It is obvious that there are many cars parked on the Saturday of December.
When synthesising the image of weekday of December, it looks like this;
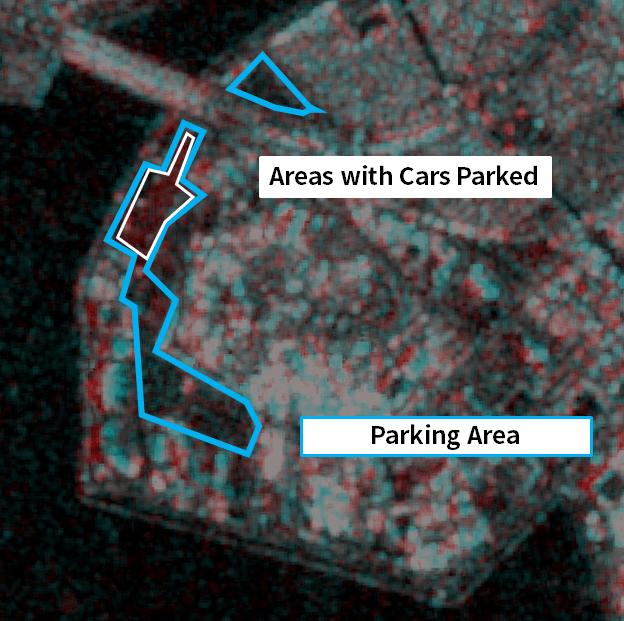
Compared to the image before, we can see that there are less parked cars in the image.
In this analysis, we used Google Earth Engine Code Editor. Anyone can check the code from the URL below. Please feel free to try it.
(Google account is needed for accessing)
https://code.earthengine.google.com/12b1c44790d510cc021403f343240f83
(5) Summary of the Analysis Part 1 and Preview for Next Analysis (or, Recruitment for Volunteers)
To summarize what we found out in this analysis,
● It is able to check the congestion level of the parking lot of Tokyo Disney Land using free satellite data
● It is able to use both optical image and SAR image
● There is information that the parking lot of Tokyo Disney Land may open earlier than usual in high seasons
● It is possible to make the change appear somewhat clearly by synthesising two SAR images
● Google Earth Engine works just fine though using heavy SAR image
In the next part of the analysis, we want to challenge next two things;
● Visualise the change among lapse of time
This time, we checked the congestion situation visually, using two images synthesised one at a time. However, this method would be too troublesome when synthesising two months worth images (60 images!).
We will need to make the image synthesise automatically, and visualize the increase of “red” area with time course.
● Find out the number of incoming and outgoing passengers of Maihama station
We would like to check the data of “Open Data Challenge for Public Transportation in Tokyo” which we applied, and see if they have daily data.
We seek for volunteers who would challenge the two analysis which we stated above.
If you are interested, please feel free to send messages to Sorabatake twitter, or e-mail to info@sorabatake.jp!
Anyone is welcome!