API Available in the Developing Environment of Tellus
Since API is now available on Tellus, we would like to introduce some functions of the Jupyter Notebook through vegetation analysis.
From February, the satellite data platform, Tellus, is compatible with Jupyter Notebook, a tool often used for Python data analysis.
Since API on Tellus is now available, we would like to introduce some functions of Jupyter Notebook using data.
*You need to sign up for Tellus to execute the content of this article. Please sign up here.
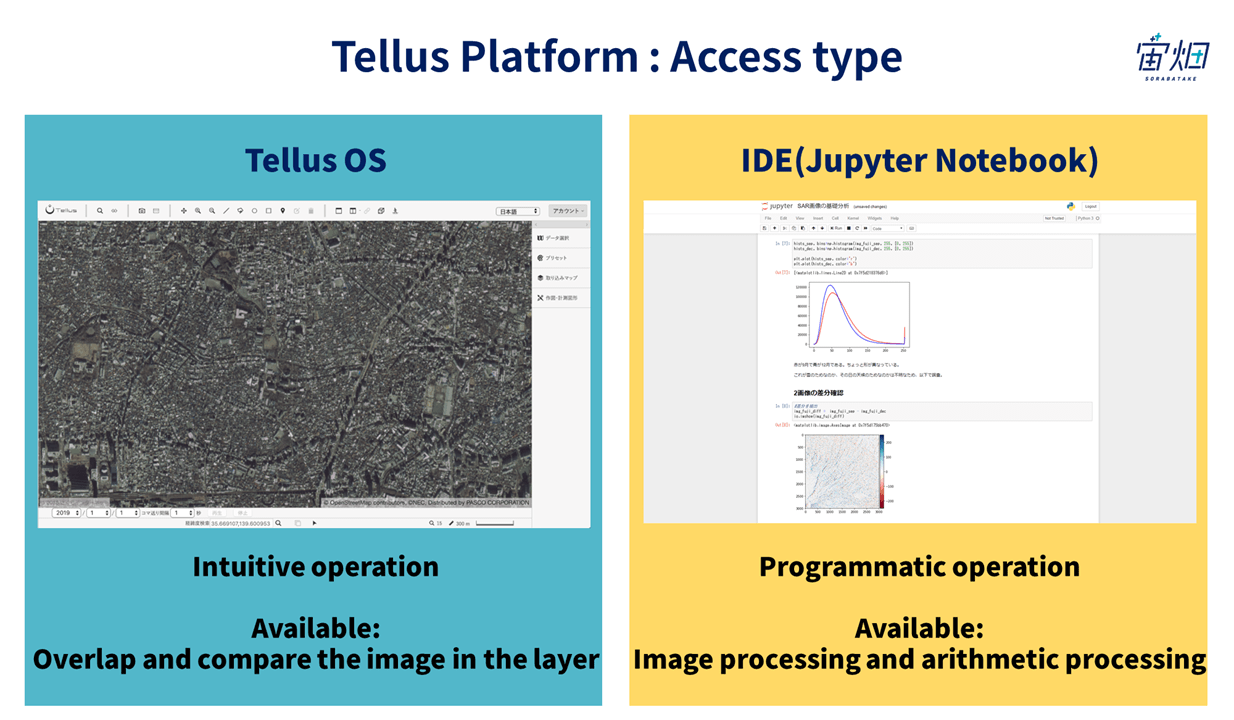
There are two major ways of accessing Tellus.
One is Tellus OS, which allows you to put multiple data on a map in a Web-browser. The other is a developing environment where programming is used for data analysis (hereafter called Jupyter Notebook).
In the developing environment of Tellus, various data and Jupyter Notebook are connected through API. You can use and analyze data using programmed API on Jupyter Notebook.
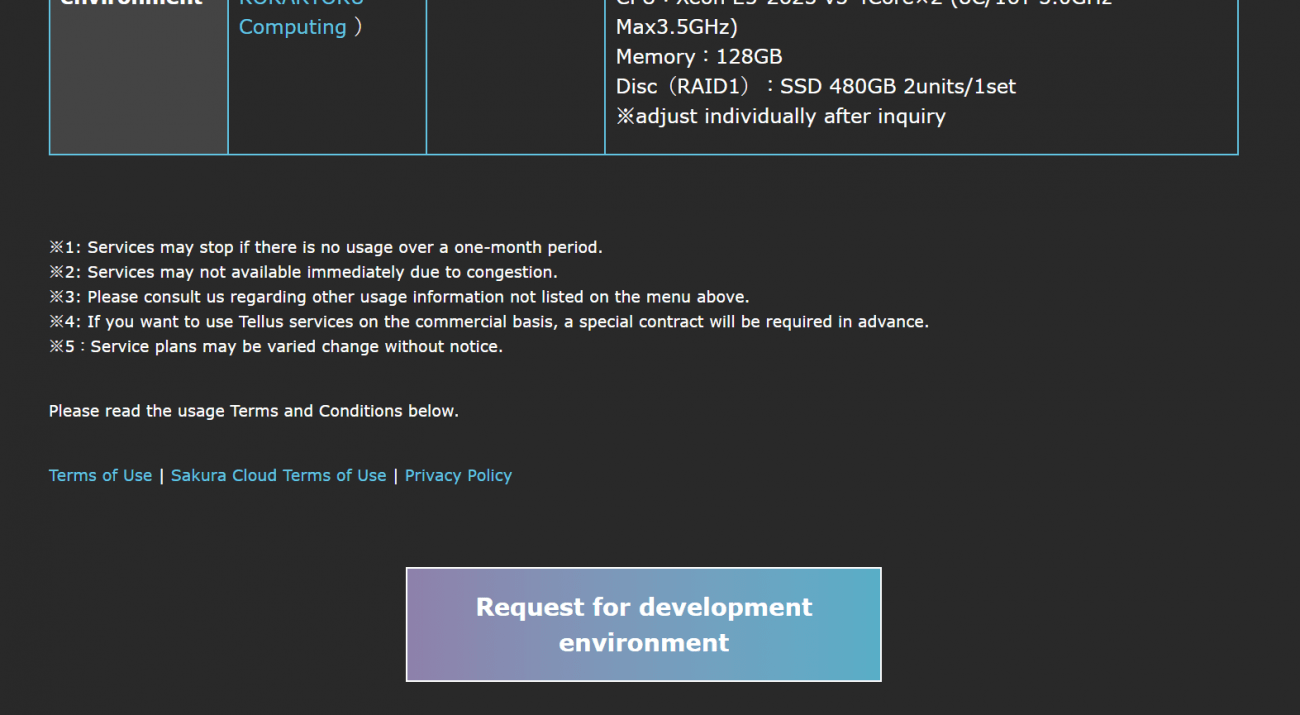
For reference, you can select either a dedicated server or a cloud for computing at the back end.
For large-scale computation, you might want to select a dedicated environment.
(1) Start Jupyter Notebook
Please refer to the following URL for setting up Jupyter Notebook on Tellus.
https://www.tellusxdp.com/ja/tutorial
First, sign up for Tellus.
Then, stay logged in and go to “the developer top page.”
Select “Development Environment Request” at the bottom of the service plan.
Select a plan on the entry form.
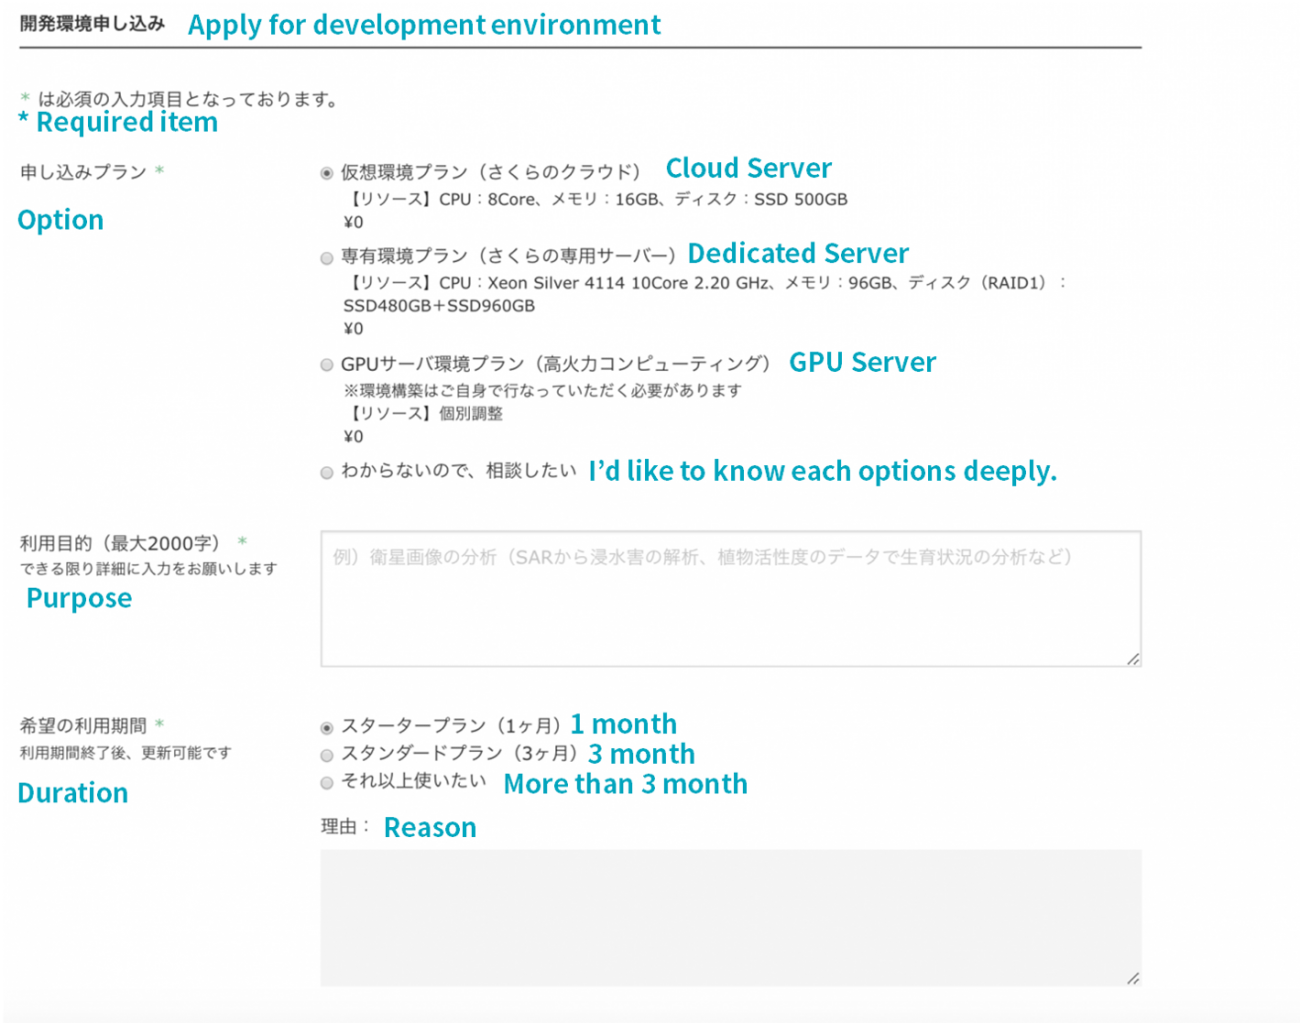
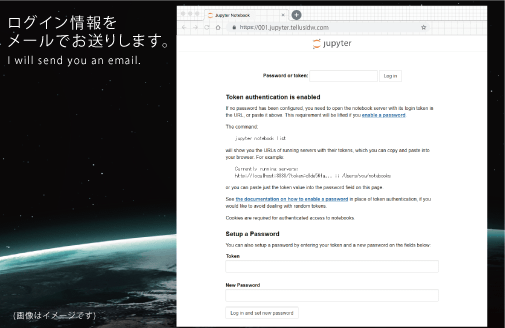
After that, the office will send you an email.
You will receive your login information for Jupyter Notebook. Set your initial password and log in to the development environment. Follow the explanation written in the email for logging on in the future.
Log on to Tellus OS whilst being logged on Jupyter Notebook and click the terminal icon located in the upper left. Click “Open Jupyter Notebook.”
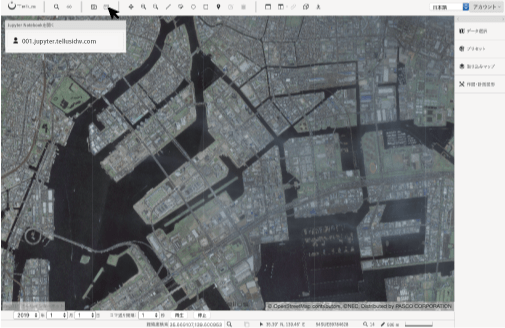
Then, Jupyter Notebook top page will appear.
(2) Look at the default directories on Jupyter Notebook
Logging on to the Jupyter Notebook environment, you will see some directories. Each directory is composed of the following elements:
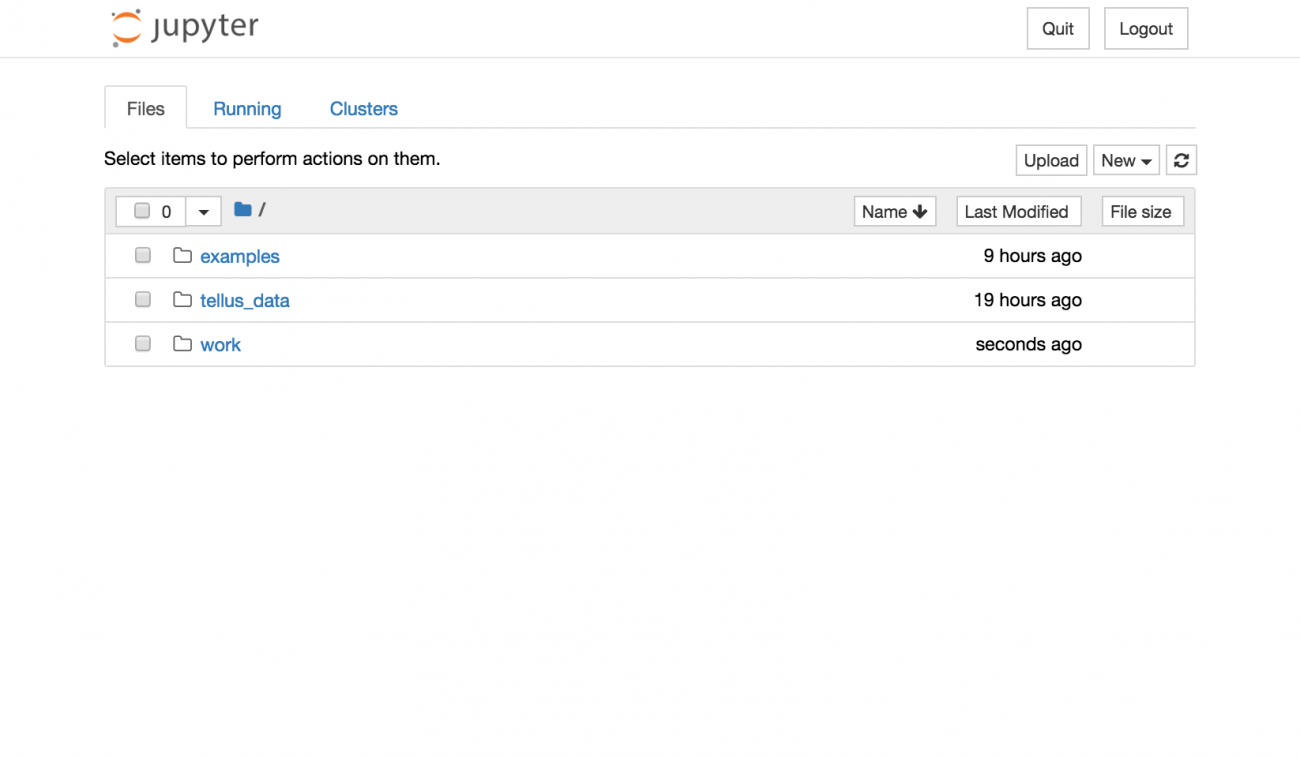
●/examples: It has a sample code that cannot be edited. You can use this code for vegetation analysis.
●/tellus_data: It is a directory that stores data sent from Tellus OS to Jupyter Notebook. This article explains how to send data from Tellus OS. Sent as a tiff as the data cannot be displayed in Jupyter Notebook preview for now.
●/work: It is a directory that you can create your own notebook. You can also import notebooks.
Since directories other than work are read-only, all the documents you newly create or update are saved under the work directory.
In addition to the pre-installed basic library, you can install additional libraries using pip and conda commands by opening Terminal in the New tab on the right.
*However, directories except for work, tellus_data, and their subordinates, may be reset when updated. Therefore, we recommend that you write down what you have got.
(3) How to analyze
Next, we will look at the usable satellite data on Tellus.
Data Catalog | Tellus
Optical image AVNIR-2, ASNARO1, and SAR image PALSAR-2 are all open at this moment.
However, since at this moment, AVNIR-2 is the only open API in Tellus, that enables wavelength analysis, we would like to use AVNIR-2 for simple analysis.
(4) Obtain images using API
Now we are going to obtain images using API. The following is the list of APIs to be updated.
API token validation is required for using API.
Get an API key on Mypage.
AVNIR-2 data is obtained from the optical sensor installed on the Advanced Land Observing Satellite Daichi (ALOS). A visible light image, just like what humans can see, can be created by synthesizing images within the blue, green, and red light wavelength bands.
The following article explains wavelength in detail.
What is light wavelength? Why can satellites see things not visible to the human eye?
You can actually use the sample used in the example, to follow each step from obtaining API to the analysis. To deepen your understanding, you may want to open the sample file while reading the following explanation.
When you open the examples directory, you will find the following composing elements. First, please make sure to read README.md. The notebooks directory contains sample codes for vegetation analysis. The data directory stores data used for this analysis.
README.md: It explains the overall composition of this sample.
/notebooks: Python codes for vegetation analysis are stored in the form of Jupyter Notebook.
To celebrate the beginning of the new Reiwa era, we would like to look at the vegetation around the Imperial Palace.
You can specify a location to retrieve data as follows:
# parameters
## domain of API
URL_DOMAIN = "gisapi.tellusxdp.com"
BEARER_TOKEN = "Set API Token"

## coordinate you want to see
Z = 13
X = 7276
Y = 3225

if BEARER_TOKEN == "":
    print("API token was NOT set")
def get_data(img_type, domain=URL_DOMAIN, z=Z, x=X, y=Y, query=""):
    if query != "":
        query = "?" + query

    # Authentication needs API token
    res = requests.get("https://{}/{}/{}/{}/{}.png{}".format(URL_DOMAIN, img_type, z, x, y, query),
                   headers={"Authorization": "Bearer " + BEARER_TOKEN})

    # load tellus data
    img = img_to_array(load_img(BytesIO(res.content)))
    return img.astype(np.uint8)

img_osm = get_data("osm")
img_band1= get_data("blend", query="r=3&g=2&b=1&rdepth=0&gdepth=0")
img_band2 = get_data("blend", query="r=3&g=2&b=1&bdepth=0&rdepth=0")
img_band3 = get_data("blend", query="r=3&g=2&b=1&gdepth=0&bdepth=0")
img_band4 = get_data("blend", query="r=4&g=4&b=4")
img_ndvi = get_data("blend", query="preset=ndvi")
(5) Start Analysis!
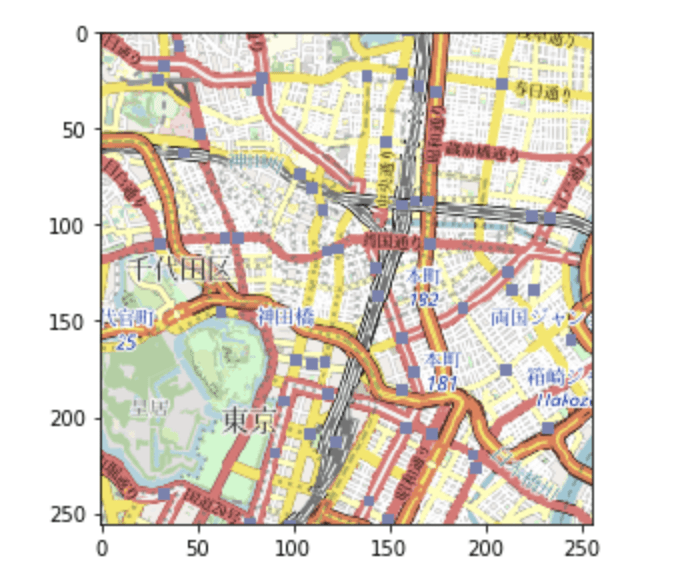
Confirmation of OpenStreetMap
Since it is difficult to determine the specified location only from satellite images, find locations on OpenStreetMap and use as a reference.
print(img_osm.shape)
io.imshow(img_osm)
Confirmation of AVNIR-2
Data of four different wavelengths can be used in AVNIR-2. Generally, Band 1, Band 2, Band 3, and Band 4 correspond to blue, green, red, and near-infrared wavelengths respectively. The individual wavelengths would appear like in the following image.
io.imshow(np.hstack((img_band1, img_band2, img_band3, img_band4)))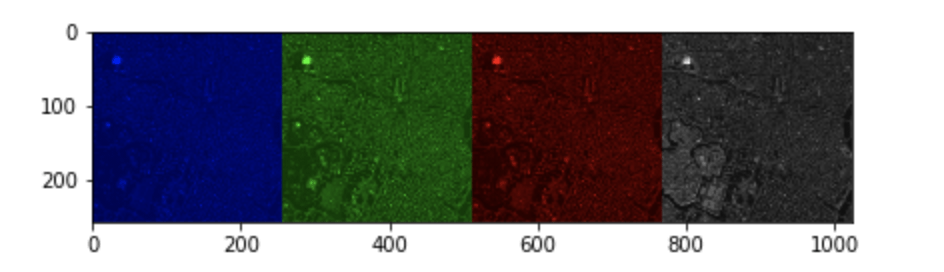
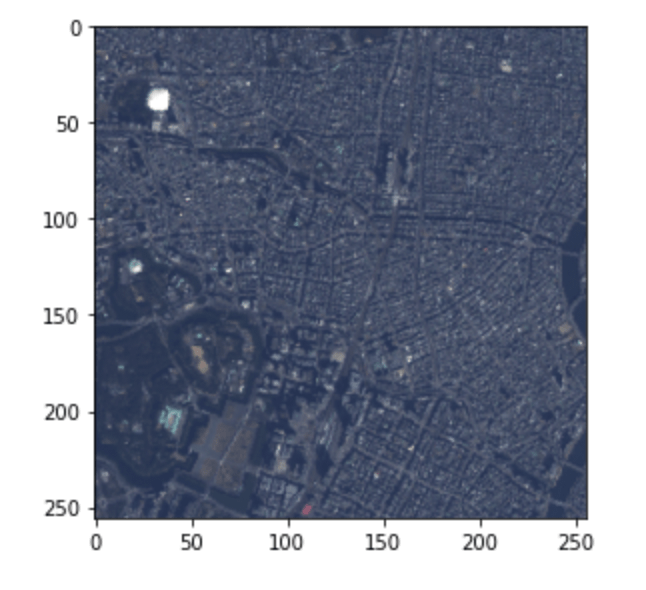
Since each image corresponds to blue, green, red (and near-infrared) visible light, the composite image of RGB (Red-green-blue) looks like what the human eye can see. This composite image is called true color image.
RGB composite of true color
●R: Band 3 (red)
●G: Band 2 (green)
●B: Band 1 (blue)
The following code is used to create the true color image.
img_true = np.c_[img_band3[:,:,0:1], img_band2[:,:,1:2], img_band1[:,:,2:3]]
io.imshow(img_true)
The following is the result of the code execution.
There are also other composite methods. For example, the natural color composite, in which plant distribution area is colored in green, is used when you want to emphasize regions of vegetation only. Utilizing the high reflection rate of near-infrared light, red color is assigned to the red wavelength (Band3), green color to the near-infrared wavelength (Band4), and blue color to the green wavelength (Band2).
RGB composite of natural color
●R: Band3 (red)
●G: Band4 (near-infrared)
●B: Band2 (green)
The following code is used to create the natural color image.
img_natural = np.c_[img_band3[:,:,0:1], img_band4[:,:,0:1], img_band2[:,:,1:2]]
io.imshow(img_natural)
The following is the result of the code execution.
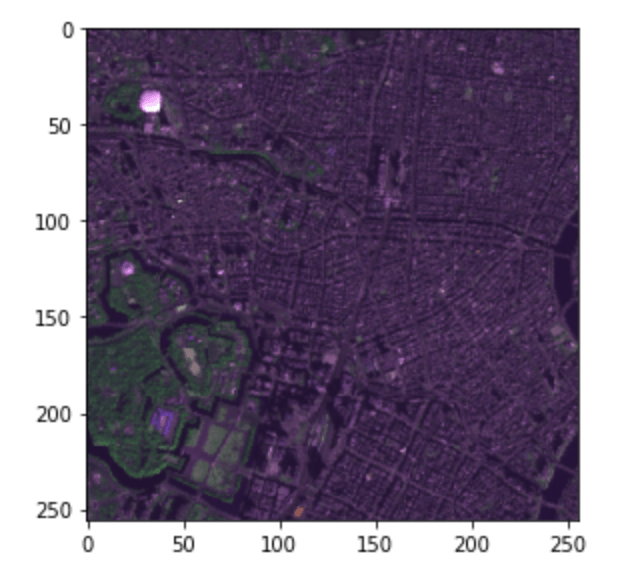
We can see that there are many plants around the Imperial Palace.
NDVI
You can observe the vegetation through using the Normalized Difference Vegetation Index (NDVI). NDVI is calculated using data difference between visible red (R, Band3) and near-infrared (IR, Band4) as in the following formula. The value would be normalized to the range [-1,1], where the higher value shows more vegetation.
????=??−???+?
io.imshow(img_ndvi)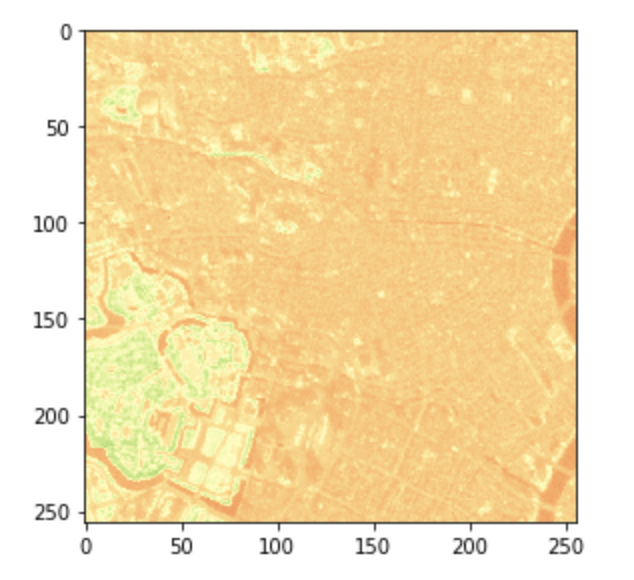
We can observe NDVI on Tellus OS with just one click.
We have used the newly released developing environment this time.
It seems that the libraries required for analysis are pre-installed. Also, you can install additional libraries of your choice.
Just sign up for Tellus, and you can easily obtain the environment for satellite data analysis. Why don’t you try the many functions on Tellus right now?
Sign up for Tellus from here.