TelluSAR is finally here! Thorough explanation of how to use the official analysis tool”TelluSAR (Teru-sa)” API!
TelluSAR, the official tool of Tellus Market has been released. It is a tool that uses satellite images from two different times to show ground surface subsidence and uplift on Earth. This article will explain how to use the tool, focusing especially on the API version.
What you can do with TelluSAR: What is InSAR?
TelluSAR, released as the official tool of Tellus Market.
A tool that uses satellite images from two different times to show subsidence and uplift of the ground.
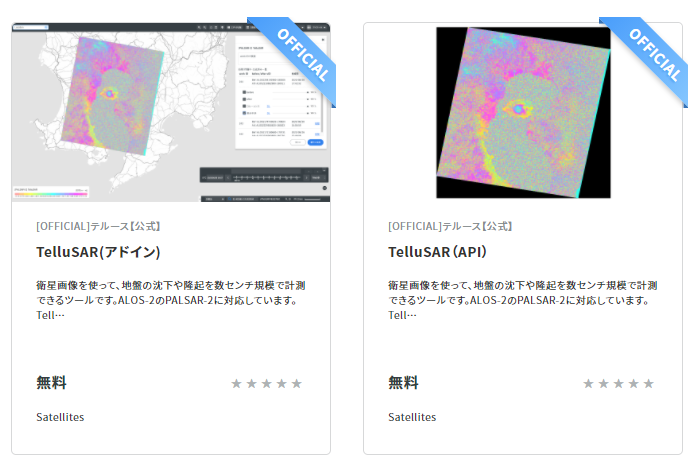
You can find two types of TelluSAR in Tellus Market.
The one labeled “add-in” is a tool that allows you to perform analysis by clicking buttons on Tellus OS, and the one labeled “API”, is a tool that performs analysis on a command line basis. Please select the appropriate one according to your purpose.
For “add-in” tools, you should be able to proceed with the analysis by just operating it on Tellus OS. So, this article will focus on how to use the API tool.
Here, we would like to briefly explain the principle of how TelluSAR can detect subsidence and uplift on Earth.
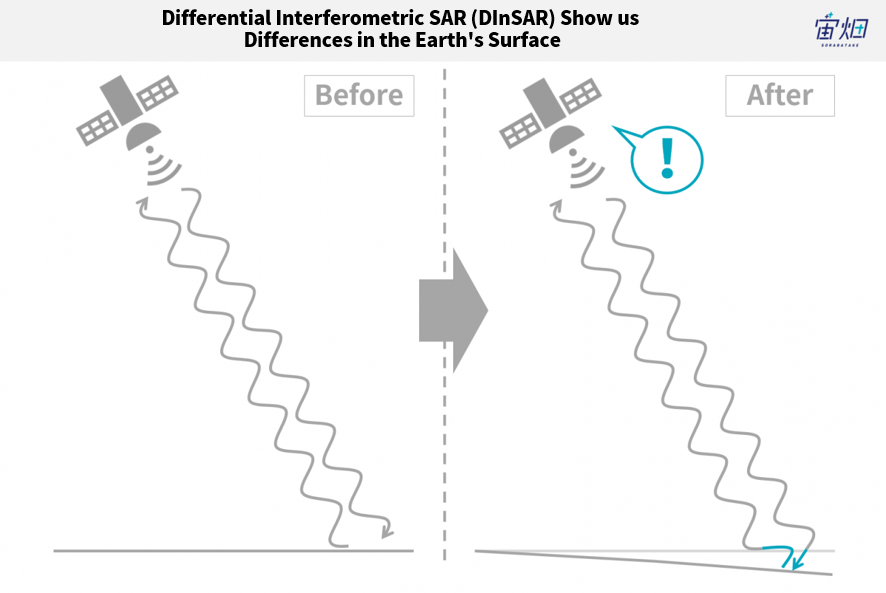
TelluSAR uses a technology called “InSAR.”
SAR is one of the sensors mounted on a satellite, that emits radio waves from the satellite and observes the radio waves bouncing back off a ground surface to determine its state.
As radio waves are literally waves, it is possible to detect subtle shifts in the waves by comparing SAR data from two different times (see above). This is the mechanism that allows you to detect subsidence and uplift of the ground surface.
If you would like to know more about this, please read the following article by Sorabatake.
Using the API version of TelluSAR
In this section, we will explain how to measure the subsidence and uplift of the ground from satellite images using the API version of TelluSAR.
The TelluSAR’s API reference for this project is available here:
https://www.tellusxdp.com/market/api_reference/522
Preparation
First, purchase TelluSAR (API) from the Tellus Market (for free).
To execute the Market Token API, an API Access Token is required.
API Access Tokens can be acquired in the Developing Environment part of the dashboard.
When you are ready, execute the Market Token API to use the API you purchased from the market.
import requests, datetime, json

TOKEN = '(ご自身で発行したトークンを入力してください)'
provider_id = 'tellus-product'
tool_label = 'tellusar-api-f'

# マーケットトークン有効期限(30分に設定)
# デフォルトでは5分、最長で60分まで設定可能
expires_at = (datetime.datetime.now(datetime.timezone(datetime.timedelta(hours=+9))) + datetime.timedelta(minutes=30)).isoformat()
def get_market_token(payload={}):
    url = 'https://sdk.tellusxdp.com/api/manager/v1/auth/api_access_token/token'
    headers = {
        'Authorization': 'Bearer ' + TOKEN
    }
    r = requests.post(url, headers=headers, data=json.dumps(payload))
    if r.status_code is not 200:
        raise ValueError('status error({}).'.format(r.status_code))
    return json.loads(r.content)

# マーケットトークンを発行する
ret = get_market_token({'provider_id': provider_id, 'tool_label': tool_label, 'expires_at':expires_at})
market_token = ret['token']
print(market_token)
This is all you need to prepare.
From here on, we’ll show you how to use the API.
Follow the three steps in order: scene search, processing of interference analysis, and acquisition of processing results.
TelluSAR's API: (1) Scene search
First, decide the scene you will be using.
You can check the list of available scenes with the reference API.
# 利用できるシーン一覧を取得する

def get_free_scene(market_token, payload={}):
    url = 'https://tellusar.tellusxdp.com/api/v1/search'
    headers = {
        'Authorization': 'Bearer ' + market_token
    }
    r = requests.get(url, headers=headers, params=payload)
    if r.status_code is not 200:
        print(r.status_code)
    return json.loads(r.content)

get_free_scene_result = get_free_scene(market_token, {})
print(get_free_scene_result['data']['scenes'])
When you run this code, you will see a large amount of information on available scenes.
As an example, we will use the crater scenes of Mt. Shinmoedake, where ground subsidence and uplift are easily recognizable.
You’ll need two scenes, one for “before” and the other for “after.”
The two scenes must be taken under the same conditions, including location, the orbit of the satellite, and the observation modes. Otherwise, it is impossible to observe any slight deviation of radio waves. Two scenes taken under the same conditions are called a “coherent pair.”
TelluSAR provides an API to find such pairs.
First of all, choose the first scene from the scene list. This time, we will use the following scene.
# 新燃岳(2018年3月6日)のシーンID
scene_id = 'ALOS2204710630-180308'
The next step is to find a coherent pair that corresponds to the acquired scene ID.
# ペアの候補となるシーン一覧を取得する
# after_scene_id

def get_scene_after(scene_id, market_token, payload={}):
    url = 'https://tellusar.tellusxdp.com/api/v1/search/{}/afters'.format(scene_id)
    headers = {
        'Authorization': 'Bearer ' + market_token
    }
    r = requests.get(url, headers=headers, params=payload)
    if r.status_code is not 200:
        print(r.status_code)
    return json.loads(r.content)

get_scene_after_result = get_scene_after(scene_id, market_token, {})
print(get_scene_after_result)
Response
{'data': {'scenes': [{'scene_id': 'ALOS2210920630-180419', 'observation_datetime': '2018-04-19T15:11:28+00:00', 'polarisations': ['HH'], 'left_bottom_lon': 130.537, 'left_bottom_lat': 31.62, 'right_top_lon': 131.26, 'right_top_lat': 32.325}, {'scene_id': 'ALOS2212990630-180503', 'observation_datetime': '2018-05-03T15:11:27+00:00', 'polarisations': ['HH'], 'left_bottom_lon': 130.538, 'left_bottom_lat': 31.62, 'right_top_lon': 131.261, 'right_top_lat': 32.325}, {'scene_id': 'ALOS2235760630-181004', 'observation_datetime': '2018-10-04T15:11:28+00:00', 'polarisations': ['HH', 'HV'], 'left_bottom_lon': 130.536, 'left_bottom_lat': 31.619, 'right_top_lon': 131.262, 'right_top_lat': 32.325}, {'scene_id': 'ALOS2254390630-190207', 'observation_datetime': '2019-02-07T15:11:30+00:00', 'polarisations': ['HH'], 'left_bottom_lon': 130.535, 'left_bottom_lat': 31.62, 'right_top_lon': 131.26, 'right_top_lat': 32.325}, {'scene_id': 'ALOS2268880630-190516', 'observation_datetime': '2019-05-16T15:11:27+00:00', 'polarisations': ['HH'], 'left_bottom_lon': 130.545, 'left_bottom_lat': 31.633, 'right_top_lon': 131.258, 'right_top_lat': 32.336}], 'next': None}}The value of the second scene_id is obtained.
One tip for getting a good result is to choose a scene that’s shooting date is not too far apart from that of the first scene (e.g. three months). If there is a time gap of a year or more, there is an increase in ground surface changes and the potential for ground surface conditions to change, which may both prevent two scenes from being coherent.
# 2枚目のscene_id
# 新燃岳(2018年4月19日)のシーンID
# ALOS2210920630-180419
Now we have obtained the two scenes’ information, we need to process.
TelluSAR's API: (2) Processing of interference analysis
Next, process the two scenes obtained in the previous step.
# 処理を実行する
# work_idが返却される

def request_work(market_token, payload={}):
    url = 'https://tellusar.tellusxdp.com/api/v1/works'
    headers = {
        'Authorization': 'Bearer ' + market_token
    }
    r = requests.post(url, headers=headers, params=payload)
    print(r.url)
    if r.status_code is not 200:
        print(r.status_code)
    return json.loads(r.content)

work_result = request_work(market_token, {
    'before_scene_id': 'ALOS2204710630-180308',
    'after_scene_id': 'ALOS2210920630-180419',
    'polarisation': 'HH',
    'nlook_rg': 5,
    'nlook_az': 7,
    'filter': 0,
})
print(work_result)
If the pair has already been processed by another user, the result will be displayed immediately (‘exist_flag’: True).
On the other hand, in the case in which the pair has not yet been analyzed, the results are not displayed immediately and work_id is returned because it takes time to process (30 minutes to several hours).
You can use the work_id to see the result when processing is completed.
TelluSAR's API: (3) Acquisition of processing result
Finally, see the processing result.
We set the work_id that was returned by the processing API earlier.
# work_idを指定して処理結果を取得する

def get_work(work_id, market_token, payload={}):
    url = 'https://tellusar.tellusxdp.com/api/v1/works/{}'.format(work_id)
    headers = {
        'Authorization': 'Bearer ' + market_token
    }
    r = requests.get(url, headers=headers, params=payload)
    print(r.url)
    if r.status_code is not 200:
        print(r.status_code)
    return json.loads(r.content)

work_id = work_result['data']['work_id']
get_work_result = get_work(work_id, market_token, {})
print(get_work_result)
Response
https://tellusar.tellusxdp.com/api/v1/works/224
{'data': {'work_id': 224, 'before_scene_id': 'ALOS2204710630-180308', 'after_scene_id': 'ALOS2210920630-180419', 'polarisation': 'HH', 'nlook_rg': 5, 'nlook_az': 7, 'filter': 0, 'progress_status': 2, 'request_date': '2020-10-28T12:25:48+00:00', 'complete_date': '2020-10-28T12:25:48+00:00'}}
You can also use the API to see a list of processing results, as shown below.
# 処理結果の一覧を取得する

def get_work_list(market_token, payload={}):
    url = 'https://tellusar.tellusxdp.com/api/v1/works'
    headers = {
        'Authorization': 'Bearer ' + market_token
    }
    r = requests.get(url, headers=headers, params=payload)
    print(r.url)
    if r.status_code is not 200:
        print(r.status_code)
    return json.loads(r.content)

get_work_result_list = get_work_list(market_token, {})
print(get_work_result_list)
Lastly, display the processing result in png format.
Please refer to the following article to learn how to obtain the z, x, and y specified values needed for the API request parameters.
[How to Use Tellus from Scratch] How do you get an image larger than a map tile? Four tips on handling map tiles
# 処理結果の差分干渉画像(png形式)を表示する

def get_finge_diff(work_id, z, x, y, market_token, payload={}):
    url = 'https://tellusar.tellusxdp.com/api/v1/works/{}/pngs/fringe_diffs/{}/{}/{}.png'.format(work_id, z, x, y)
    headers = {
        'Authorization': 'Bearer ' + market_token
    }
    r = requests.get(url, headers=headers, params=payload)
    print(r.url)
    if r.status_code is not 200:
        print(r.status_code)
    return io.imread(BytesIO(r.content))

# 新燃岳の座標を指定
z = 10
x = 884
y = 416

# 差分干渉画像を取得して表示
res = get_finge_diff(work_id, z, x, y, market_token, {})
io.imshow(res)
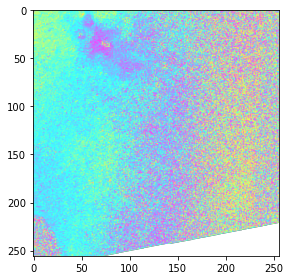
Looking at the result
We successfully uploaded the output colorful image, but at this point, it is hard to see where the uplift and subsidence of the ground have occurred.
We will explain how to interpret this colorful image.
Following is a brief explanation. For more details, please read the TelluSAR user guide.
STEP 0: Check the observation conditions of the image
Check the conditions under which the image you selected was observed.
For example, referring to a previous article, you can output detailed information about the relevant image by using the date and time of observation and frame number.
import requests
from pprint import pprint


def search_file(params={}, next_url=''):
    if len(next_url) > 0:
        url = next_url
    else:
        url = 'https://file.tellusxdp.com/api/v1/origin/search/palsar2-l11'

    headers = {
        'Authorization': 'Bearer ' + TOKEN
    }

    r = requests.get(url, params=params, headers=headers)
    if not r.status_code == requests.codes.ok:
        r.raise_for_status()
    return r.json()

ret = search_file({'after': '2018-03-08T00:00:00','before': '2018-03-08T23:59:59','frame_number': '0630'})

pprint(ret['count'])
pprint(ret['items'])
As a result, you will obtain the following.
[{'bbox': [130.536, 31.62, 131.261, 32.325],
'beam_number': 'U2-6',
'begin_datetime': '2018-03-08T15:11:25.036000+00:00',
'center_datetime': '2018-03-08T15:11:30.036000+00:00',
'code': 'UBS',
'coordinates': [[130.674, 31.62],
[131.261, 31.714],
[131.128, 32.325],
[130.536, 32.231]],
'dataset_id': 'ALOS2204710630-180308',
'date_added': '2019-12-18T09:34:25.186298',
'end_datetime': '2018-03-08T15:11:35.036000+00:00',
'files': ['1', '2', '3', '4', '5', '6'],
'frame_number': 630,
'mode': 'SM1',
'observation_datetime': '2018-03-08T15:11:30.036000+00:00',
'observation_direction': 'R',
'off_nadir_angle': 29.5,
'orbit_direction': 'A',
'path_number': 130,
'polarisations': ['HH'],
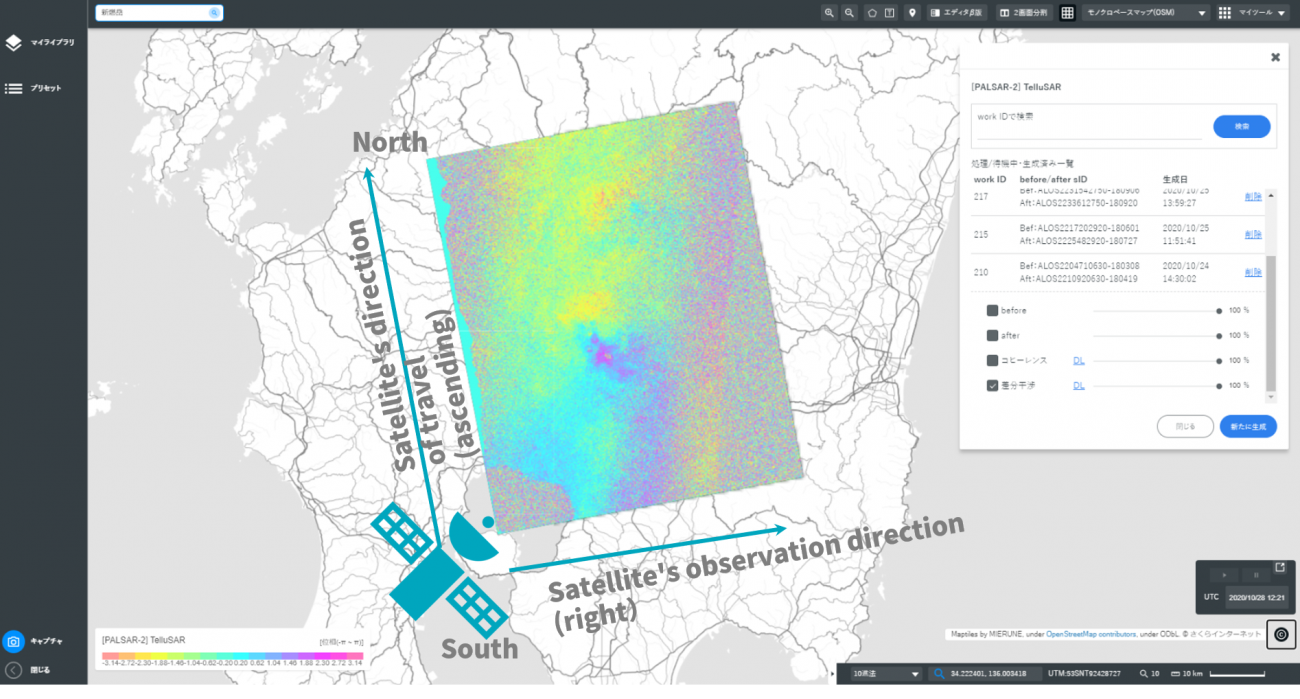
'publish_link': 'https://file.tellusxdp.com/api/v1/origin/publish/palsar2-l11/ALOS2204710630-180308'}]STEP 1: Identify the side the satellite was flying on
The first thing to check is where the satellite was flying.
SAR satellites always capture images at an angle due to their observation method.
To find out whether the image was taken from the right or the left, look at the “observation_direction” in the output details.
“R” indicates the right direction, and the “L” indicates the left.
In terms of “orbit_direction,” “D” means “descending orbit,” and “A” means “ascending orbit.”
In this case, the satellite was on “ascending orbit” observing “right direction.”
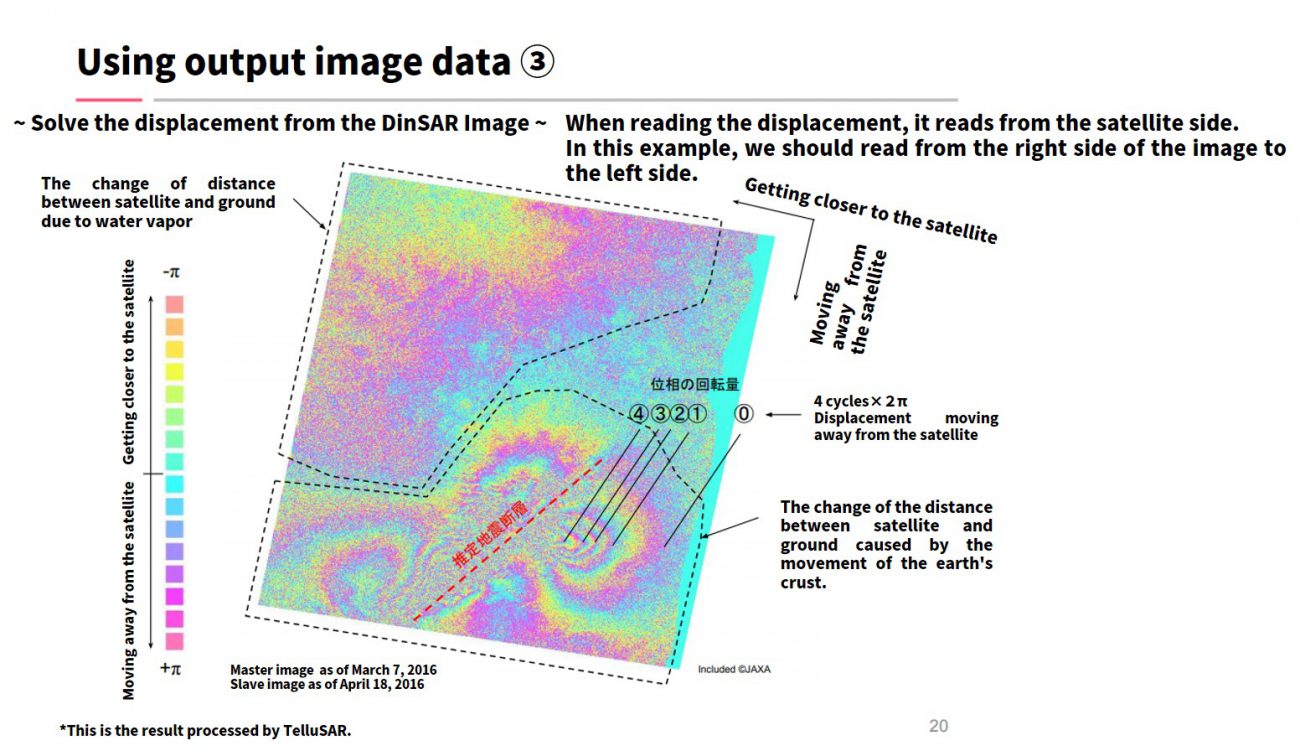
That is, the positional relationship is as shown in the following figure.
The satellite was passing west of Mt. Shinmoedake from south to north.
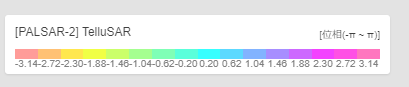
The color indicates the degree of change between “before” and “after.”
It is expressed as “-π to π” to represent the deviation of the two waves.
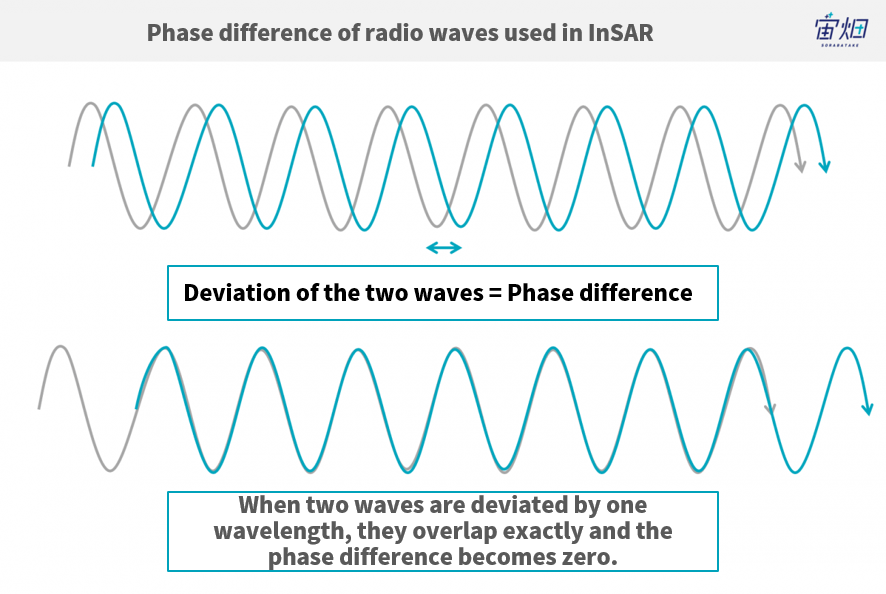
If the two waves are exactly the same without deviation, the phase difference is zero, and if they are deviated by half a wavelength, it is π. If they are deviated by another half, they overlap exactly again and the phase difference becomes zero.
Therefore, you have to count the number of waves from the side the satellite was flying and consider the final displacement.
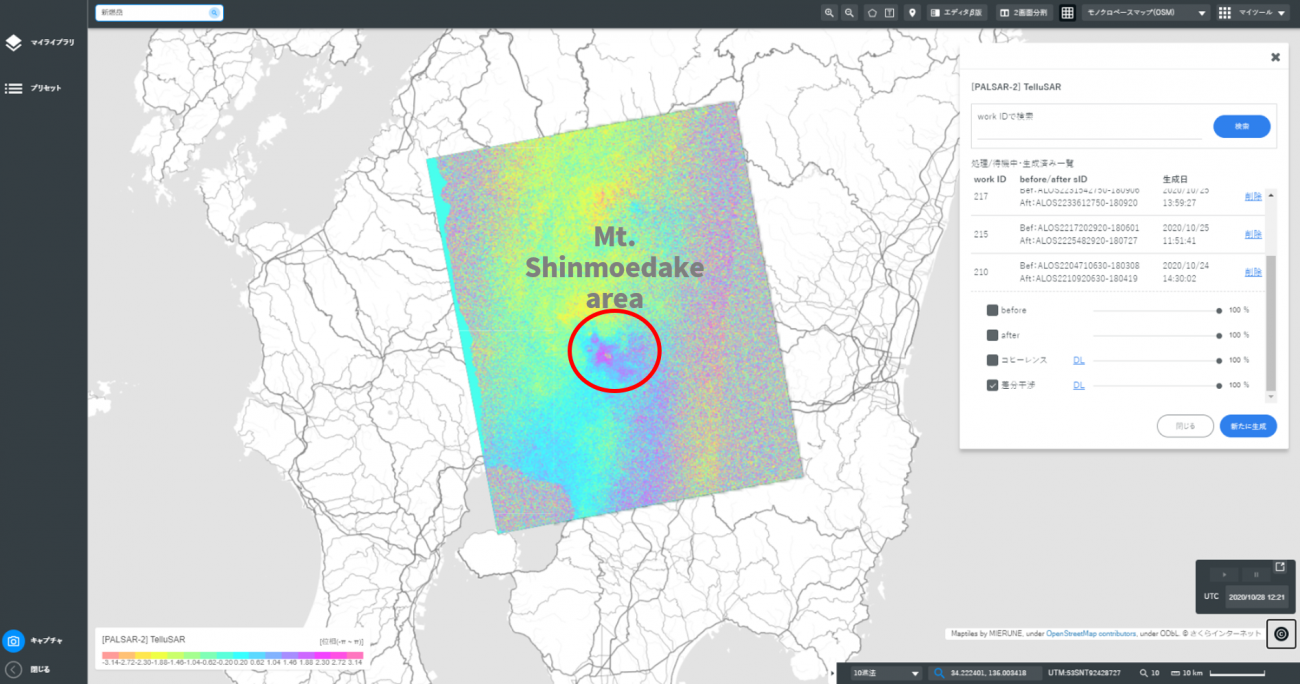
In this case, the colors have changed over a wide area, which seems to be the effect of the disturbance.
The area around the summit of Mt. Shinmoedake is colored in pink, which indicates that, according to the explanatory notes, the phase has changed by about half of 3.14=π (0.5π).
Its orientation, as we confirmed earlier, is read from the west (left on the screen). The color is changing from blue to pink in a positive direction, which suggests that the distance between the satellite and the ground is getting larger. That is, subsidence is occurring.
However, in this case, the change may be due to water vapor because a similar phase change is seen when tectonic activity occurs (this is one of the hardest parts of the deciphering process).
In this case, an explosive eruption occurred at Mt. Shinmoedake in the Kirishima mountain range in Kyushu at around 2:27 p.m. on March 6, 2018, and the image was taken immediately after the eruption.
Explosive Eruption Occurred at Mt. Shinmoedake in the Kirishima Mountain Range (March 6, 2018)
https://www.jma-net.go.jp/sat/himawari/obsimg/image_volc.html#obs_j20180306
Summary
In this article, we introduced TelluSAR, the first official analysis tool from Tellus.
Although we have introduced InSAR before, some of you may have found it difficult to perform SAR analysis by yourselves. But this tool will allow you to do so easily.
Give it a try.
https://www.tellusxdp.com/market/tool_detail/tellus-product/288