【Now available at our Tellus Market!】It’s now possible to sell tools on Tellus! Increased browsing speed and new functions available on update.
The ability to sell tools has been introduced to the Tellus Market, which has only had free tools up until now. Browsing speeds are also faster than ever before, and it is far easier to compare and search for data thanks to our latest update. Now's the perfect chance to try out Tellus for those users who want to browse satellite data, or sell their very own tool on our platform.
Tellus introduced the ability to sell tools on the platform on December 23rd, 2020. This allows companies to sell their data and algorithms for a profit at the Tellus Market. This allows companies to sell their data and algorithms on Tellus Market for a profit.
In this article, we’ll take a look at the new functions available on Tellus, including the ability to buy and sell tools made available by the latest update.
1. About Tellus
Tellus is a Japanese open and free platform that allows users to analyze satellite data on the cloud with the aim of creating new businesses for the industry.
Tellus offers not only satellite data, but information on the movement of people and climate data, and promotes the cross-referencing of such data to create new business models.
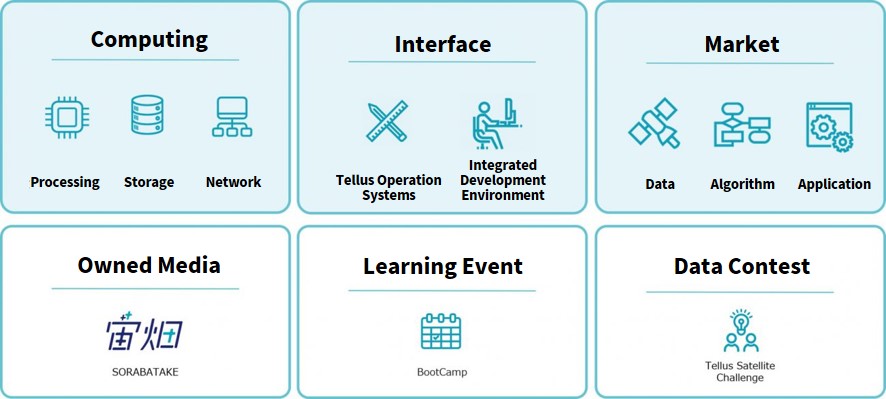
Tellus currently has 6 different functions available with the aim to promote new business ideas.
Since our launch in February 2019, we have over 19,000 registered customers at the end of 2020.
You can view up-to-date data collection here on Tellus.
What you can do on Japan’s First Satellite Data Platform “Tellus”
[Tellus Ver.2.0 Released] The Redesigned Website, Improvement of the UI of the OS, Newly Opened Market
There were two main things that were updated.
The following two functions have been updated on Tellus.
(1) Tellus Market, introduced back in Feb. 2020, now acts as a platform to buy and sell tools
(2) An update to Tellus’ UI/UX
This article will dive into the details of these two new updates!
2. We now offer Pay-to-Use tools!
We started Tellus Market in February of 2020 with an arsenal of free-to-use tools available.
In December, we finally implemented the ability to buy and sell tools on our platform.
We plan on adding many more free and pay-to-use tools in the future, so be sure to check out Tellus Market for updates!
*The timing with which we implement tools may vary.
We’ll introduce the following tools and ways we imagine they can be of use.
- Solar Radiation Data: pay-to-use/Meteorological Engineering Center
The Meteorological Engineering Center created a tool for measuring solar radiation data.
It is an API that uses satellite data to estimate and predict solar radiation.
We’ve introduced an example of the company’s predictions using this API in the Sorabatake article below.
The article describes how one can use solar radiation data to predict things such as solar power generation, to place warnings on areas with extremely high levels of sun, and so even know when to hang out laundry!
- Disaster Prevention Information: Paid/Gehirn Inc.
Gehirn Web Services provides an online infrastructure with its mission to make Japan safer. Gehirn Inc. even provides a security alert system for corporations using an API that gives 10 minute updates on possible earthquakes around Japan.
This data could be used to figure out where to sell and allocate emergency kits to places afflicted by more frequent earthquakes.
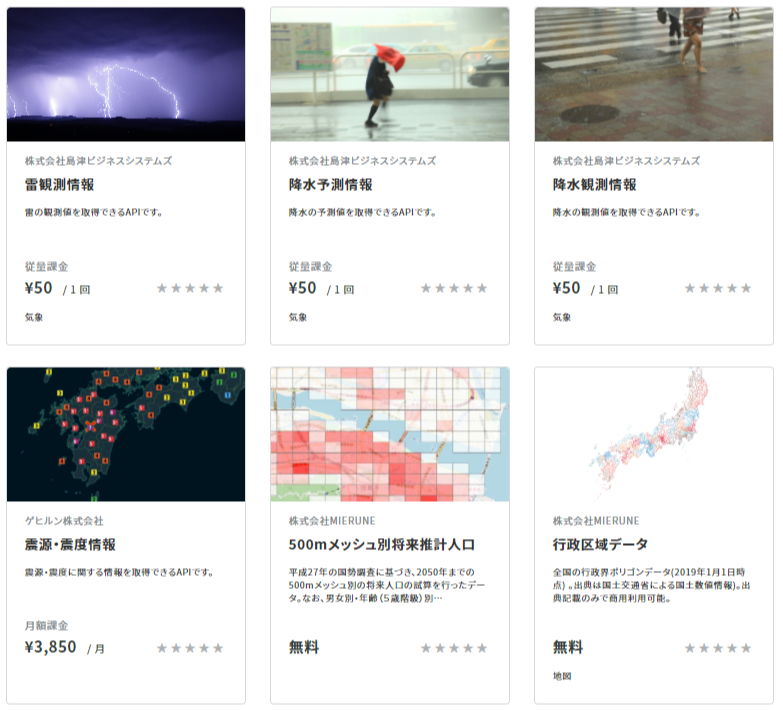
- Lightning Observation Data (pay-to-use version): Pay-to-Use/Shimadzu Business Systems Corporation
Shimazu Business Systems Corporation already has a free version of their Lightning Observation System available on Tellus, but that data is limited to Typhoon No. 15 which happened between the 9th and 10th of September in 2019.
The pay-to-use version will have data spanning all the way back to November 11th, 2012, allowing the user to access data from where and whenever they want.
This could prove useful to factories and other facilities that are susceptible to lightning strikes, allowing them to find spots in Japan with fewer thunderstorms.
Using Lightning Observation Data for Free! Learning About the Science Behind Different Types of Lightning
- Precipitation Forecast Data (pay-to-use version): Pay-to-Use/Shimazu Business Systems Corporation
A segment of this precipitation forecast data is already available for free on Tellus. Currently, it offers measured rainfall and predictions for up to 3 hours in advance, but the pay-to-use version offers an upgrade to up to 6 hours in advance.
Knowing up to 6 hours in advance could be the basis for an app that lets you know whether you should take an umbrella with you when you leave home.
- Precipitation Observation Data (pay-to-use version): Pay-to-Use/Shimazu Business Systems Corporation
Shimazu Business Systems also has data on precipitation observation data available for free, though, like their lightning data, it’s limited to Typhoon No. 15 on the 9th and 10th of September in 2019.
Cross-referencing precipitation observation data and data already available on Tellus on the movement of people, (Population Statistical Data|Mobile Space Data and Position Data|Profile Passport) makes it possible to see how rain affects where people choose to go and could have an impact on deciding where to allocate taxis during rainfall.
・500m mesh population estimation: Free/MIERUNE Inc.
Using the national census from 2015, MIERUNE Inc. created an API that predicts by 2050, where, in 500-meter segments, people will be living in the Kanto region.
They have data on age available as well, making it possible to focus on specific age groups for target marketing.
This could be useful for finding areas with an older population to create a nursing home, or for building schools in areas seeing an increase in children.
- Administrative Area Data: Free/MIERUNE Inc.
We’ve also added polygon data from the government throughout Japan created by the Ministry of Land, Infrastructure, Transport and Tourism. This data includes the prefecture name, the political code, the name for each town and city, the name of the capital, government facilities, and the structure of the government of that prefecture.
You could take this data and plot out a map where all the nursery elementary schools are for a specific prefecture to see what school services are lacking in which areas.
- Empty Parking Space Detection: Free/Official Tellus Tool
The final tool we will introduce is one of our own, an official Tellus algorithm.
Using satellite data, we’ve created an algorithm for detecting empty parking spots using machine learning.
We introduced how this tool works at the Tellus SPACE xData Fes Event we held back in the summer of 2020. You can read more about that event in the article below.
Automatic Detection of Parking-Lot Space With Satellite Data Challenges and Points of Improvement for the Joint Project by Sakura Internet, akippa, and Ridge-i
The tools we have introduced in this article are all available at Tellus Market, so if you're interested in any of them, make sure to take a visit.
3. Our Customers' Reviews and their Impact on our Latest Update!
We’ve taken into consideration reviews we’ve received from our users about Tellus OS’ UI and UX, so we’ve made improvement to over thirty spots. The updates are listed up in detail on Tellus’s official notice page, so please go there for more details.
Tellus Official Notice Page
Now we’d like to share some the main updates as selected by the Sorabatake editorial department.
The site loads faster now!
After Tellus’ UI received an overhaul, we got some feedback that some of 2.0’s new features were causing lag on our website. We’ve fixed that problem with our newest update.
It shouldn’t cause as much of a lag now when using two features at once, or two screens to look through data.
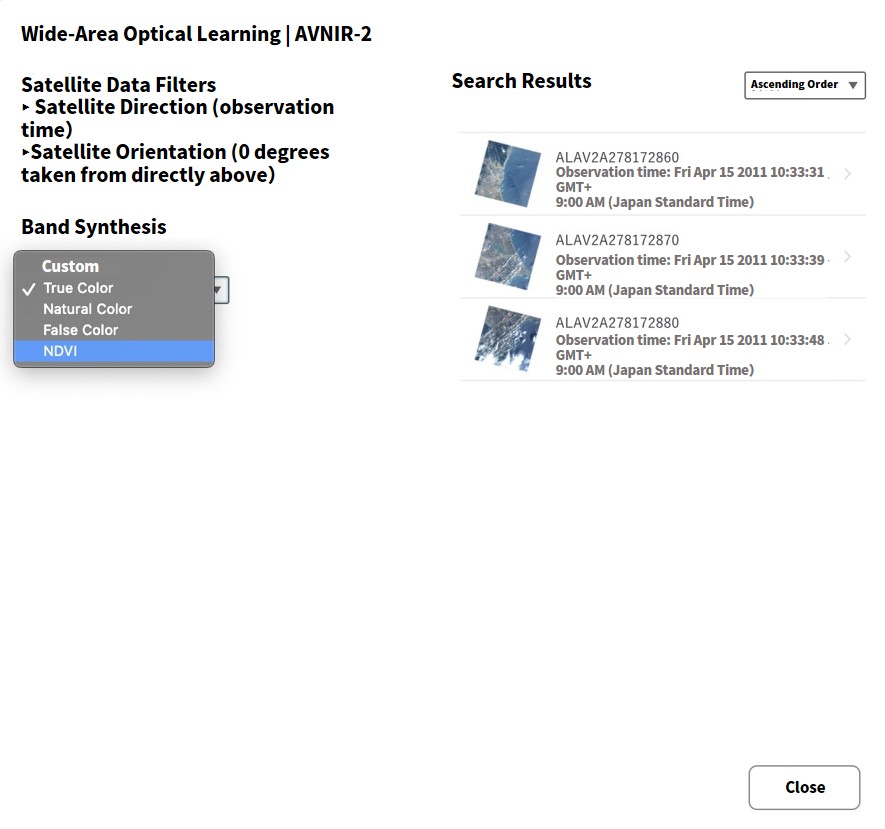
The custom presets for band Synthesis have been made simpler!
We’ve added a preset NDVI (the vegetation index) to synthesize bands automatically, while leaving the original method of selecting RGB up to you as a custom option. (This applies to AVNIR-2 data only)
NDVI is an index that allows you to see activity in vegetation. It is commonly used when analyzing satellite data. It was always possible to synthesize the bands using the development environment, but now you can access this data directly on Tellus OS.
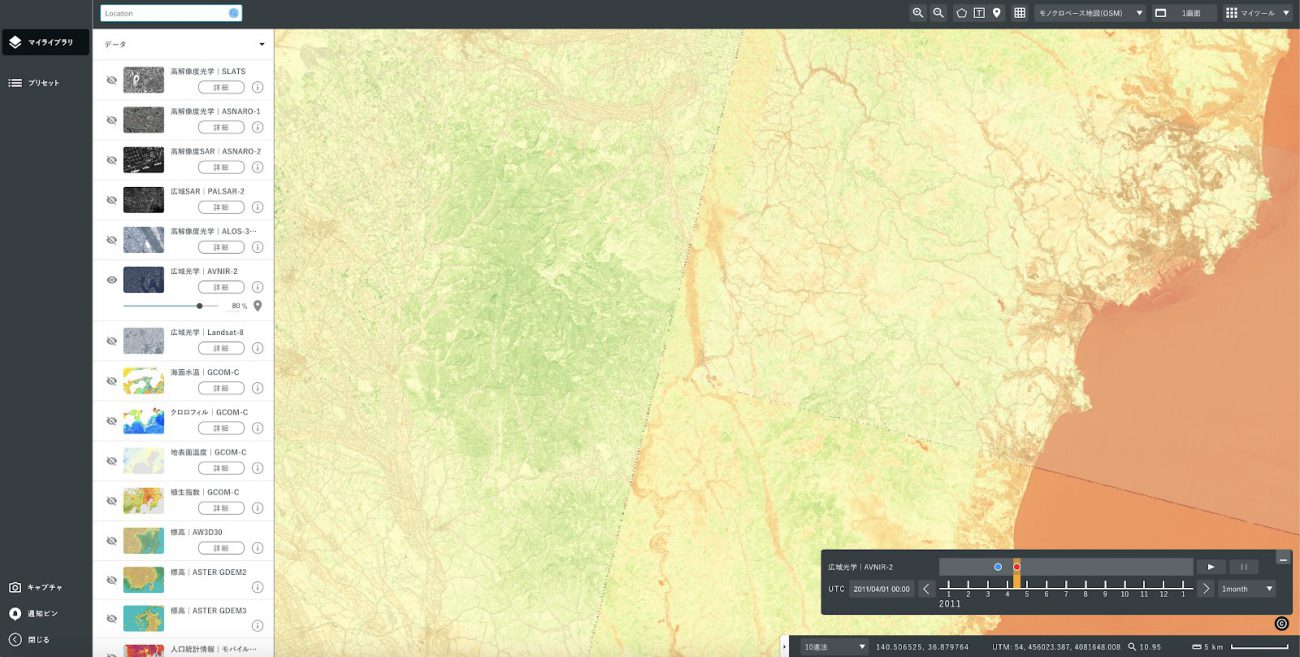
The UI Time Scale Panel has Been Made Simpler
In order to change the order of the data being shown when showing complicated data, you used to have to click the mark next to the thumbnail and stop displaying the data, then re-display it in the order you wanted it to be seen.
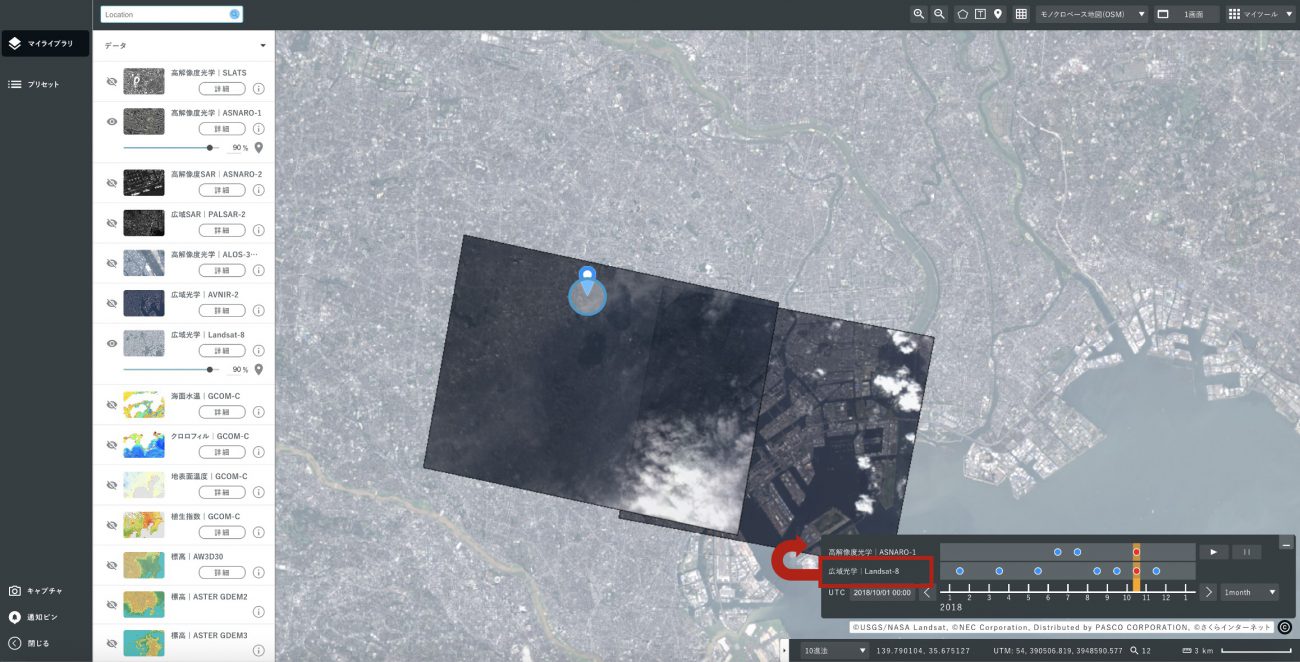
Now you can drag and drop the data on the timeline bar in the new time scale panel to make it display above or below other data.
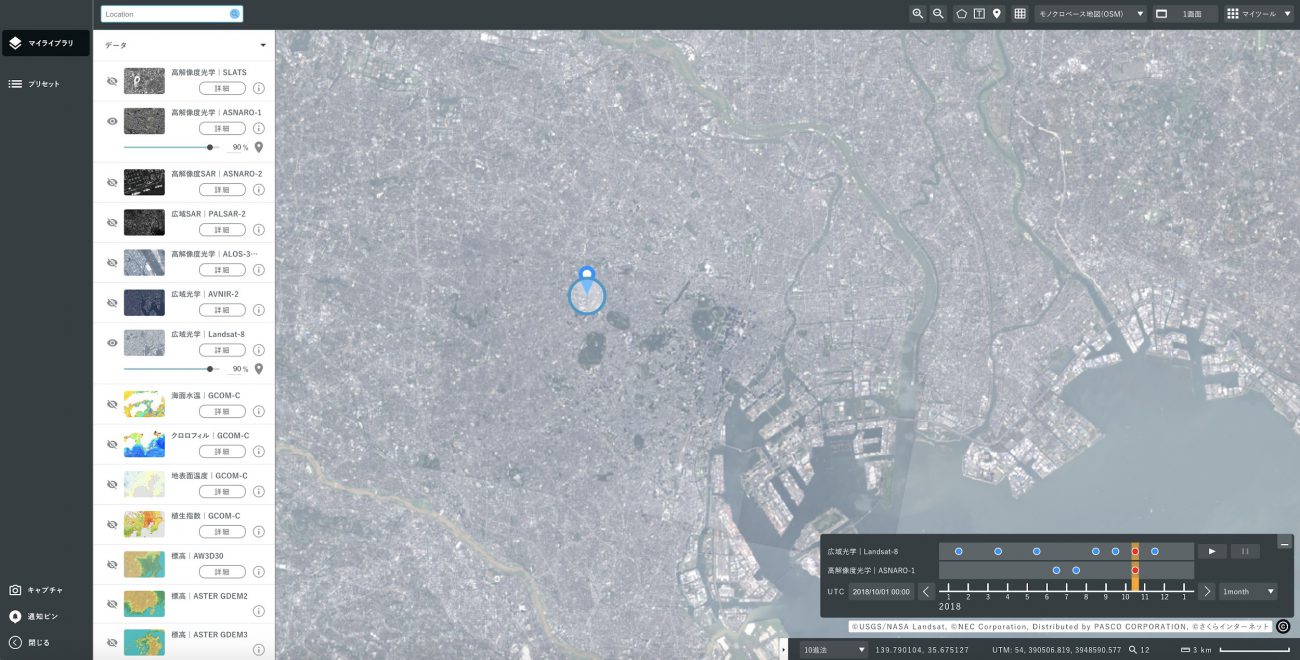
In addition to this, you can also change the specified time by clicking the tick marks inside the timeline bar and at the bottom of the timeline bar, as well as move the tick marks one by one by pressing ” > “and” < ” .
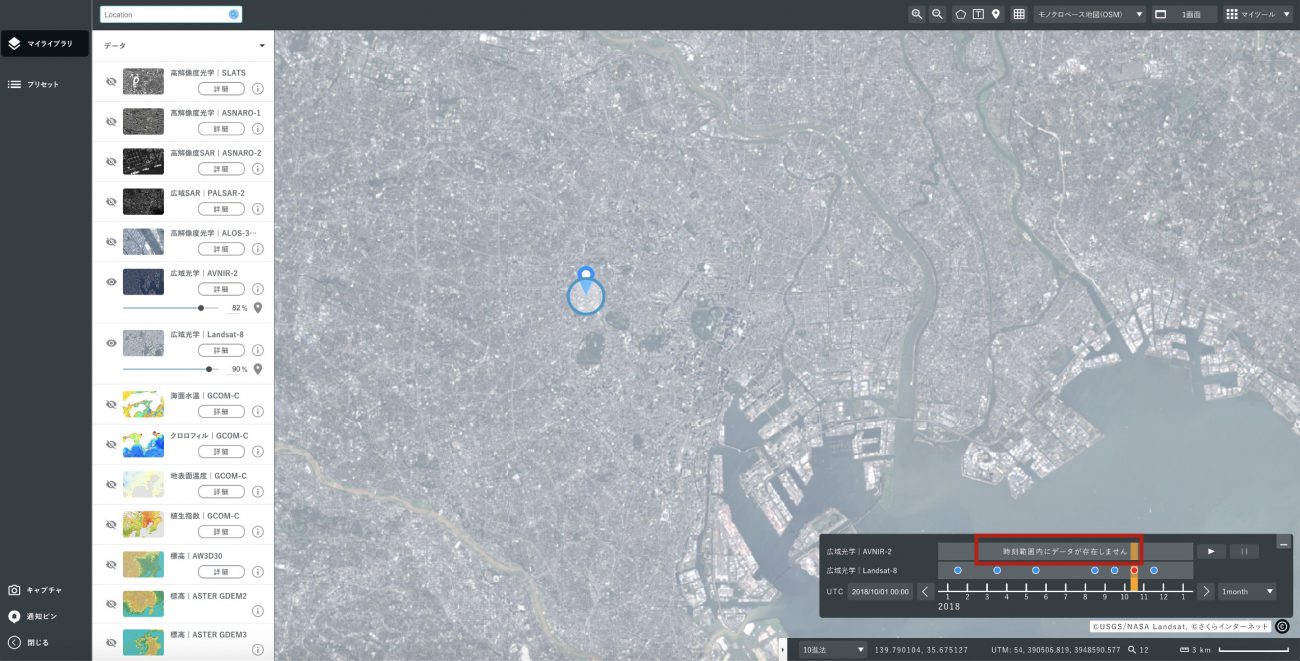
Furthermore, when there is no relevant data available, a message will pop up inside the timeline bar, making it easier to know when an error is occurring.
4. Summary
With the improvements to its UI/UX, Tellus is finally ready to be used as a platform for business. It’s a great place, not only for buying tools and API, but for making your own to sell to others.
For those of you who have used Tellus before, we’ve done a lot of smaller updates as well, making the user experience much better!
There are more tools than the ones we’ve described in this article, and many more to come. Be sure to check Tellus directly for the latest updates!