What is the Wavelength of Light? Why Can Satellites See Things which are Invisible to the Human Eye?
Having knowledge of wavelengths is essential for analyzing satellite data. What can be examined at different wavelengths? Let's compare the differences in satellite images based on wavelengths.
At Sorabatake, we have introduced various artificial satellites and covered a variety of images, including visible light images similar to what the human eye sees, images emphasizing vegetation, and images showing temperature distributions.
While visible light images are relatively familiar, why can artificial satellite images emphasize vegetation or visualize temperature distributions that are invisible to the human eye?
In a previous article, we introduced that satellites capture light. In this article, we will delve further into “light” to explore the differences in images that satellites provide.
1.What kind of Light does the Human Eye perceive?
When humans see objects, they can distinguish colors. Apples and tomatoes appear red, the sky on a sunny day looks blue, and leaves appear green.
But why do they appear that way?
This is because when objects receive light from sources like the sun or fluorescent lamps, only certain colors of light are reflected and reach our eyes, allowing us to perceive colors.
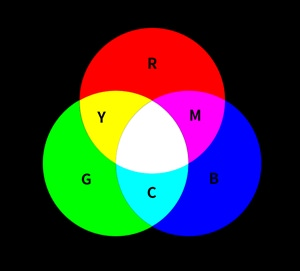
The eye contains cells called photoreceptors that function like sensors for blue, green, and red light. The color is determined based on the proportion of each color of light sensed by these photoreceptors.
For example, if only the blue-sensitive photoreceptors perceive the incoming light, the color is identified as blue. If both green and red are sensed, the color is perceived as yellow. When all three, blue, green, and red, are sensed together, the color is perceived as white. If none of them are sensed, it is perceived as black.
The human eye, as shown in the diagram below, determines colors based on combinations of blue, green, and red light, which are considered the primary colors of light.
Credit : Sorabatake
Many of our readers may remember learning about this in science class. In Chapter 2, we will delve deeper into the limitations of the human eye and explore the types of light that satellites can distinguish.
2.What is Wavelength? Only a Small Portion of Light is Captured by the Human Eye.
While humans perceive the world by sensing blue, green, and red light, light is not composed solely of these three colors.
In a broad sense, light is a type of electromagnetic wave. It includes radio waves used in communication, infrared rays used in remote controls, and ultraviolet rays that can cause sunburn, among others. Each of these types of light, also known as “wavelengths,” has different properties based on the difference in the intervals between waves.
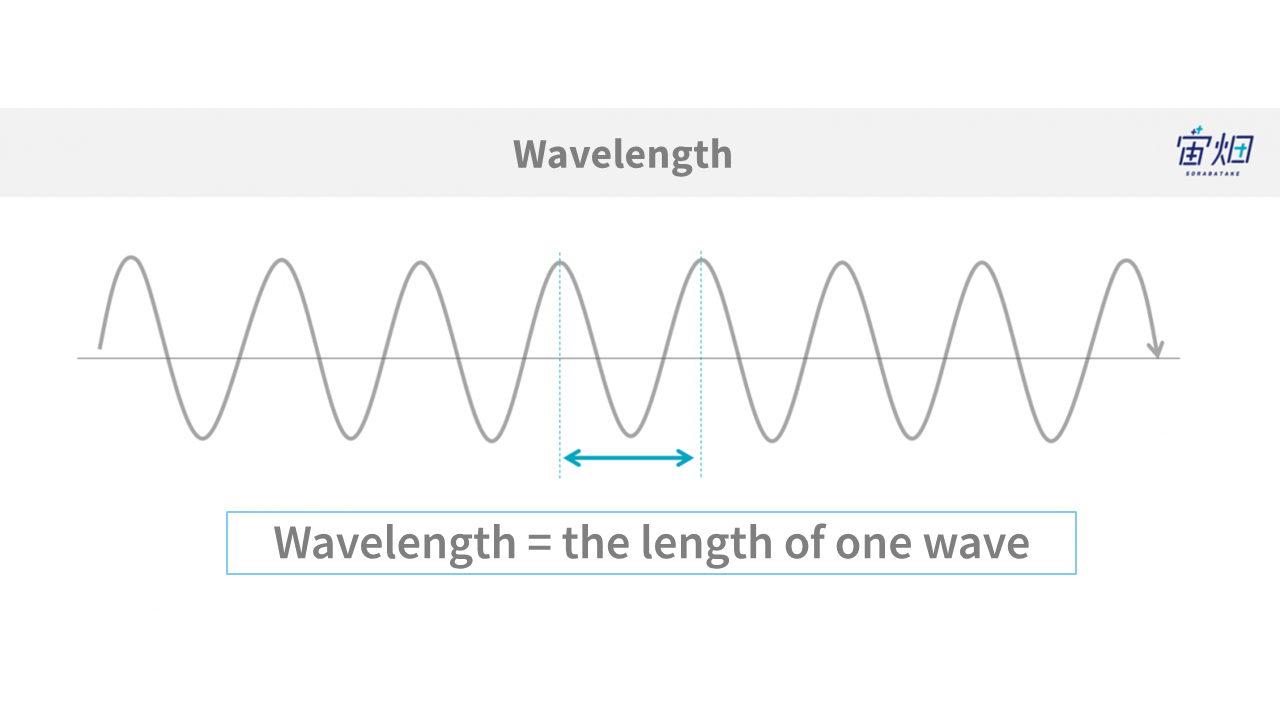
“Wavelength” refers to the length of one wave of an electromagnetic wave. We perceive these differences in length as differences in color or pitch of sound.
The human eye can only see a limited range of wavelengths within the electromagnetic spectrum, which is called the visible spectrum. We perceive this visible spectrum as combinations of blue, green, and red colors.
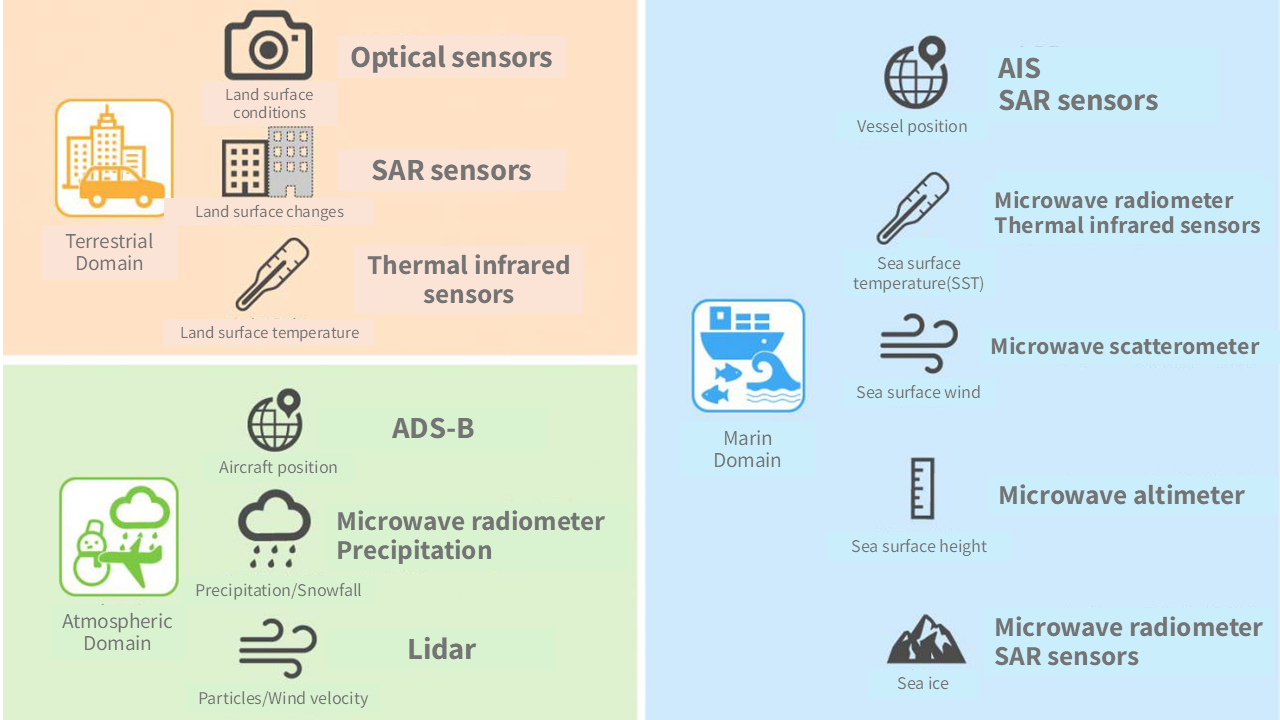
However, artificial satellites are equipped with sensors capable of capturing ultraviolet, infrared, and radio waves. As a result, they can see aspects of the Earth that are not visible to the human eye.
Credit : Sorabatake
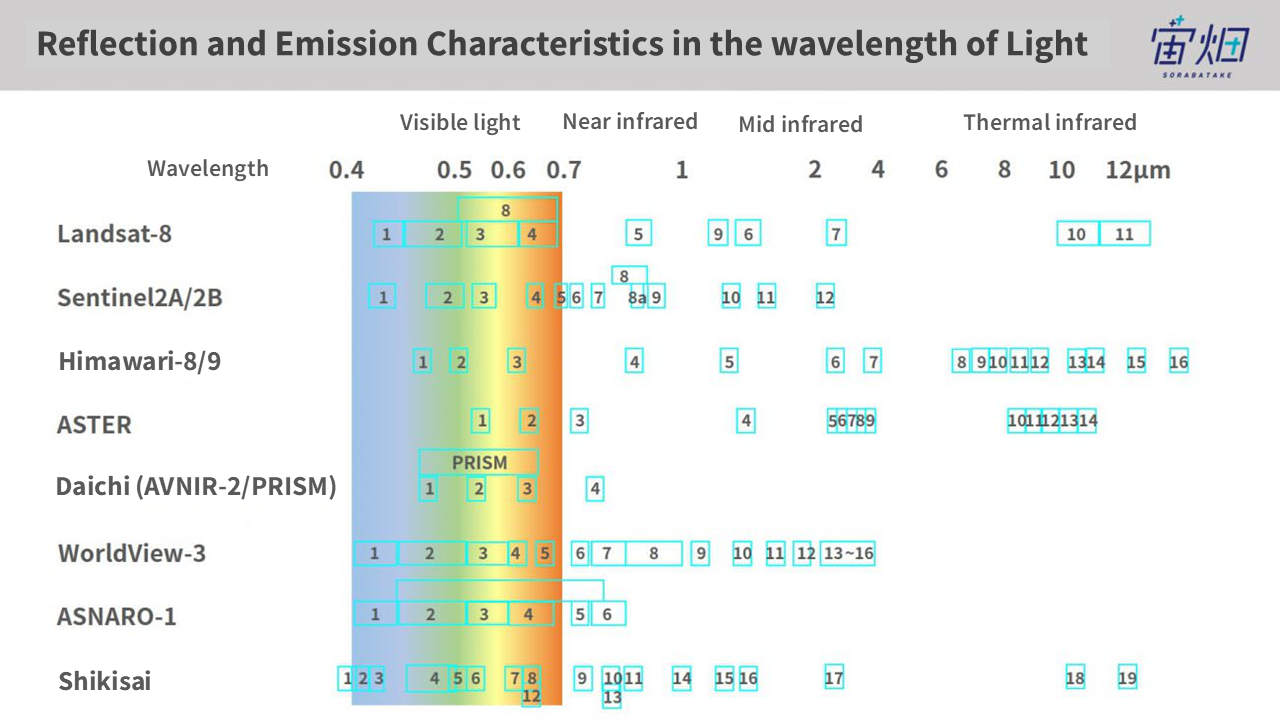
In this article, we encourage you to consider the deep dive into optical sensors (and partially thermal infrared sensors) shown in the figure above, which was introduced in “Satellite Data Basics: Understanding, Types, Frequency, Resolution, and Use Cases.“
3.Understanding Wavelengths Reveals What Can Be Seen
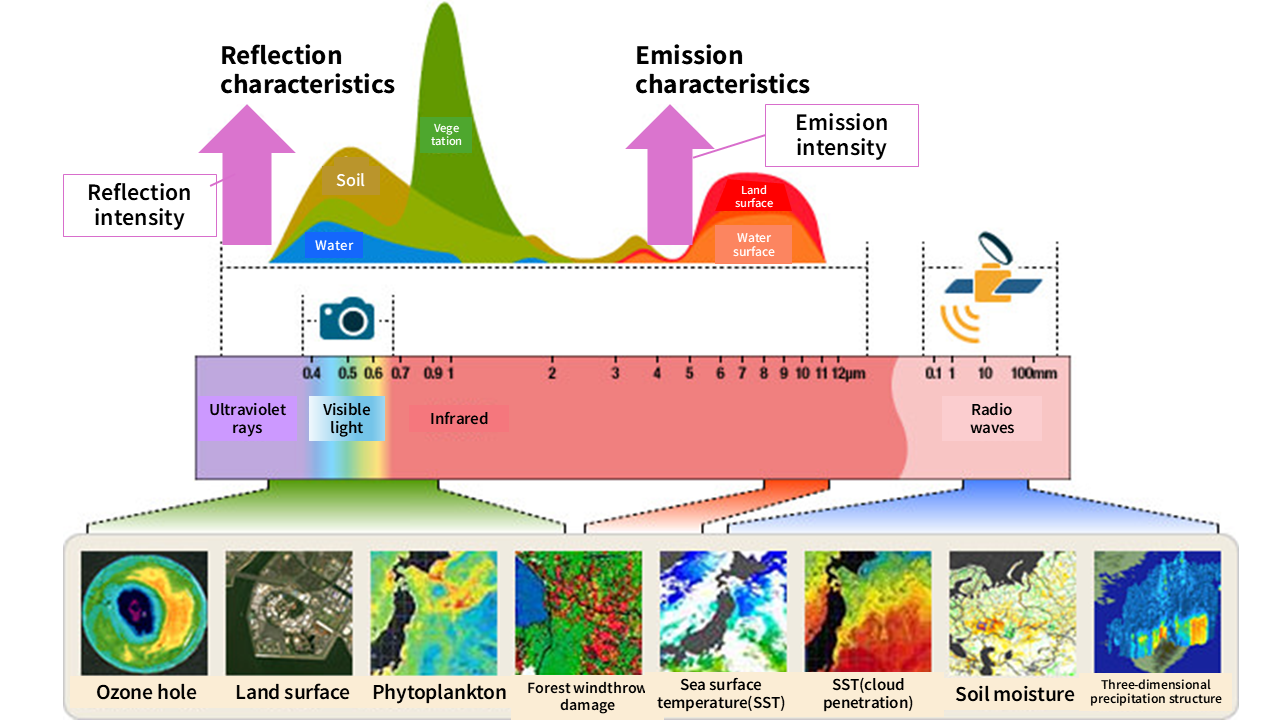
The above graph illustrates how what we can see changes depending on which wavelengths we observe.
The human eye can only perceive the visible spectrum, and by visualizing data observed at other wavelengths, we can understand aspects of the Earth that are not visible to the human eye.
So, why does the visibility change with the wavelength of light? It’s because the reflection and emission of light (electromagnetic waves) by substances vary.
By understanding the characteristics of substances that reflect specific wavelengths of light (electromagnetic waves), we can identify the distribution of certain substances from satellite images captured at specific wavelengths.
For example, in the graph above, we can see that plants strongly reflect infrared light wavelengths close to the visible spectrum. This means that satellites equipped with infrared sensors can investigate the distribution of vegetation.
While we may associate plants with the color green, the distribution of vegetation (vegetation index) can be clearly revealed when observed in infrared wavelengths rather than the green wavelengths in the visible spectrum.
Summary of the Previous Chapters:
– The human eye can perceive red, green, and blue light wavelengths (only these three can be distinguished).
– Objects have the characteristic of reflecting specific wavelengths of light.
– To examine specific substances, it is necessary to understand their reflection and emission characteristics.
4.Differences Based on Wavelength? Satellite Image Comparison
Now, let’s explore the differences based on wavelength by comparing actual satellite images.
In this section, we will showcase images that can be observed through Landsat-8, Sentinel-2, and Himawari-8, all of which provide free downloadable satellite data.
The figure below summarizes the wavelength bands that each satellite can observe. The band numbers used when downloading satellite data correspond to the numerical values representing the wavelength ranges in the figure.
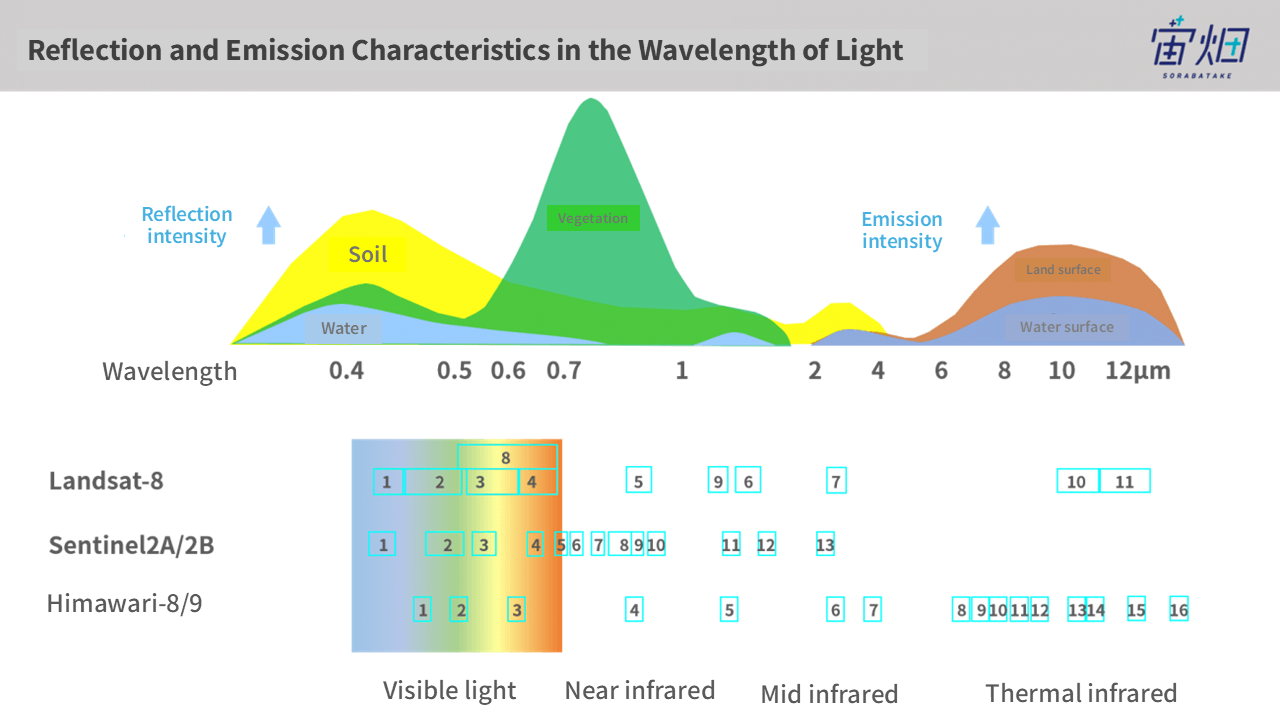
The images presented here were downloaded on April 8, 2018, covering the Kanto region in Japan (Himawari-8 covers the surrounding areas of Japan).
Although the satellites have different observation timings due to their orbital cycles, all three satellites observed the same area on this specific date.
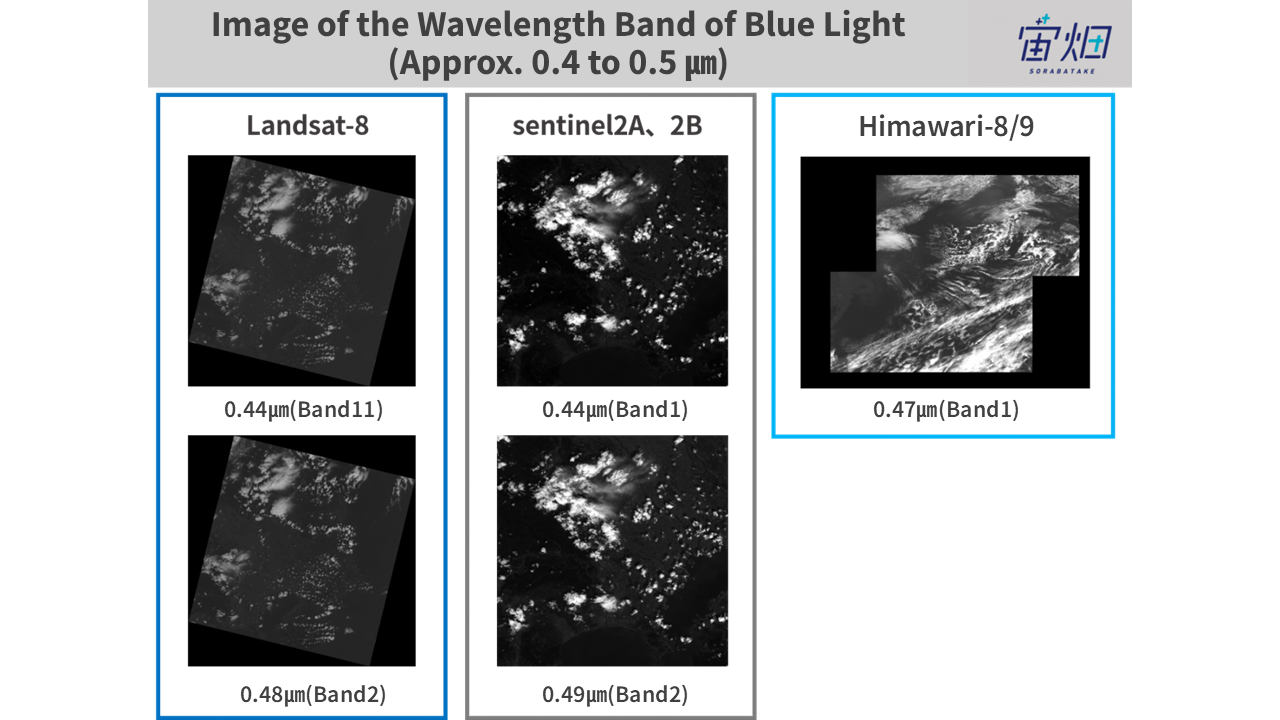
4-1: Blue Light Wavelength Band (Approx. 0.4 to 0.5 μm)
Credit : Sorabatake
The blue light wavelength band (approximately 0.4 to 0.5 μm) represents one of the three primary colors of light. Although the image above predominantly shows clouds, making it difficult to see the Earth’s surface, this wavelength band is useful for studying soil distribution and distinguishing deciduous trees from coniferous trees.
It is also suitable for observing aerosols in the atmosphere. Beyond the blue light wavelength, we have ultraviolet rays, and even shorter wavelengths are categorized as X-rays. However, satellites typically use the blue light wavelength and above for observation.
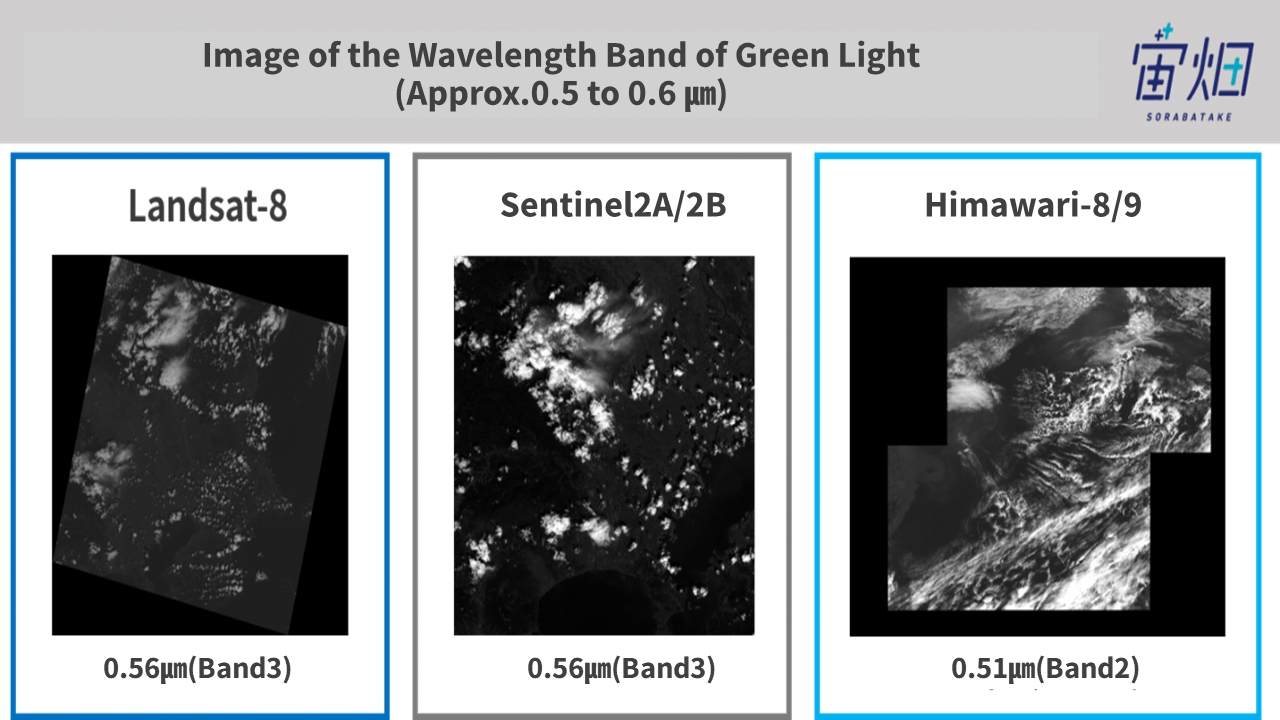
4-2: Green Light Wavelength Band (Approx. 0.5 to 0.6 μm)
Credit : Sorabatake
The green light wavelength band (approximately 0.5 to 0.6 μm) is useful for assessing the activity of vegetation.
4-3: Red Light Wavelength Band (Approx. 0.6 to 0.7 μm)
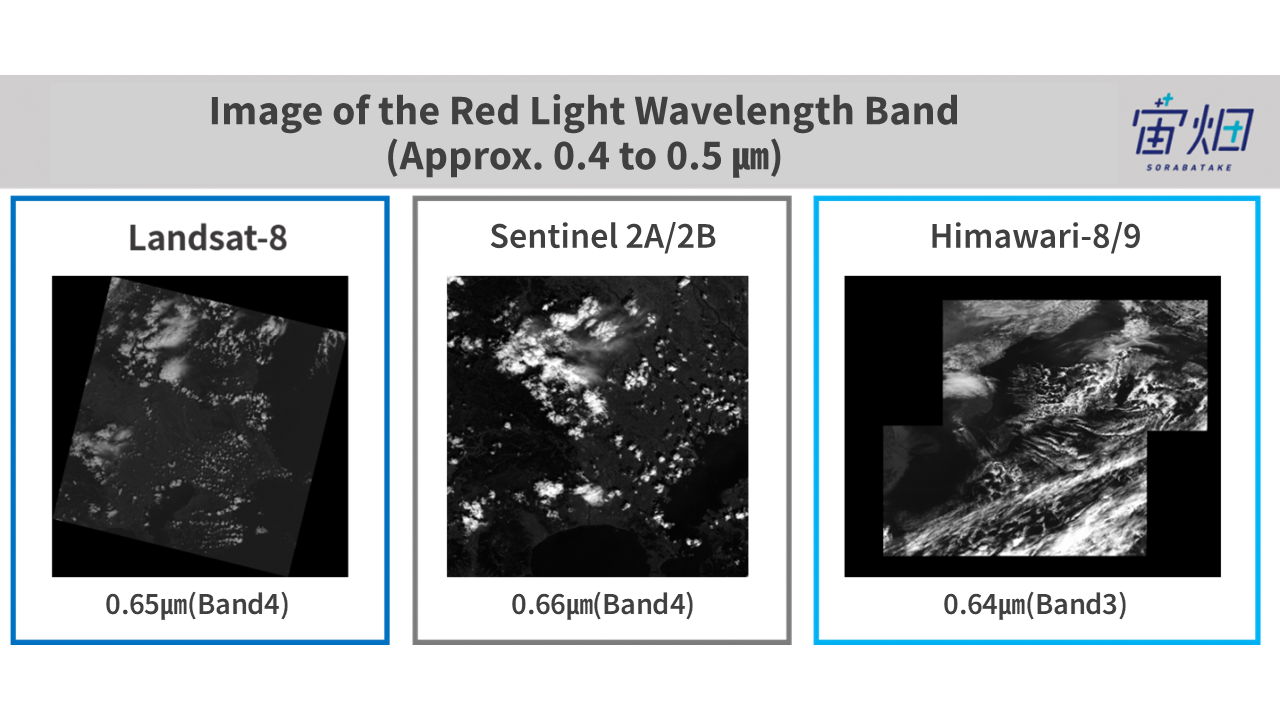
Credit : Sorabatake
The red light wavelength band (approximately 0.6 to 0.7 μm) is suitable for distinguishing water bodies from land and for observing vegetation more clearly compared to the blue and green light wavelengths.
4-4: Visible Light Image
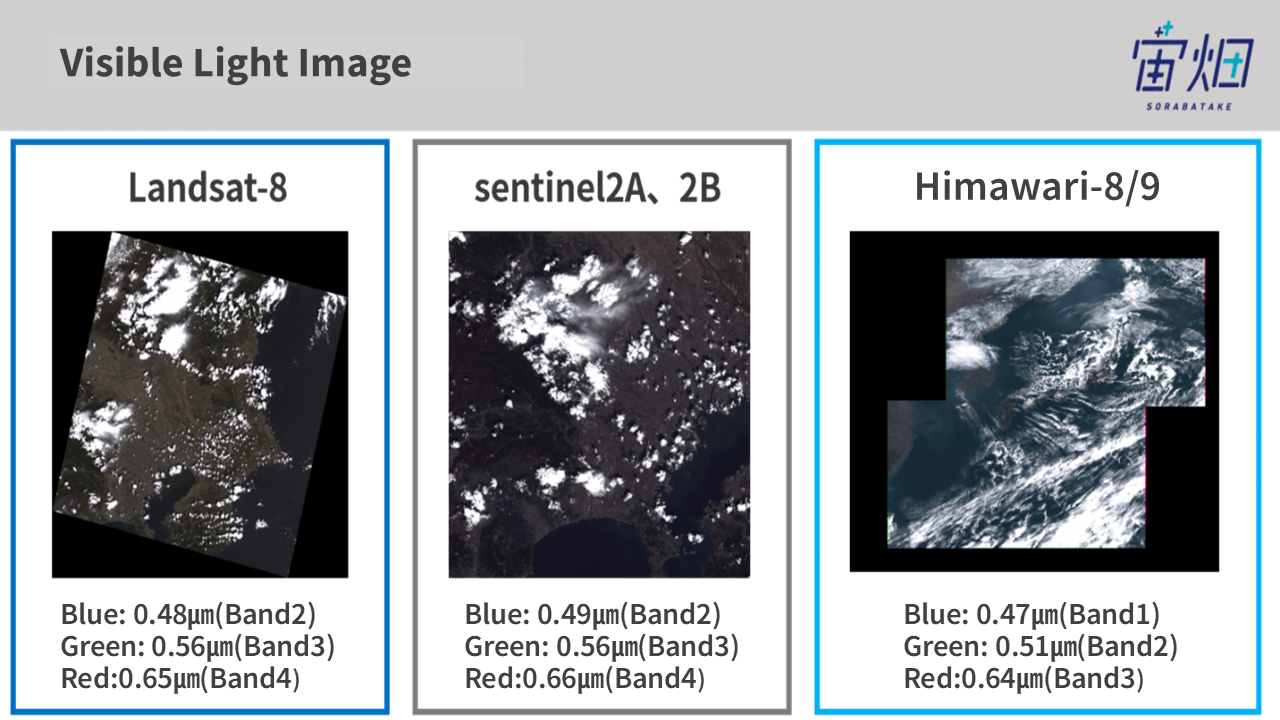
By combining the images captured in the red, green, and blue light wavelength bands, we can create a visible light image that resembles what we see with our eyes.
If you are interested in creating your own satellite image、 please visit 「1時間で完成! 0から始める衛星画像の作り方」.
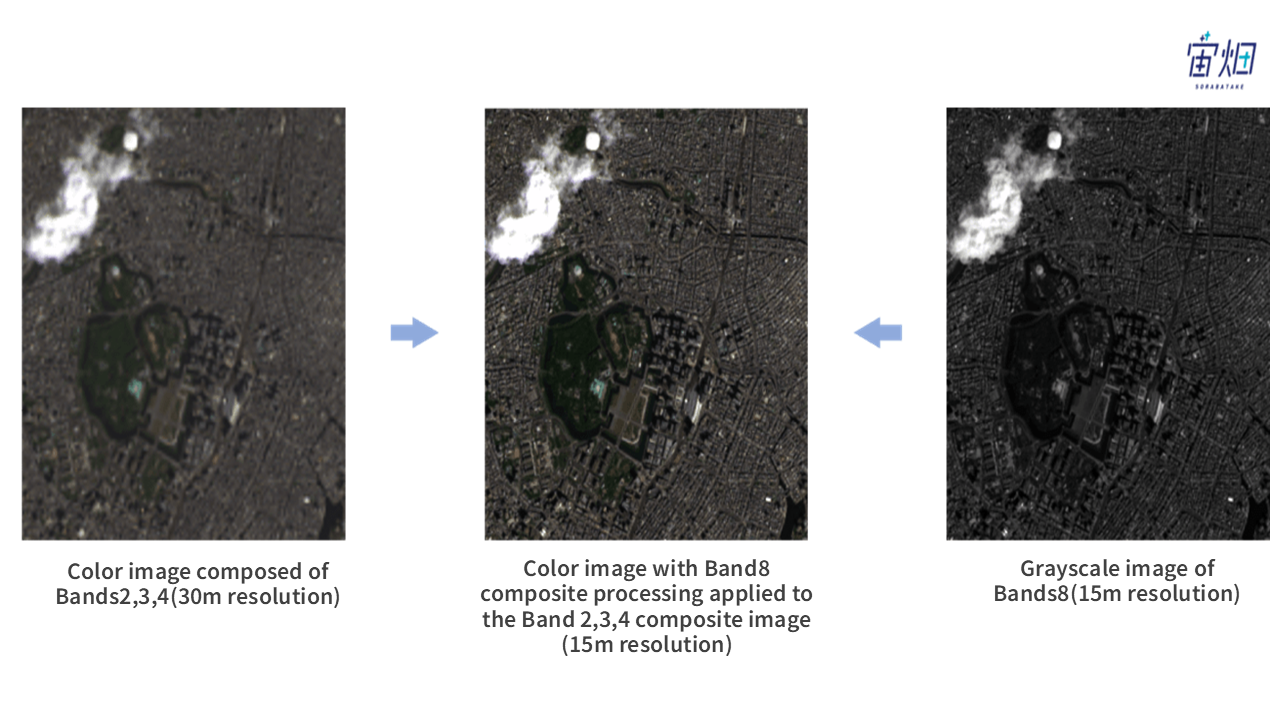
For Landsat-8, Band 8 captures the wavelength range of 0.5 to 0.68 μm at a higher resolution (15m) compared to other bands (30m). This allows for the creation of high-resolution color images through pan-sharpening, where the color-combined image is synthesized with Band 8’s high-resolution image.
4-5: Near Infrared (NIR) Wavelength (Approx. 0.7 to 1 μm)
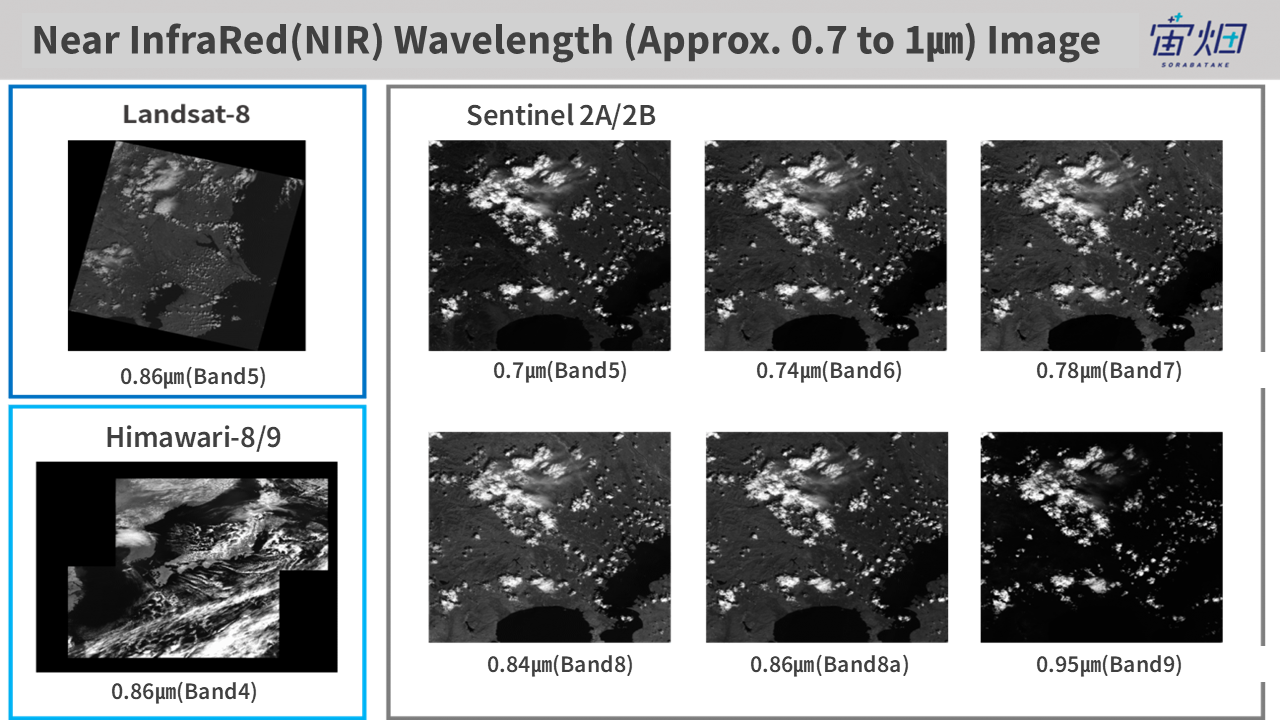
Infrared radiation is classified into different categories based on wavelengths close to the visible range. These categories include Near Infrared (NIR), Mid Infrared (MIR), and Thermal Infrared (TIR), among others. The classification may vary slightly depending on the source, with some placing Shortwave Infrared (SWIR) between NIR and MIR, and others including Far Infrared after MIR.
Wavelengths in the infrared range are not detectable by the human eye. Compared to previous images, NIR allows for a clearer distinction between land and water, making the land area more discernible in the image. This band is known for its strong reflection by vegetation, making it useful for studying vegetation distribution. Urban areas with dense high-rise buildings appear darker than vegetated areas.
In Sentinel-2, the NIR wavelength range is further divided into bands, allowing for detailed analysis of vegetation based on subtle differences in wavelengths.
4-6: Mid Infrared Wavelength (Approx. 1 to 6 μm)
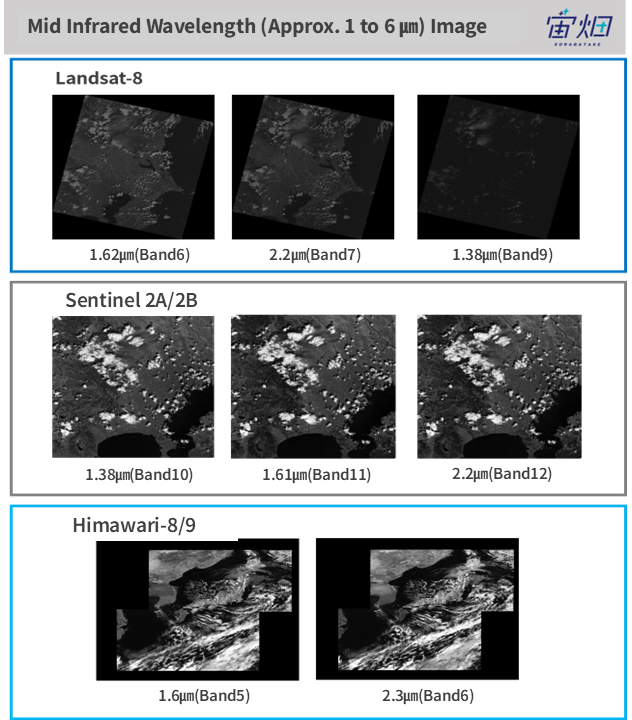
The range of wavelengths between 1 and 1.7 μm is also referred to as Shortwave Infrared (SWIR). In this wavelength range, water reflects well, while ice exhibits minimal reflection. Low clouds with high water content appear bright, while clouds with abundant ice or snow appear dark. Additionally, emissions from high-temperature objects, such as fire, are visible.
On the Earth’s surface, grasslands and bare soil appear relatively bright, while urban centers appear dark. Therefore, this wavelength range is utilized for studying soil distribution.
This wavelength band allows for a clear distinction between water bodies and land, making it suitable for observing rivers and other water features.
Himawari-8’s wavelength of 3.9 μm (Band 7) allows it to observe both solar-reflected and self-emitted electromagnetic waves from substances. The grayscale appearance varies with cloud height during day and night.
In a later section, we will introduce Himawari-8’s Band 13 wavelength, which observes differences in cloud height. Comparing this with Band 7 data allows for a more detailed study of cloud properties and structures.
4-7: Thermal Infrared (TIR) Wavelength (Approx. 6 to 13 μm)
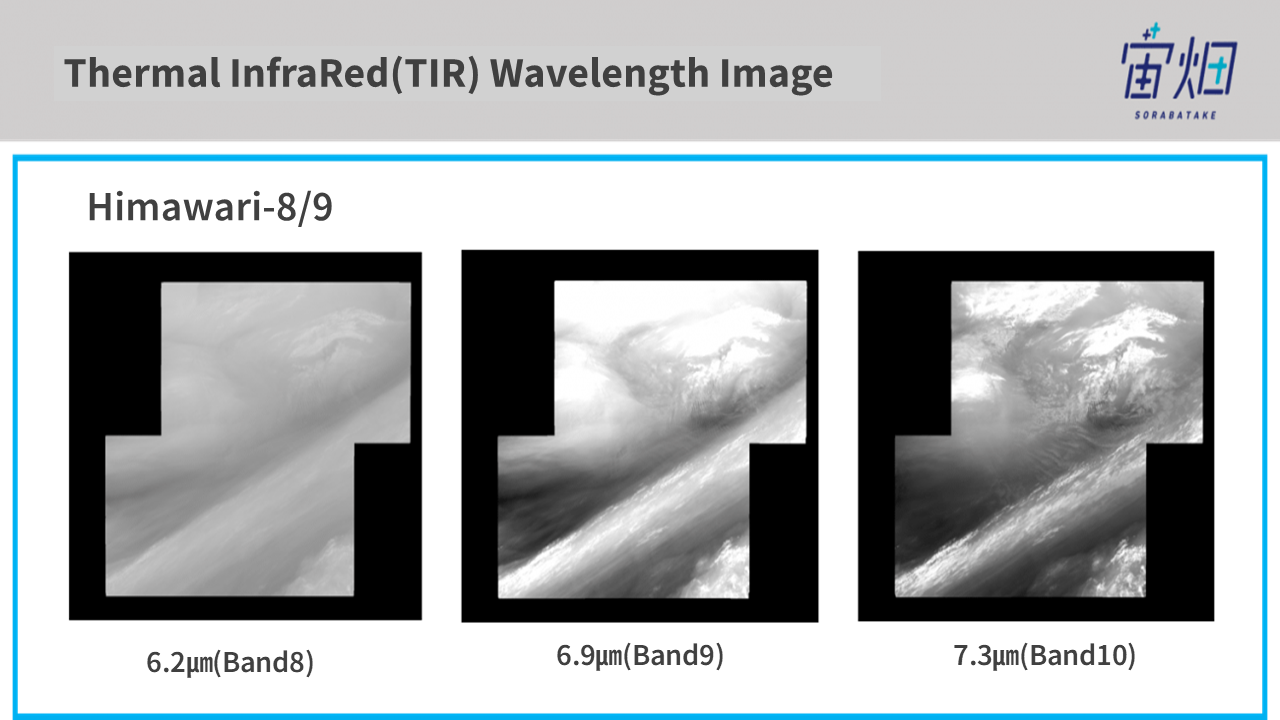
Credit : Sorabatake
At wavelengths of approximately 6 to 13 μm, satellites capture electromagnetic waves emitted directly by substances rather than sunlight reflected from the Earth’s surface. Clouds and vegetation also emit electromagnetic waves, and specific wavelengths allow us to observe different features.
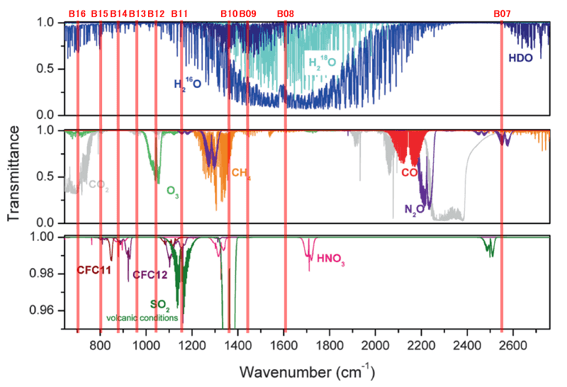
In the relatively shorter-wavelength TIR range of Himawari-8, which includes Bands 8 (6.2 μm), 9 (6.9 μm), and 10 (7.3 μm), water vapor content can be observed. The differences in appearance in the three images represent the distribution of water vapor in the atmosphere at different altitudes. Band 8 captures upper tropospheric water vapor, while Band 10 captures lower tropospheric water vapor.
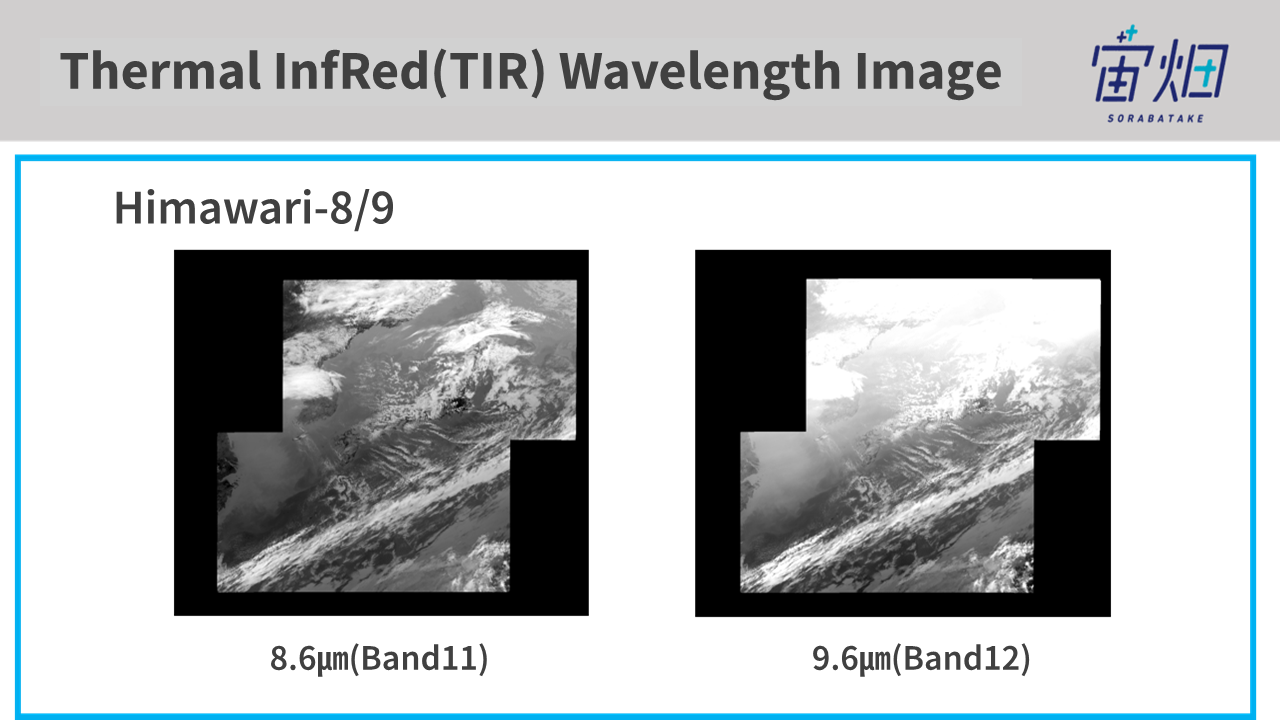
Credit : Sorabatake
Continuing, Himawari-8’s Band 11 (8.6 μm) allows the observation of sulfur dioxide, useful for monitoring volcanic eruption plumes. Band 12 (9.6 μm) is used for investigating ozone distribution.
In this way, thermal infrared wavelengths are utilised to study atmospheric components.
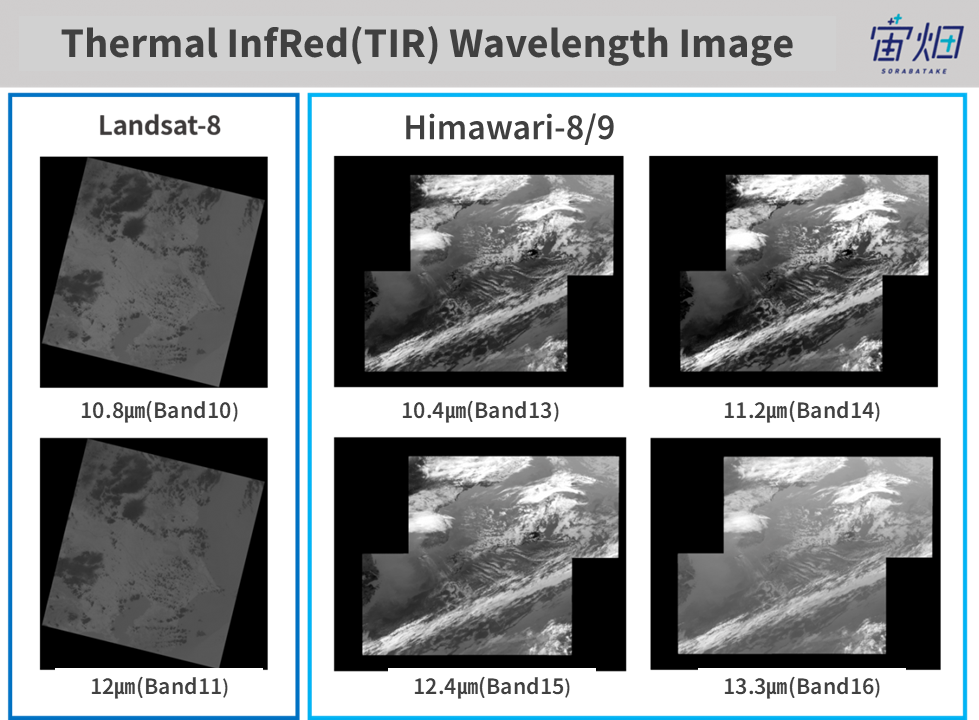
Credit : Sorabatake
By examining the figure above, we can see that Landsat-8 and Himawari-8 capture similar wavelengths, but the appearance is significantly different. In this wavelength range, brighter areas in Himawari images represent lower temperatures, while in Landsat-8 images, darker areas indicate lower temperatures.
This information allows us to study cloud height by comparing temperatures between upper-level clouds and clouds closer to the Earth’s surface. It is also used to examine surface temperatures and sea surface temperatures in cloud-free regions.
The longer-wavelength bands, such as Landsat-8’s Band 11 (12 μm) and Himawari-8’s Band 16 (13.3 μm), are affected by ice crystals in the atmosphere more than shorter-wavelength bands. By calculating the difference between these longer and shorter wavelengths, we can determine differences in cloud height, which are difficult to ascertain from a visual perspective. This helps us understand cloud structures and atmospheric movements.
Furthermore, Himawari-8’s Band 14 is sensitive to sandy areas, Band 15 (12.4 μm) to volcanic ash and dust, and Band 16 to carbon dioxide, allowing the investigation of atmospheric components.
Credit : Japan Meteorological Agency
4-8: Viewing Earth through Wavelength Combinations
We have introduced the wavelength bands observable by the three satellites so far. Instead of analyzing each band separately, we can also gain new perspectives on Earth by combining bands.
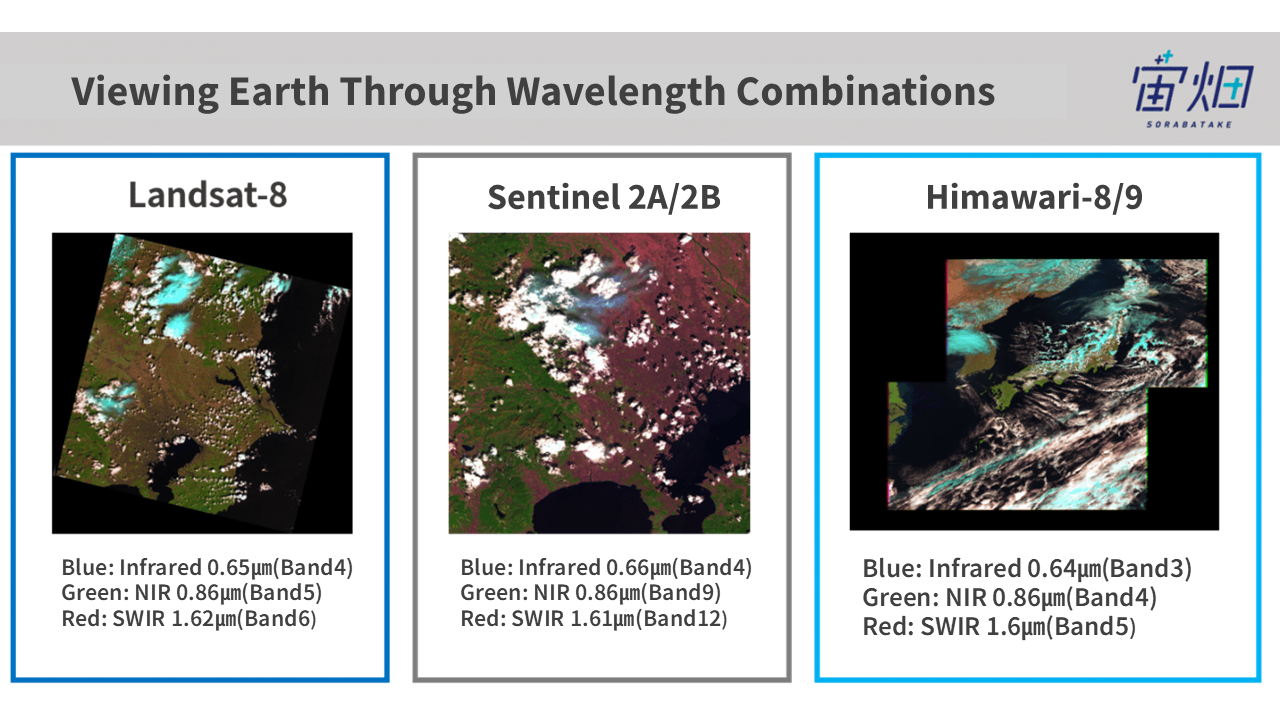
For example, by combining three wavelengths for each satellite:
Landsat-8: 0.65 μm (Band 4), 0.86 μm (Band 5), 1.62 μm (Band 6)
Sentinel-2: 0.66 μm (Band 4), 0.86 μm (Band 9), 1.61 μm (Band 12)
Himawari-8: 0.64 μm (Band 3), 0.86 μm (Band 4), 1.6 μm (Band 5)
We can distinguish between high-level clouds (including ice and snow clouds) and low-level clouds (containing rain and water vapor) and also improve the identification of vegetation distribution.
Additionally, we can calculate vegetation indices and moisture content using two wavelengths.
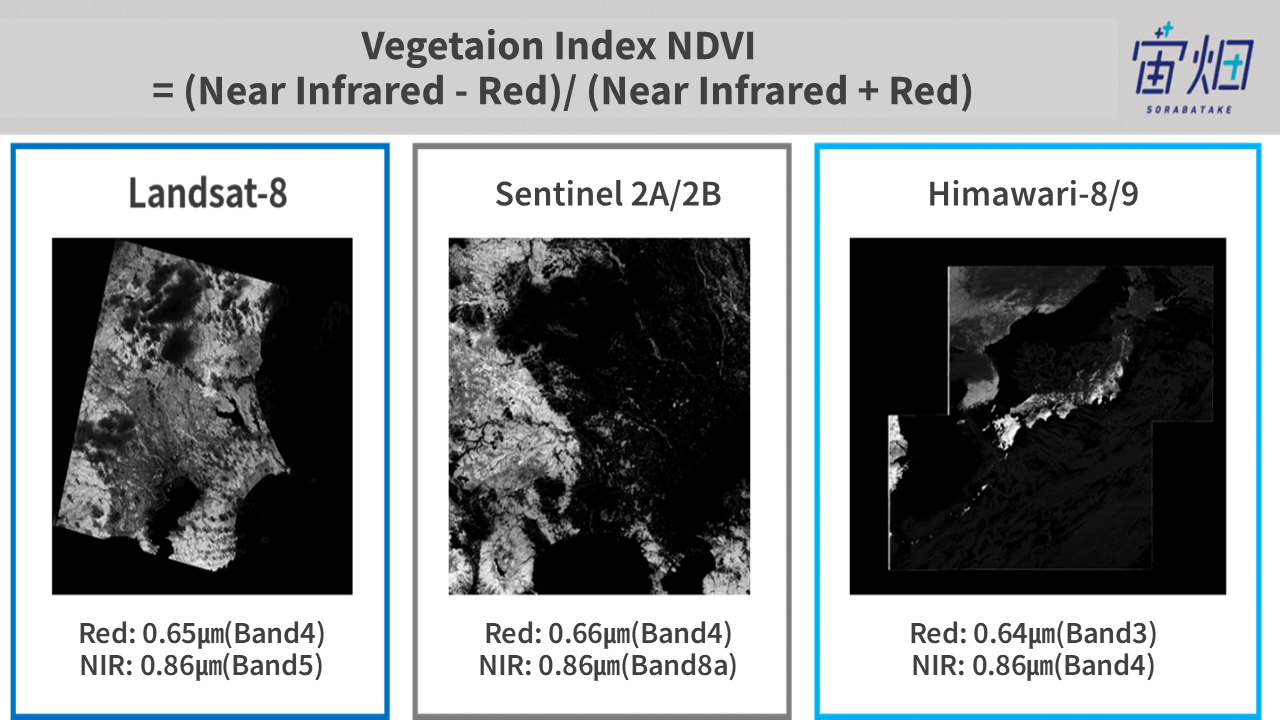
For instance, the Normalized Difference Vegetation Index (NDVI) is used to assess the distribution of active vegetation based on near-infrared and red wavelengths, as shown in the equation:
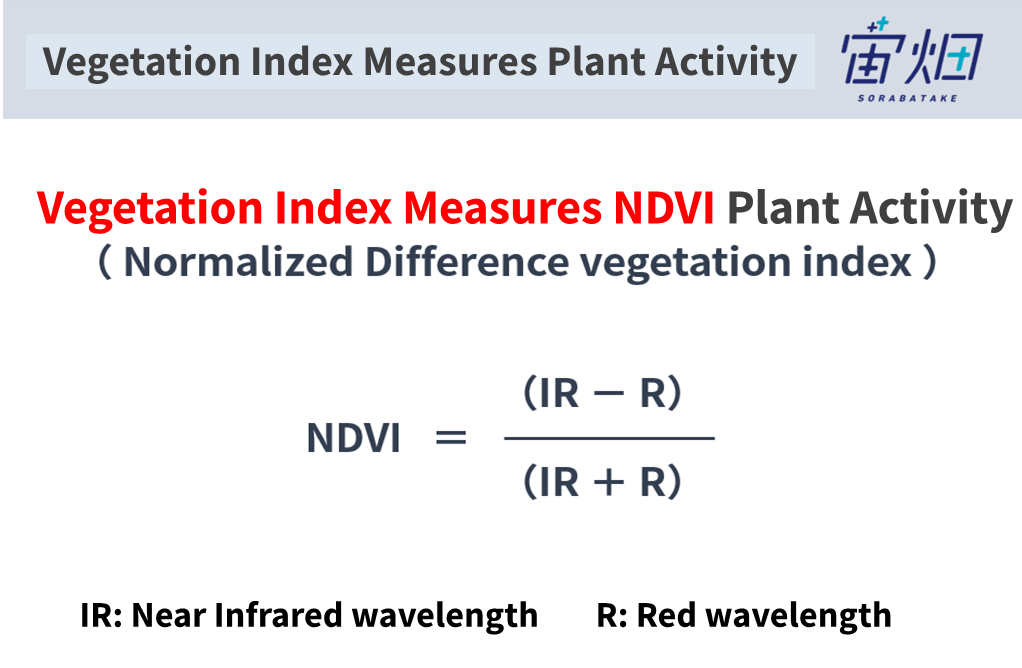
NDVI = (Near Infrared – Red) / (Near Infrared + Red)
With the mentioned satellite bands, NDVI can be calculated as follows:
Landsat-8: Red 0.65 μm (Band 4), Near Infrared 0.86 μm (Band 5)
Sentinel-2: Red 0.66 μm (Band 4), Near Infrared 0.86 μm (Band 8a)
Himawari-8: Red 0.64 μm (Band 3), Near Infrared 0.86 μm (Band 4)
This allows us to clearly represent the distribution of active vegetation.
We can even use the ability to distinguish vegetated areas from non-vegetated ones seen from satellites in a fun way. For example, there is a game called “衛星データだけでグランドスラムのテニスコート素材を当てる!” where you can try to determine whether tennis courts have artificial turf or natural grass just by looking at satellite data.
5.Conclusion
As we have seen, examining Earth in various wavelength bands allows us to capture many aspects of our planet that are not visible to the human eye.
The three satellites introduced in this article can observe Earth in multiple bands, but they do not cover all the necessary wavelengths to fully understand the Earth. As shown in the diagram below, different satellites observe different wavelengths, and their resolutions also vary.
Until now, it has been common to combine data from multiple bands of a single satellite to observe Earth. However, in the future, using multiple satellites to observe Earth from different perspectives and combining different observation data may reveal new insights. This approach will not only utilize satellite data but also include data from ground-based sources.
Currently, the Ministry of Economy, Trade, and Industry (METI) is promoting the “Tellus” project, which aims to create an environment where satellite and ground-based data can be analyzed on the same platform.
By effectively utilizing various data to understand the Earth’s condition, we may uncover the impact of climate change and foster the emergence of new businesses based on data utilization.
The world of wavelengths allows us to comprehend things that are invisible to the human eye on a wide scale using satellites. I encourage all readers to explore and play around with this fascinating world of wavelengths.
“Explore Satellite Data with Tellus!”
Would you like to see and interact with satellite data on the Japanese open and free data platform, “Tellus”?
★Register to use Tellus here.
[References]
Copernicus: Sentinel-2 — The Optical Imaging Mission for Land Services