Illustrated Guide to Satellite Data Preprocessing: Overview, Level-wise Processing, and Explanations
Satellite data preprocessing can be compared to the "preparation" in cooking. It holds the secret to making the dish delicious.
While working with satellite data, you may come across terms like “processing level”. Phrases like “L1”, “L2”, “atmospheric correction”, “ortho correction”, etc., are listed in data catalogues and websites. However, even after searching online or consulting textbooks, it might be challenging to fully grasp their meanings.
To address this, the Sorabatake editorial team directly approached a professional in satellite data. We thoroughly interviewed Mr. Akira Mukaida, an expert in satellite data processing at the Remote Sensing Technology Center of Japan (RESTEC)
This article provides an explanation by Mr. Akira Mukaida from RESTEC, shedding light on the world of deep satellite data processing.
1.The Intricacies of Satellite Data Preprocessing
Satellite data is the recorded information of Earth taken by artificial satellites orbiting our planet. This process, known as “remote sensing,” involves observing from a distant (“remote”) location.
While recent technologies like Big Data and IoT have been in the spotlight, satellite data stands out as a potential source of information with distinct properties that can complement these datasets.
However, this “satellite data” doesn’t immediately yield analyzable information after being captured by the satellite. Various forms of “preprocessing” are required to make it suitable for analysis.
Even with typical IoT sensors, there’s often a need to convert the values read by the sensor into meaningful data using prescribed mathematical formulas, or to apply corrections. Similarly, similar processing steps are necessary for satellite data.
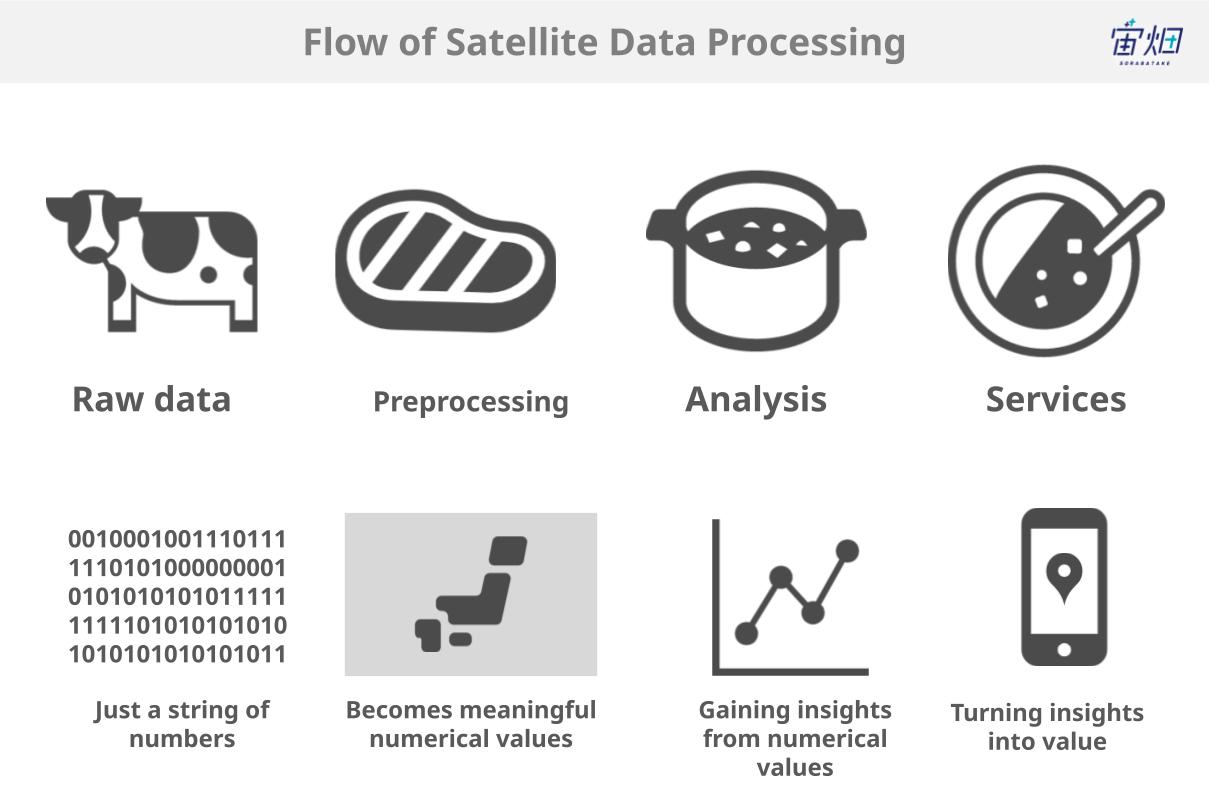
If we were to draw a parallel between satellite data analysis and cooking, the preprocessing discussed in this article would be equivalent to “preparation.” To put it in culinary terms, the raw data emitted by satellites (raw data) is akin to uncut vegetables or an entire unprocessed piece of meat. To start cooking (analysis), preparation such as cutting or removal of fat or bones, or in our case, preprocessing, is essential.
In recent years, with the establishment of satellite data platforms like Tellus, partially prepared ‘ingredients’ have become more accessible to a broader audience, enabling even non-professionals to engage in the analysis process. This transition is akin to the shift from self-sufficiency in food production to being able to shop at a supermarket.
Today, we’ll introduce an overview of the preprocessing steps involved in making the satellite data we acquire ready for analysis.
2. Overview of Satellite Data Preprocessing
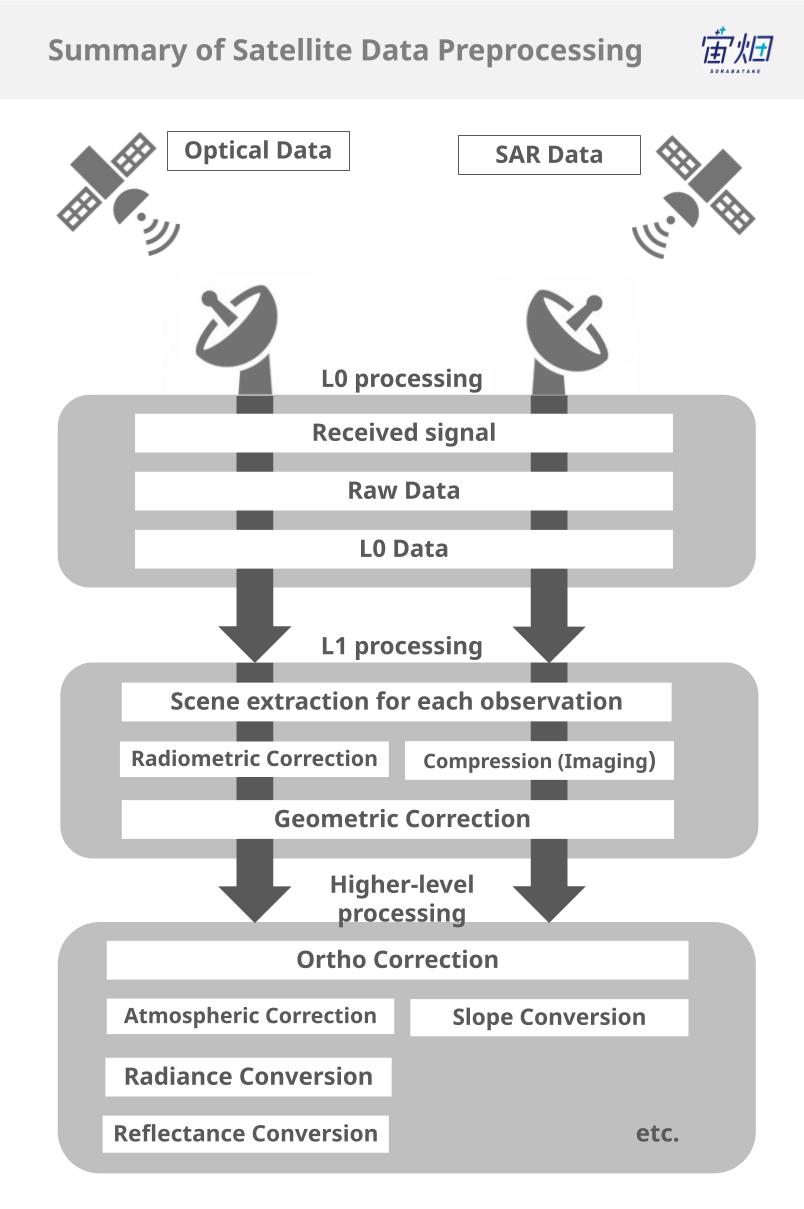
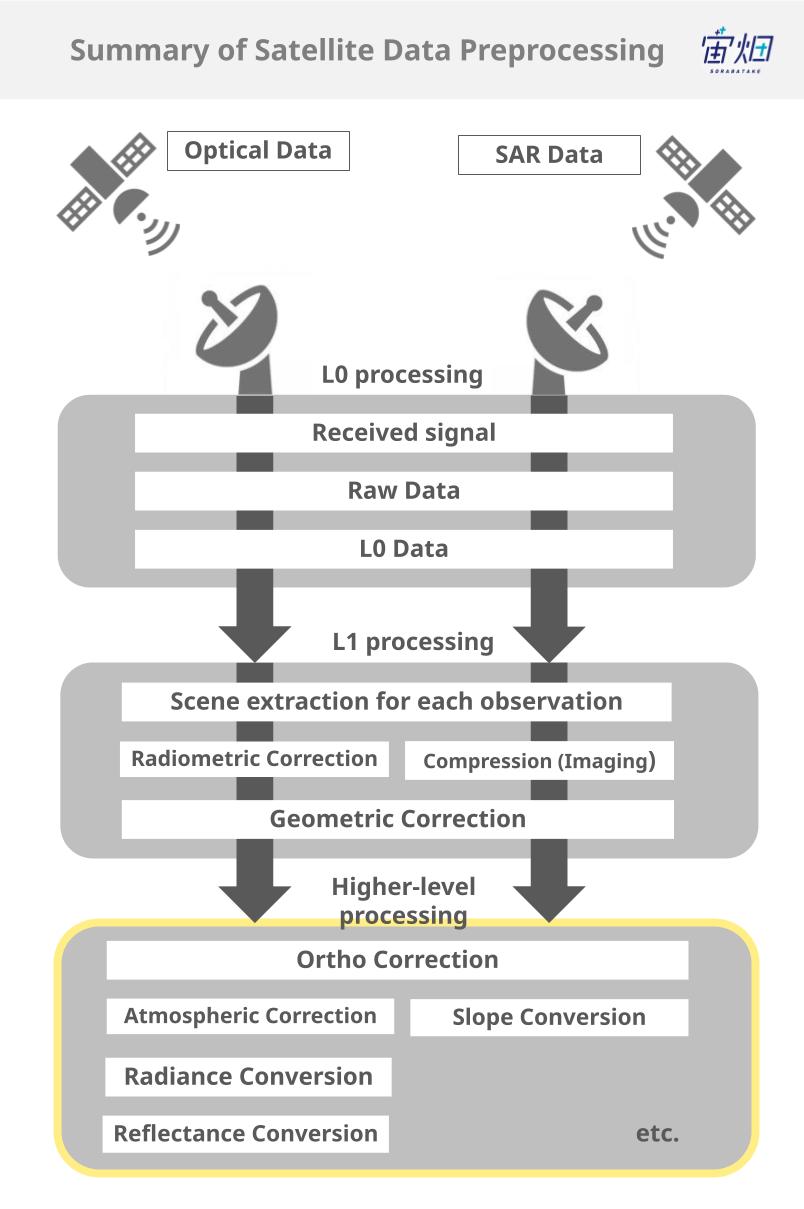
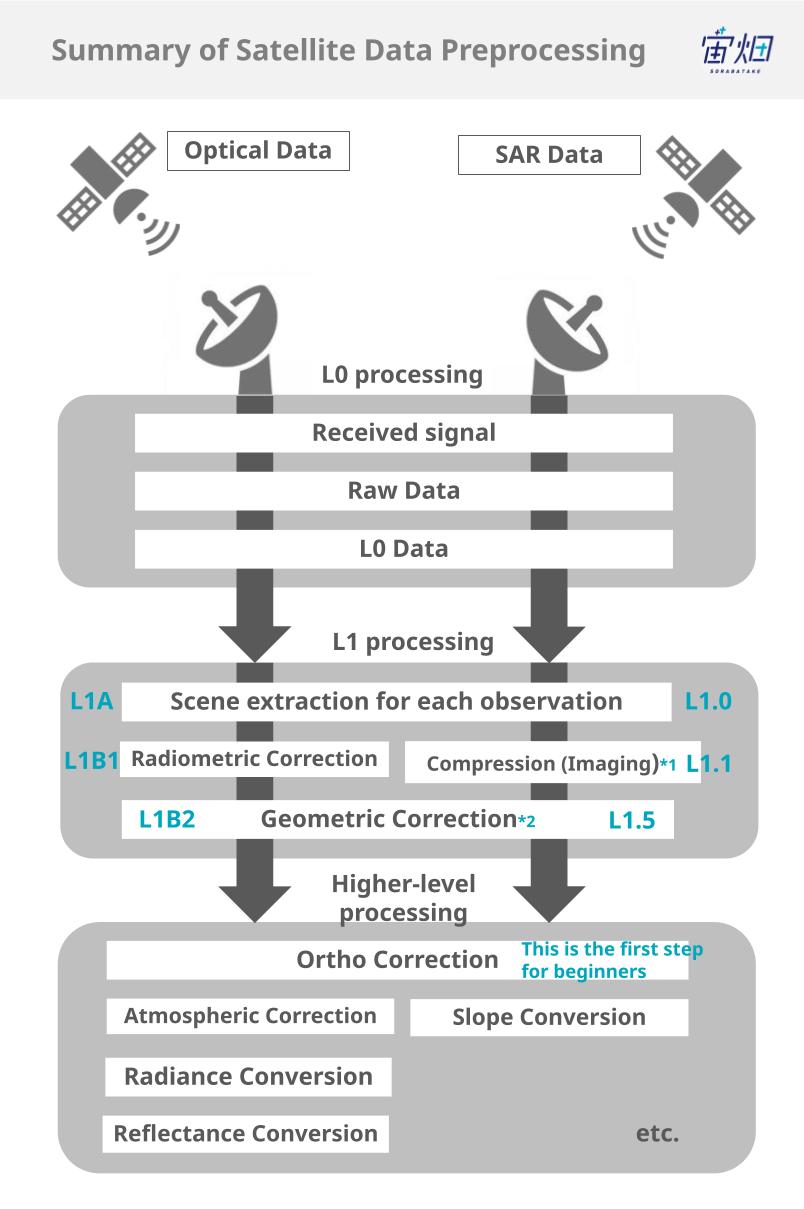
To put the processing steps in extremely broad terms, they can be divided into three phases: L0 processing → L1 processing → higher-level processing, as shown in the diagram.
The “L” in L0 stands for “Level,” indicating the step of processing. As we progress from L1 to 2, 3, and so on, the processing becomes more advanced.
The term “standard processing,” often heard when dealing with satellite data, refers to the processing officially provided by the satellite data provider. Depending on the data, it may involve only L1 processing or even extend to higher-level processing.
Today, we will explain the overview of processing for two types of satellite data: “optical data” resembling images captured by cameras, and “SAR data” which involves observations using radio waves.
3. Turning Satellite-Received Radio Waves into Data! What is L0 Processing?
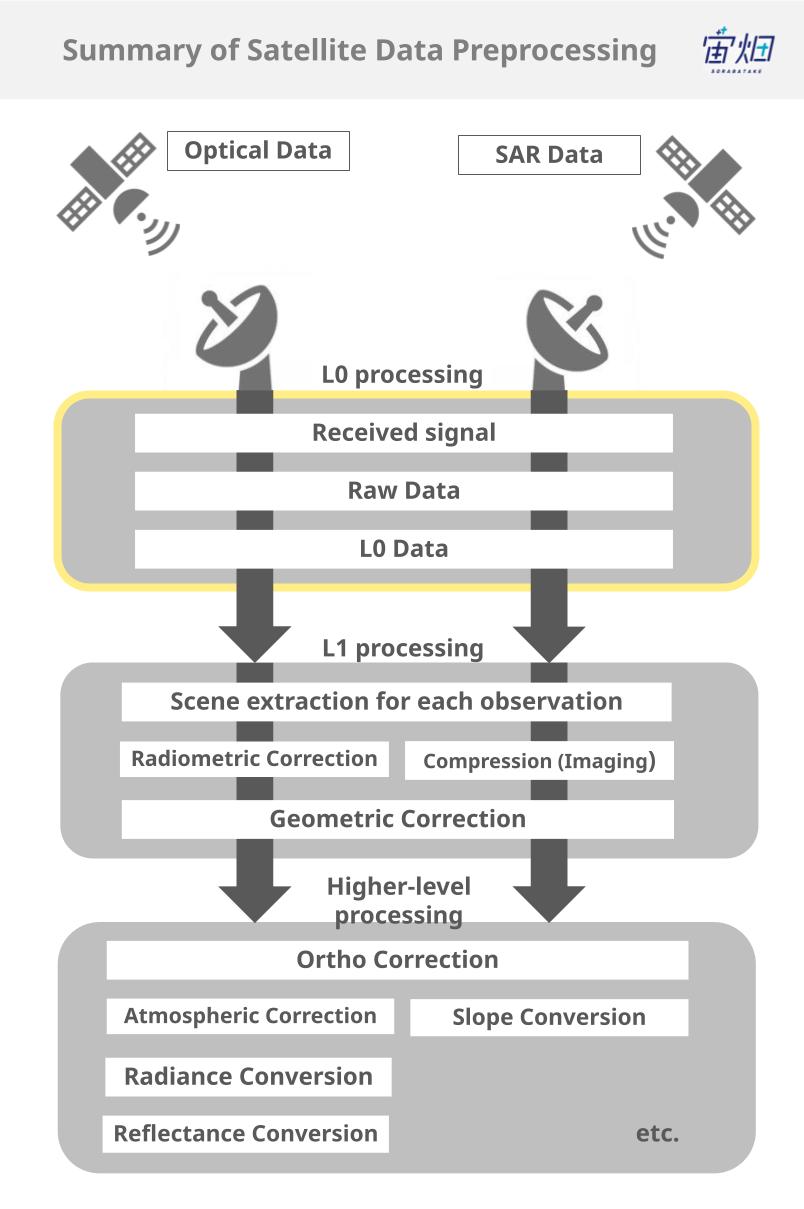
L0 (Level 0) processing refers to the initial processing performed when receiving data from a satellite.
Taking a closer look at the steps within L0 processing:
1.Radio waves from the satellite are received by ground antennas.
2.The received signal, which has been processed for transmission, is reverted back to its original form (Raw Data).
3.Unnecessary information is removed from the Raw Data, resulting in L0 Data.
While the term “Raw Data” is commonly used in various contexts, in the context of satellite data, it specifically refers to data in the state described in step 2. It’s important to note that this data is rarely manipulated by us.
Since L0 processing is based on the specific design of each satellite, it is primarily carried out by the companies or organisations that own the satellite.
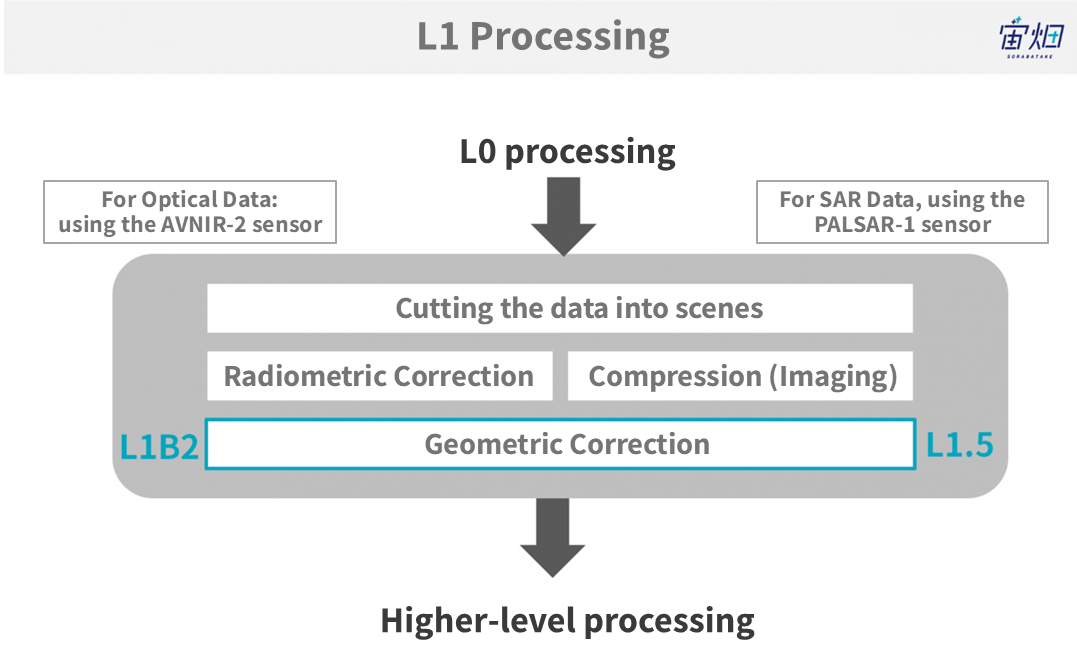
4. Making Data Easy to Handle! What is L1 Processing?
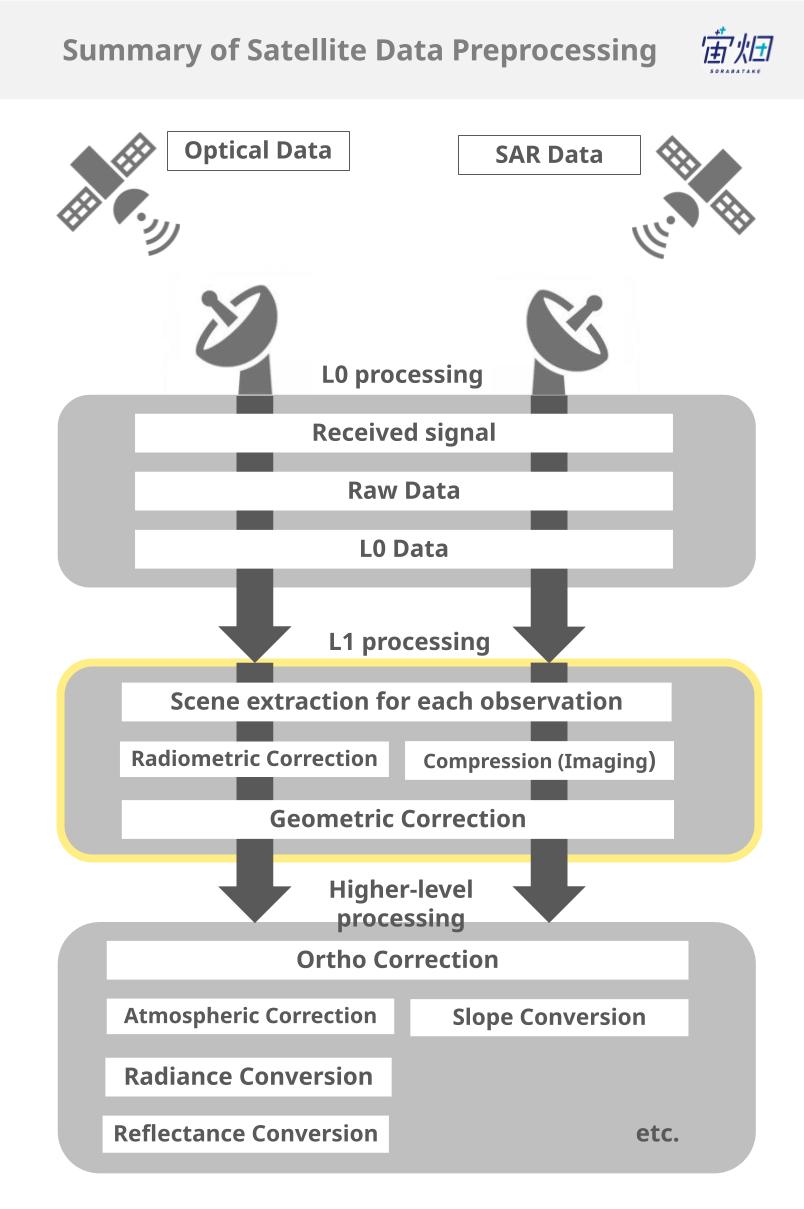
L1 (Level 1) processing is a fundamental processing step from Level 0 to Level 1, applicable to almost any sensor on any satellite.
L1 processing involves three major steps:
1.Scene extraction for each observation
2.Adjusting image sensitivity/imaging for visualisation
3.Geometric Correction (Distortion Correction)
Since these processes are specific to each satellite, they are primarily conducted by the companies or organisations that own the satellites.
Let’s take a detailed look at these three stages.
Scene Extraction for Each Observation
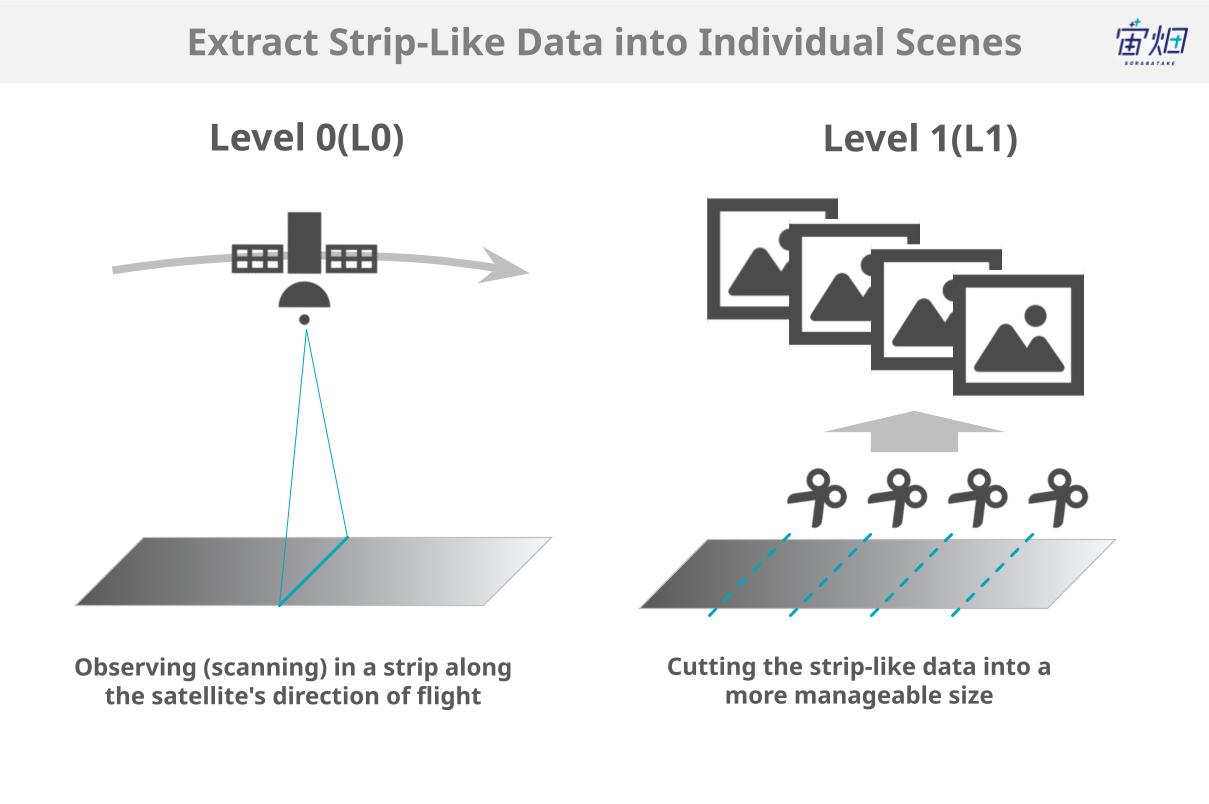
The first step is to extract strip-like data observed by the satellite in the order of its flight into individual photographs, called “scenes”. This process reduces the data into a more manageable size for further processing.
The naming of levels for scene-by-scene extraction differs between optical data and SAR data. Additionally, it varies for each sensor. For this article, we will use JAXA’s AVNIR-2 sensor as an example of optical data and JAXA’s PALSAR-1 sensor as an example of SAR data.
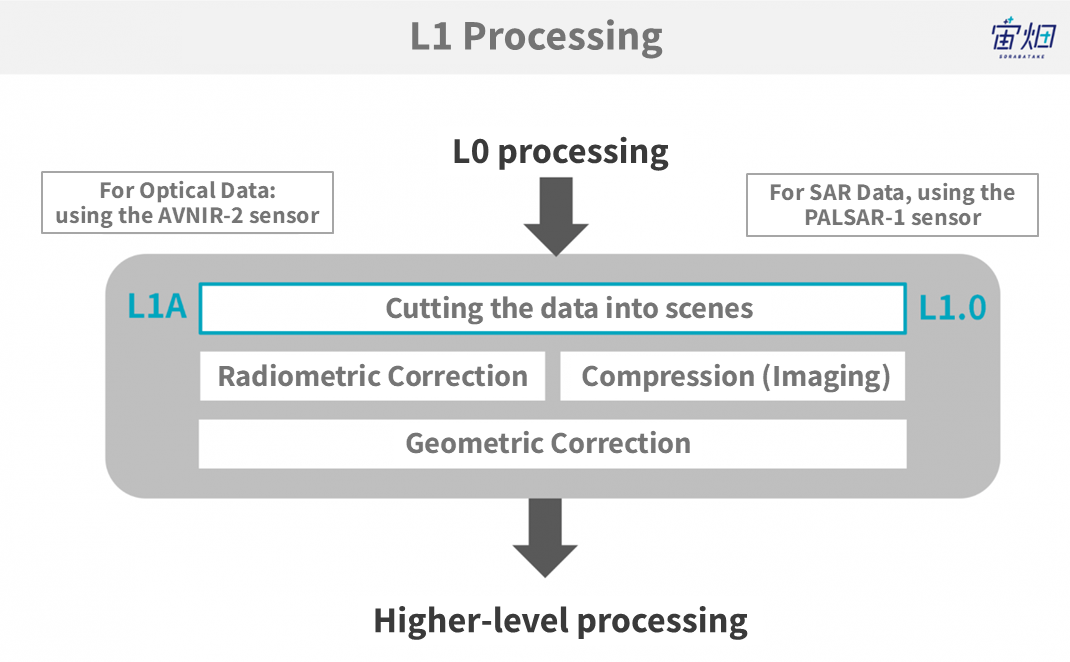
For Optical Data: L1A
In the case of the AVNIR-2 sensor, this level is referred to as L1A.
Parameters necessary for subsequent processing are provided along with the data, so if you have the knowledge, you can also perform further processing. However, please note that this data, before various corrections are applied, might not be suitable for beginners.
For SAR Data: L1.0
For PALSAR-1, a similar process is called L1.0.
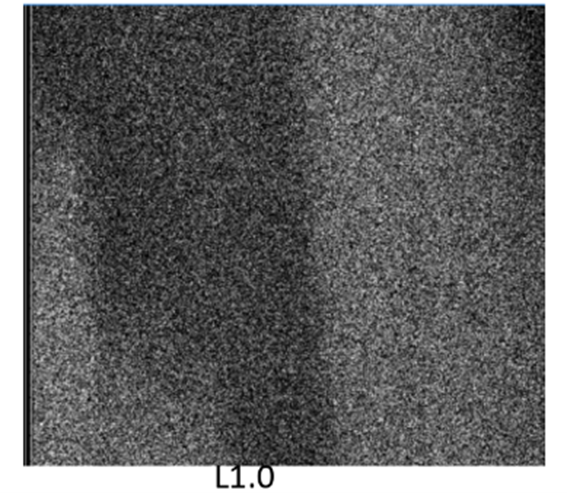
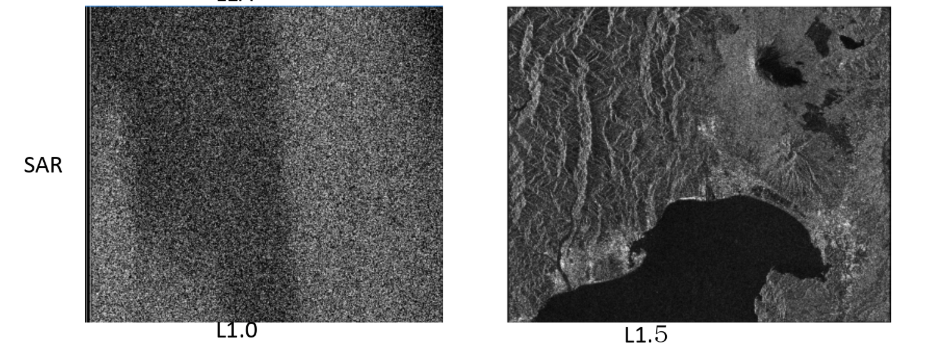
In the case of SAR images, this level of data is hardly ever viewed as images; it looks more like the sesame-salt-like pattern shown in the figure above. Subsequent processing involves creating images.
Adjusting Image Sensitivity (Radiometric Correction) / Creating an Image
While the purpose of this phase is to “clean up the image,” the processes for optical data and SAR data are significantly different.
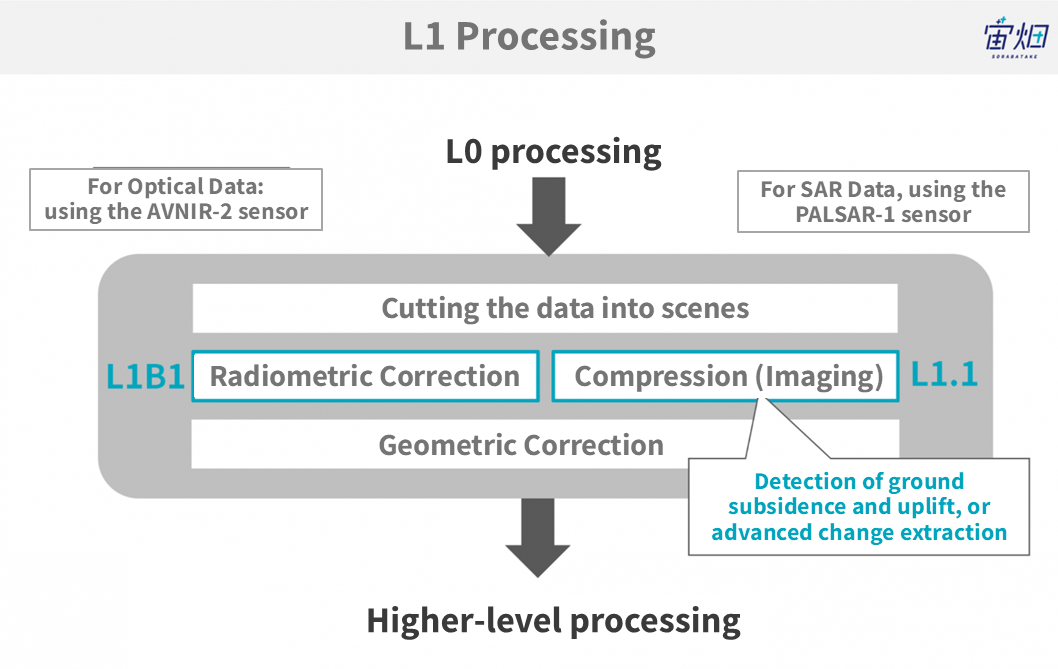
For Optical Data: Radiometric Correction (L1B1)
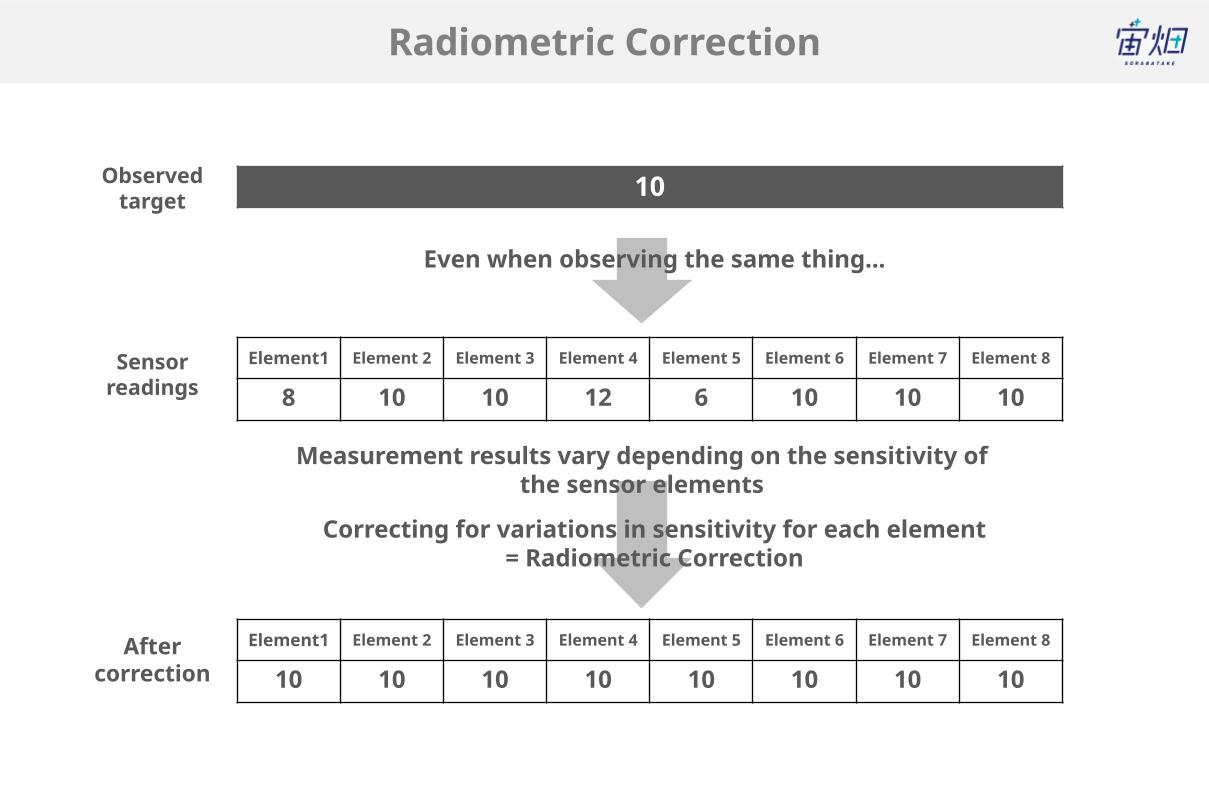
Have you ever seen images from a malfunctioning photocopier where lines appeared on the image?
When sensors on satellites observe, variations in the characteristics of each element or beam can lead to an unclear image. To obtain a clean image without speckles, radiometric correction is applied.
Although the correction method is determined by checking the sensor before satellite launch, changes in sensitivity due to vibrations and thermal conditions during launch may occur. In such cases, readjustments are made based on the actually observed data.
In the case of JAXA’s AVNIR-2 sensor, this processing level is referred to as L1B1 (it’s getting more detailed!).
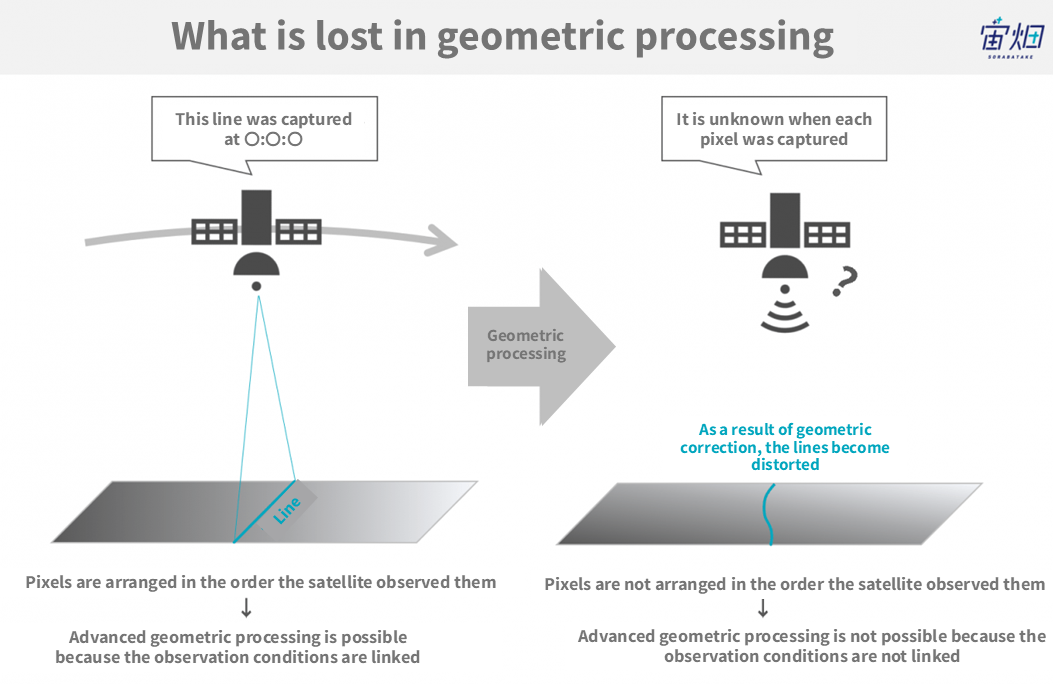
In the subsequent processing, geometric correction is performed, so L1B1 data is the final state where pixels are arranged in the order the satellite captured them. If you want to perform advanced geometric processing on your own, you will need information on when the images were captured, so you would use L1B1.
For SAR Data: Compression (Imaging) (L1.1)
The next step for SAR data is compression processing (imaging). This transforms the sesame-salt-like pattern from earlier into an image.
For JAXA’s PALSAR-1 sensor, this level is referred to as L1.1.
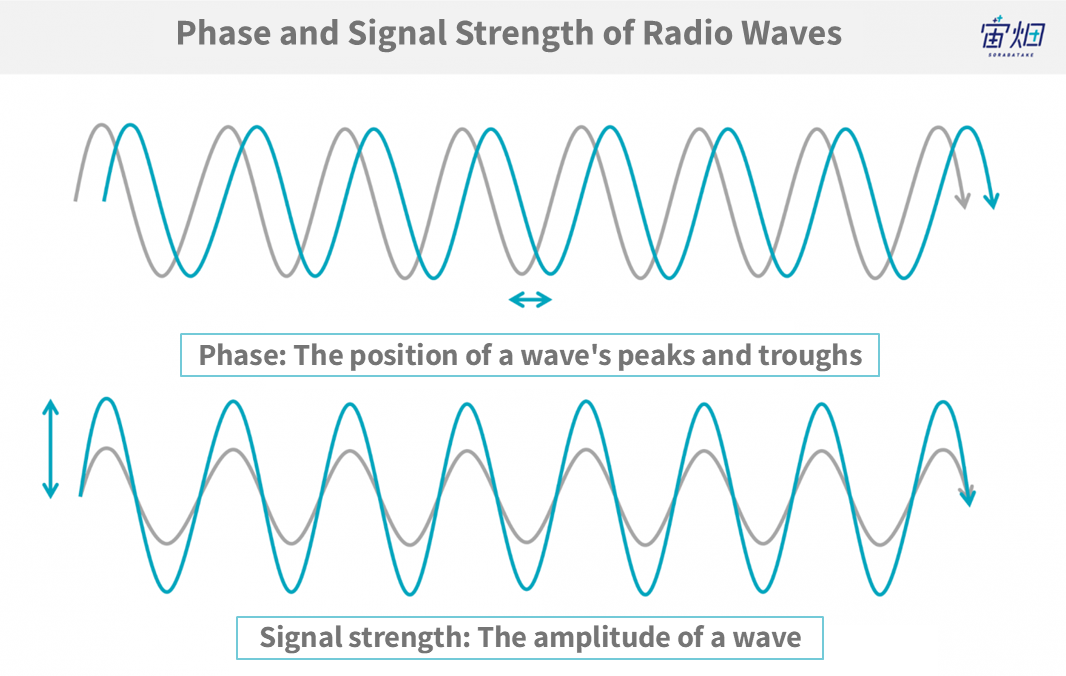
As SAR data observes the reflection of radio waves, phase information, in addition to signal strength represented by the amplitude of received radio waves, is obtained. By using the phase information specific to SAR data, analyses such as interferometric processing to understand ground subsidence and uplift, as well as advanced change extraction, can be performed.
Since artificial satellites capture a wide range while facing various directions, the captured data contains distortions and displacements, making it impossible to directly overlay it on a map.
Geometric Correction (Distortion Correction)
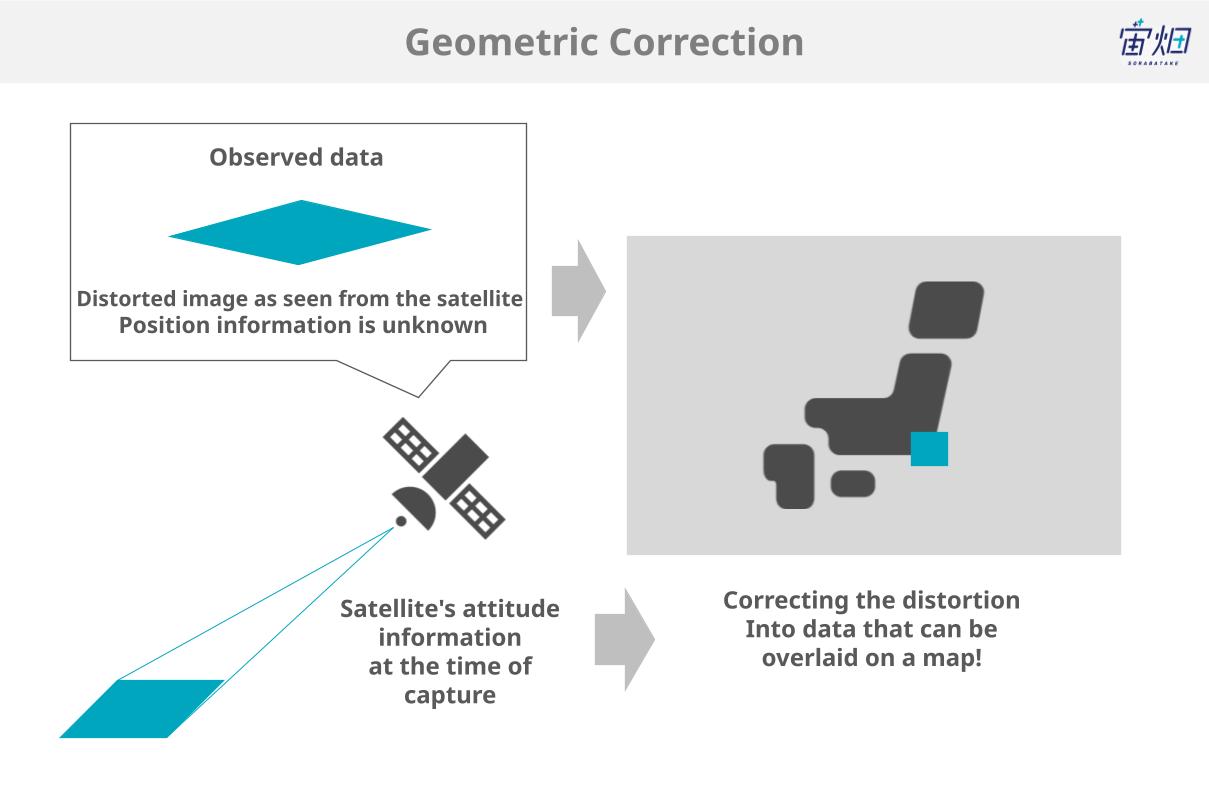
Because satellites face in various directions and take images of a wide area at once, the data they capture is distorted and misaligned, and cannot be superimposed on a map as is.
Geometric correction is the process of deforming the observed image so that it overlaps the map without distortion.
Geometric distortion is corrected by calculating the positional information on the image based on the information on which direction the satellite is observing from.
At the same time, sensor-specific distortions (mainly due to scanning methods, etc.) are also corrected.
Geometric correction also has different level names for optical data and SAR data.
For Optical Data: Geometric Correction (L1B2)
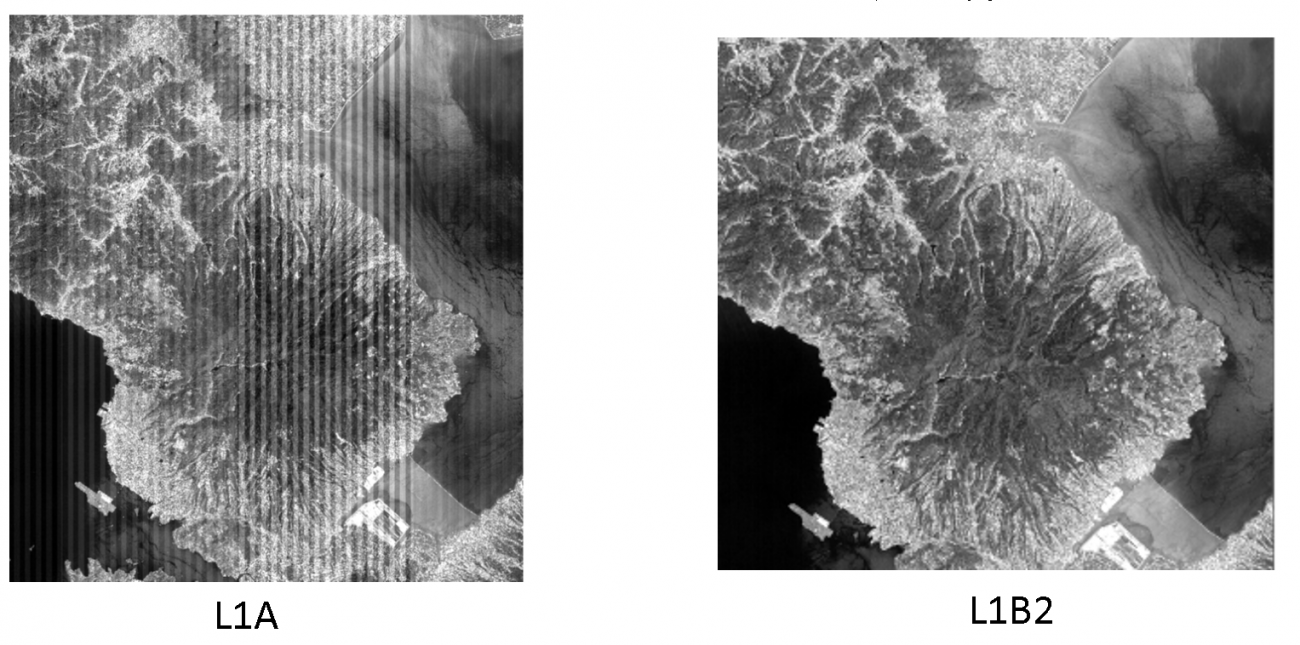
In the case of JAXA’s AVNIR-2 sensor, this level is referred to as L1B2.
Finally, after reaching this stage, a clear image without distortion is produced.
For SAR Data: Geometric Correction (L1.5)
By performing a process called multi-look processing to reduce noise, image quality is improved, resulting in amplitude data projected onto a map.
Compared to L1.1 data, surface objects are more discernible.
For JAXA’s PALSAR-1 sensor, this is referred to as L1.5.
Overlaying on a Map – Georeferencing and Geocoding
When adjusting to overlay on a map, there are two methods: georeferencing and geocoding.
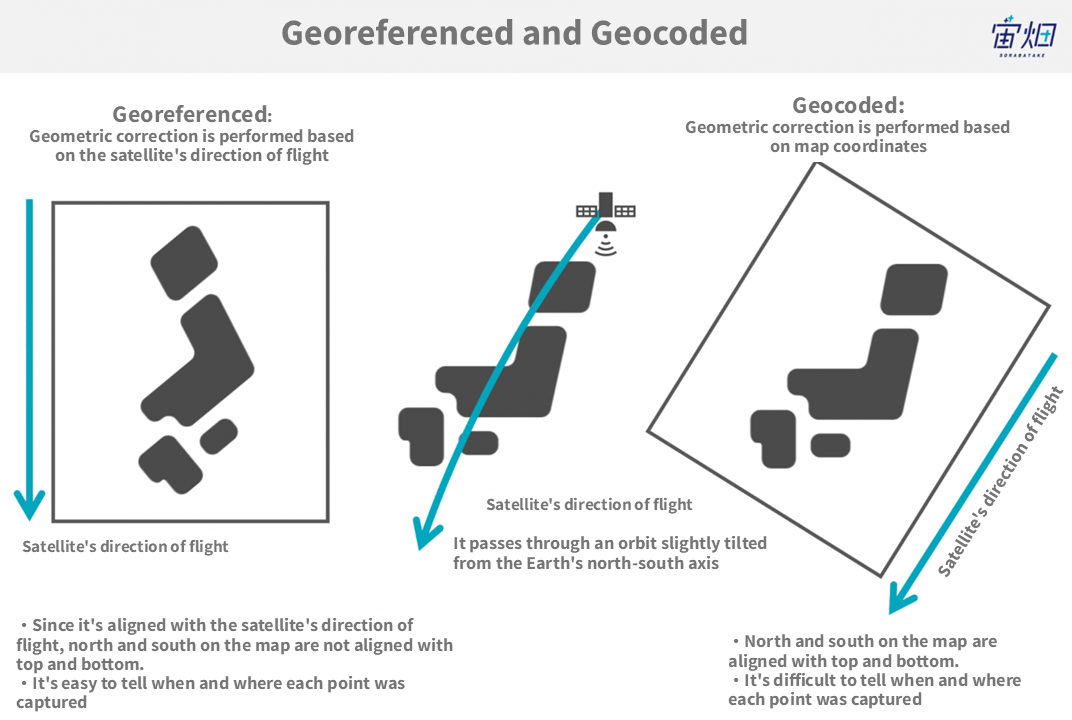
Georeferencing involves geometric correction based on the direction of satellite movement, so the scene’s top aligns with the path along which the satellite flies.
On the other hand, geocoding is projected onto map coordinates, so the scene’s top points towards the north on the ground.
In the case of geocoding, the north that we usually use on maps, being at the top, aligns, making it easier to overlay. However, because it ignores the direction of satellite movement, precise information like observation times is lost.
5. Increasing Data Value! What is Higher-Level Processing?
Higher-level processing refers to the further processing of data after completing L1 processing, tailored to specific applications.
For beginners, higher-level processed data might be more appropriate to work with.
Ortho Correction (Optical Data/SAR Data)
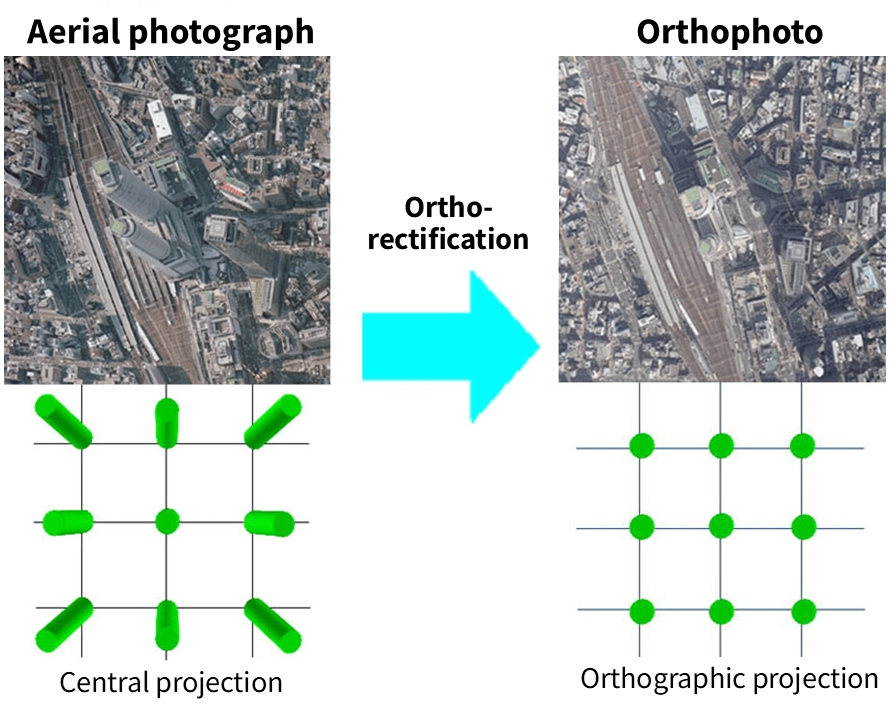
Ortho correction is the process of rectifying objects with significant elevation, like tall buildings or mountains, which may appear slanted, to look as if they were viewed directly from above. This adjustment ensures that the data perfectly aligns with maps.
In the case of commercial satellites, ortho processing is becoming standardised, and using data in this state is common.
Ortho correction applies to both “optical data” and “SAR data.”
Although ortho correction may seem versatile, there is one pitfall: what is not visible remains unseen. For instance, the side of a mountain facing the satellite is well captured, while the opposite slope is not visible.
Because ortho correction fills in the invisible parts using nearby pixels to geometrically correct them, information about the invisible parts may become uncertain. Those responsible for image interpretation in the field often use it while keeping this in mind.
Atmospheric Correction (Optical Data)
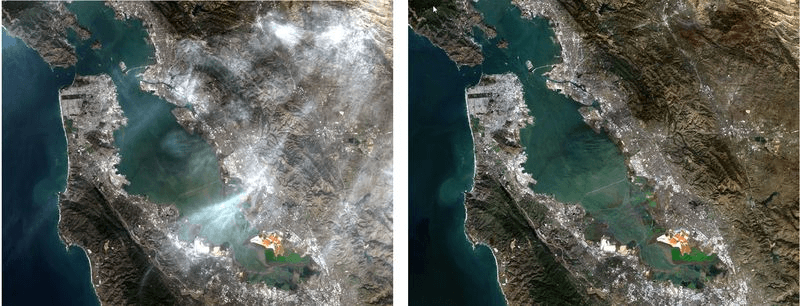
In the case of “optical data,” the condition of the Earth’s surface is observed through the atmosphere. Therefore, the data obtained is influenced by the atmosphere.
Atmospheric correction assumes the effects of scattering and absorption caused by the atmosphere, in order to offset them.
Through atmospheric correction, one can obtain brightness on the Earth’s surface that is independent of atmospheric conditions.
“SAR data” is observed using radio waves, so it is minimally affected by the atmosphere, although it is slightly influenced by the amount of water vapour in the air.
Radiance Conversion (Optical Data)
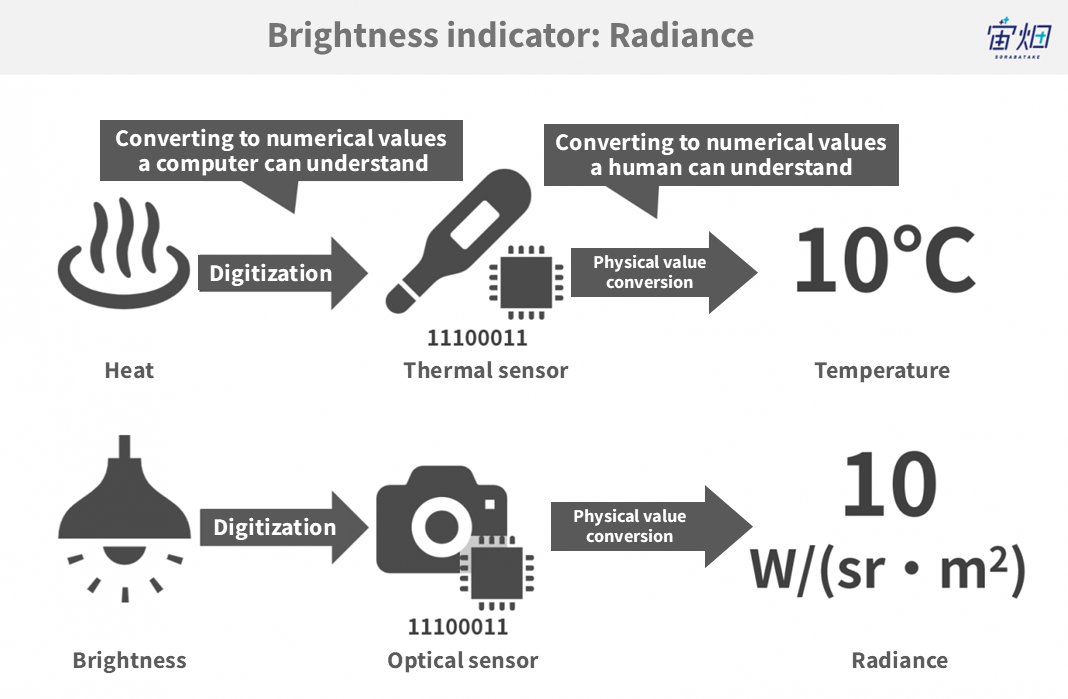
Just as “temperature” is an indicator of warmth, the brightness indicated by optical data is referred to as “radiance.”
The original data values are not in radiance but are integer values (if it’s 8 bits, it ranges from 0 to 255). By applying the formula provided for each sensor, one can calculate radiance from these values.
Note: This process itself is not higher-level processing; it is the conversion of the numerical values in the L1 product to physical quantities.
Reflectance Conversion (Optical Data)
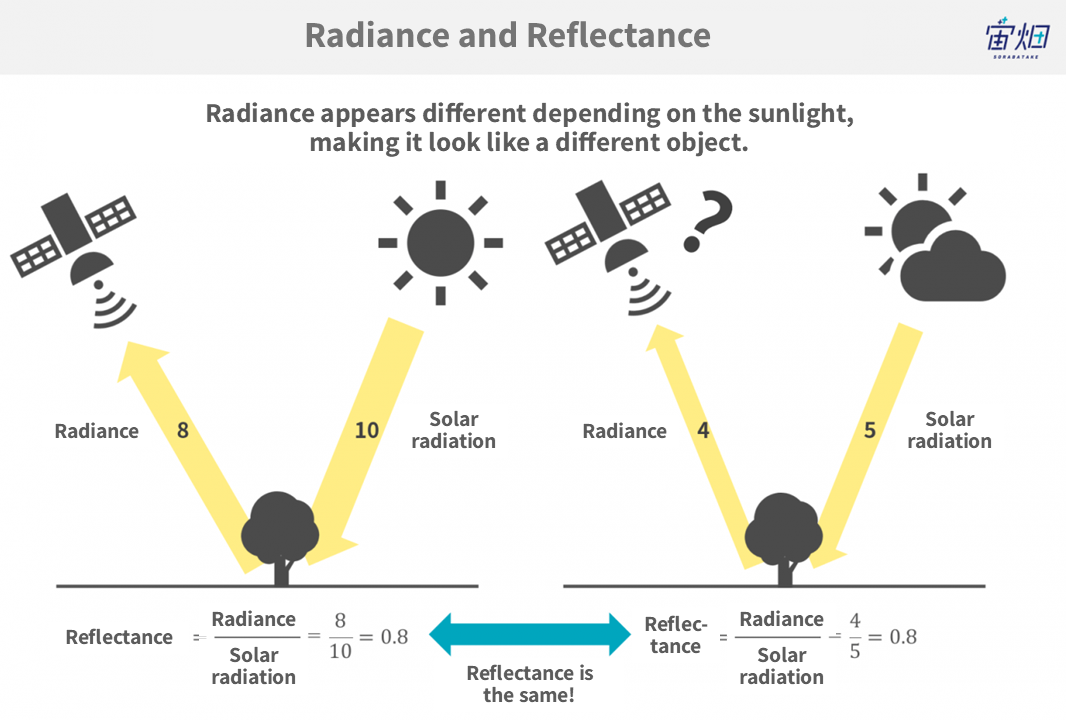
Due to differences in the intensity and angle of sunlight, the radiance of the Earth’s surface varies.
For example, the way the sun shines near the equator is different from near the North Pole, and this also changes with the seasons. To minimise this difference, it may be necessary to calculate reflectance based on radiance observed by the satellite. There are also surface reflectance and top of atmosphere (TOA) reflectance.
Slope Correction (SAR Data)
Another L2 or higher processing for SAR data is slope correction.
For example, the slope of a mountain affects the radar reflection differently on the side facing the radar compared to the opposite side. Even in the same forest, the appearance of vegetation differs depending on the slope’s orientation. This correction removes the effect of the slope using terrain data. In cases where classification is performed for large, mountainous areas, this correction may be applied.
Note: In some cases, similar processing is also carried out for optical data, depending on the scenario.
6. For beginners, ortho-corrected data is recommended
Up until now, we’ve introduced various processing steps for satellite data. Honestly, with so many processes, you might be unsure which one to use.
For those in that situation, here’s a super simple summary in the blue text below:
*2: Ground objects become easier to distinguish.
In other words, “for beginners, ortho-corrected data is recommended.”
7.For those who want to delve deeper! Recommended books and training
In this session, we provided an overview of the intricate preprocessing of satellite data. Even though this was already quite a deep dive, there’s an even more profound world out there. For those who are interested, please consider referring to the websites and books listed below!
Websites:
What is Remote Sensing? / Remote Sensing Technology Center of Japan Aerospace Exploration Agency
Satellite Learning Book / Japan Space Technology Development Corporation
Enjoy Earth Observation Images! / Space Technology General-Purpose Trainer Toshiaki Iwata's Homepage
Space API / Satellite Data Usage Research Institute
Books:
Understanding Remote Sensing from the Basics (2011, Japan Remote Sensing Society)
Fundamentals of Synthetic Aperture Radar for Remote Sensing (2009, Kazuo Ōuchi)
Training:
Remote Sensing Training Lab / Remote Sensing Technology Center of Japan Aerospace Exploration Agency
Tellus Trainer (Free e-Learning)
8. What is available on Tellus?
If you’re eager to take a look at satellite data before delving into studying it, then why not give Tellus, the official media platform of Sorabatake, a try?

Tellus Satellite Data Platform:
https://www.tellusxdp.com/ja/
Details about the satellite data and their processing levels on Tellus are listed in the data catalog.
Tellus Data Catalog:
https://www.tellusxdp.com/ja/catalog/data/
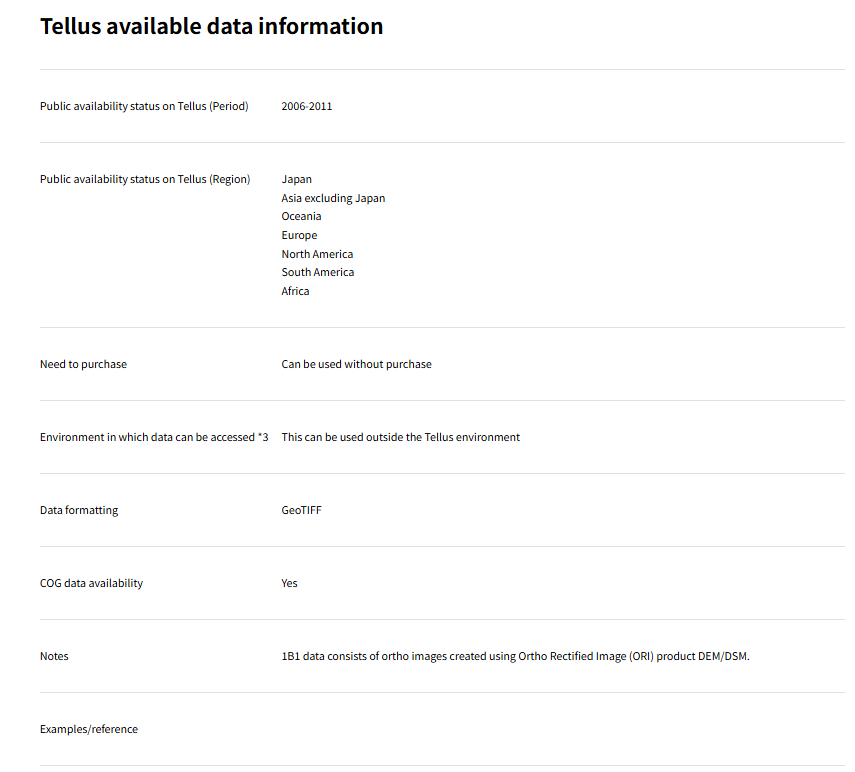
The processing level for each data is mentioned on their respective detail pages.As you’ll see, the processing levels of the satellite data on Tellus vary depending on the satellite.
At the bottom of the aforementioned data catalogue, there’s a link to the “Product Format Manual”. If you’re curious about the definitions of processing levels, I recommend checking out this manual alongside this article.
It would be great to be able to switch between tiled data and original data depending on your needs!
Understanding all the information presented in this session at once might be challenging, but by gradually mastering the intricacies of satellite data processing, you can elevate your level of satellite data analysis!
「Why not try exploring satellite data on “Tellus”?
Why not take a look at satellite data and try working with it on “Tellus,” a Japanese-born open and free data platform?
★ You can register to use Tellus fromhere.