[How to Use Tellus from Scratch] What you can do with the Satellite Data Platform and its Basic Operations.
Below is a tutorial article on the satellite data platform Tellus released on December 21, 2018. This would be an enjoyable introductory article even for those who have never dealt with satellite data.
As introduced in “Why is the Data Business of Japan’s First Satellite Data Platform “Tellus” Highly Expected? ” Japan’s first satellite data platform “Tellus” was released on February 21.
In this article, we will introduce what you can do with Tellus (https://www.tellusxdp.com/en-us/), the screen configuration and functions.
(1) What is Tellus? What you can do with Tellus.
Tellus is the satellite data platform under the open & free policy of government-owned satellite data including improvement of its utilization environment, entrusted by the Ministry of Economy, Trade and Industry (METI) to SAKURA Internet Inc.
Then, what can you do with Tellus?
For example, you can do the following things;
(a) Observe satellite data.
(b) Check whether there are plants in a specific place.
(c) Calculate the ratio of plant distribution within a certain kilometer radius from home.
(d) Compare various geospatial information side by side with satellite data.
(e) Read external data and compare it with satellite data.
(f) Superimpose people flow data on analyzed precipitation.
How to actually use it will be explained in the practical part of Chapter 4.
First of all, we will explain the screen, icon and loaded data of Tellus in this basic part.
(2) [Basics] Explanation of Tellus Screen and Icon
Tellus page: https://www.tellusxdp.com/
Let’s begin with user registration from the above URL, and this screen appears when you log in.
We will briefly introduce each function of the icons on the top, right side, and the bottom.
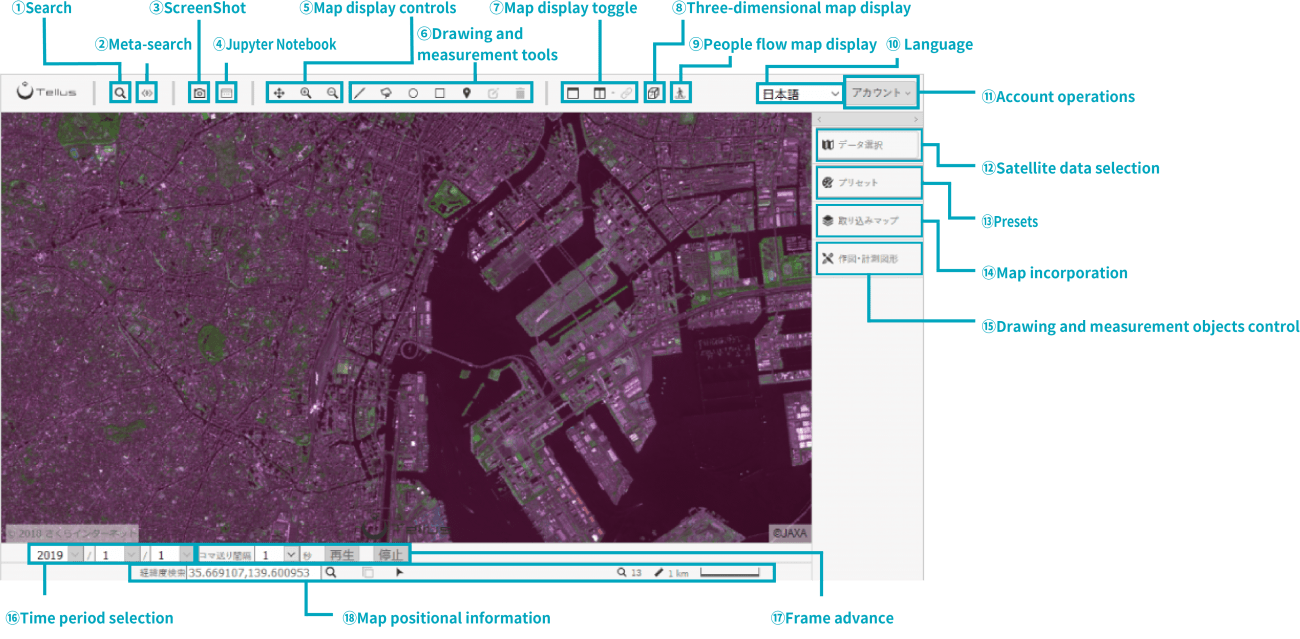
〇 On the Top
1. Search Function
Like with Google Map, you can search for a place you want to see through keywords, which display it.
2. Metasearch *Still being tested, and some functions are not available.
It is possible to search satellite data based on meta information such as cloud cover (the percentage of cloud cover in optical data) from satellite data.
3. Screenshot
Other than being able to save currently displayed maps or satellite data as a preset, it is also possible to download data in a tiff file format.
4. Jupyter Notebook
Through Jupyter Notebook, it is possible to cite the loaded data of Tellus and perform more advanced analysis.
5. Display Map Operation
It is possible to change the map location and zoom in/out on the display area.
6. Creating Measurement Graphics
It is possible to measure the distance or area by laying out measurement graphics on the map.
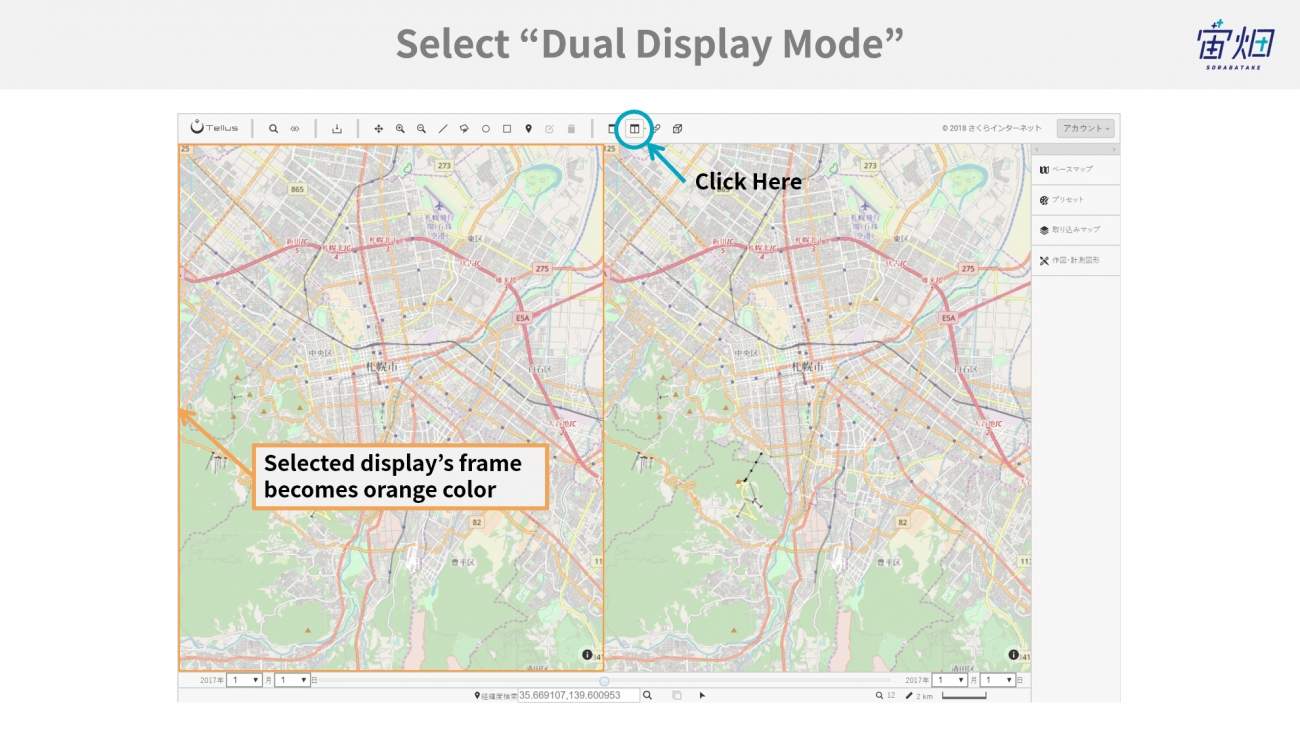
7. Map Display Method
It will switch map display methods. There are three types of display styles such as standard full screen, two-split screen, and the special full screen which superimposes other satellite data on half the screen.
8. 3D Map Display
It can display a 3D representation map. Other operations such as superimposing measurement graphics on maps cannot be done when the 3D map is displayed.
9. People Flow Map Display
It can display a map that draws people’s GPS information. People mapping is limited to Tokyo’s 23 wards. Other operations such as superimposing measurement graphics on maps cannot be done yet when the people flow map is displayed.
10. Change Language
It can switch displayed languages between Japanese and English.
11. Account Operations
In addition to being able to update account information in “my page”, log out processing and inquiries are possible.
〇 On the Right Side.
12. Satellite Data Selection
It switches currently displayed satellite data and adjust displays.
13. Preset Switching
It switches the displayed satellite data by calling up a saved preset.
14. Map Import
It will import map information and satellite data from external files.
15. Measurement Graphic Operations
It can adjust the display of currently laid out graphics or delete them.
〇 On the Bottom
16. Display Time Operations
It is possible to change the reference time of displayed satellite data.
17. Frame Advance
Select data which include data of several time periods, and you can see them frame by frame.
18. Display Map Location Information
It displays location information of currently displayed maps.
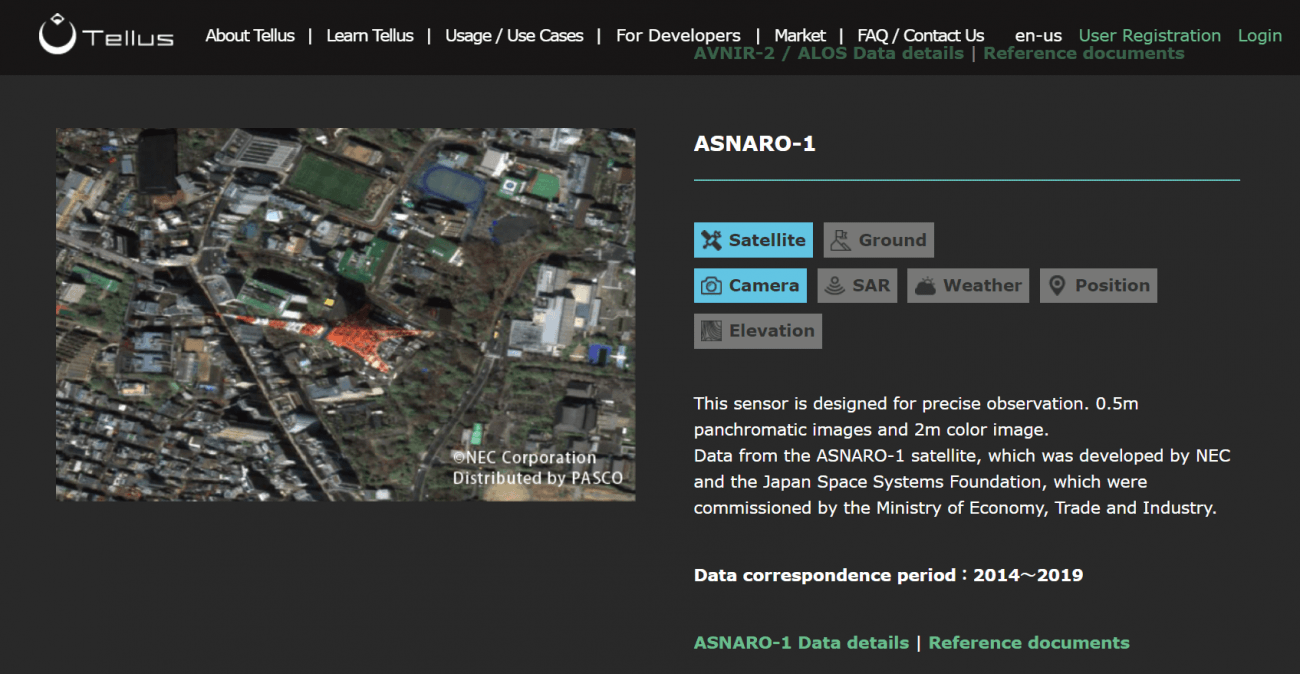
(3) [Basics] Explanation of Default Loaded Data of Tellus.
Not only is satellite data loaded on Tellus, but also several other open ground data is also available.
Data loaded by default would be updated from time to time, so please check Tellus Data Catalog (https://www.tellusxdp.com/ja/dev/data)!
It may be hard to tell what you can do just by looking at the types of data.
So, now we will actually explain the procedures of “what you can do with Tellus.”
(4) [Practice] Basic Operations and Actual Procedures of Tellus.
Now that we have understood the screen configuration of Tellus, we will introduce six procedures you can do with Tellus introduced at the beginning.
(a) Observe satellite data.
(b) Check whether there are plants in a specific place.
(c) Calculate the ratio of plant distribution within a certain kilometer radius from home.
(d) Compare various geospatial information side by side with satellite data.
(e) Read external data and compare it with satellite data.
(f) Superimpose people flow data on analyzed precipitation.
(a) Observe satellite data.
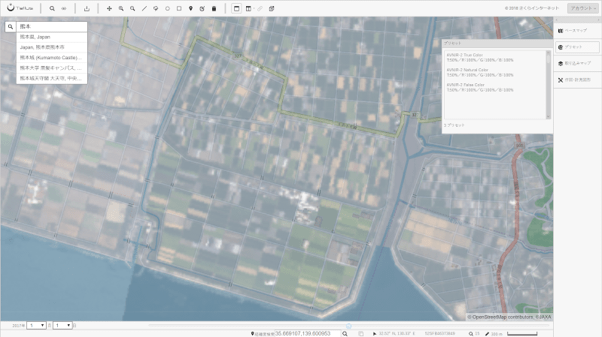
First of all, let’s just observe satellite data.
If you select “AVNIR-2 true color” in “preset” on the right, you can observe the satellite image taken by DAICHI (ALOS) with the colors visible to human eyes. Since it can be observed in a superimposed state on the open street map, it became easier to understand the city structure compared to just checking satellite data.
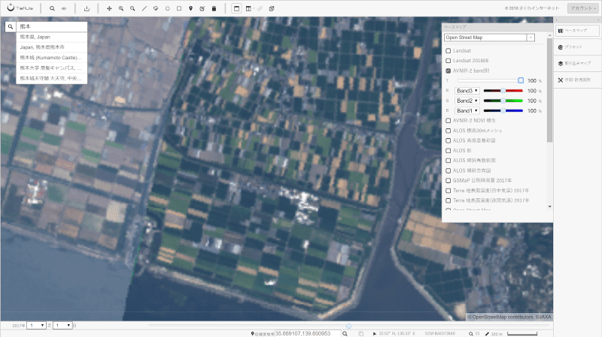
The transmittance is 50% by default, so select “base map” on the right to reset “T” to 100% when it is originally set to 50%. You can change the transmittance of such layers.
The open street map will be transparent and cannot be seen when adjusted to 100%, so satellite data is only observable.
Then use the search button on the top left, and please freely search your favorite places.
For example, you can do things such as “Let’s Find a Great Beach” (https://sorabatake.jp/1322/) or “Making my own History Using Satellite Data” (https://sorabatake.jp/809/) in the Sorabatake satellite data utilization articles.
(b) Check whether there are plants in a specific place.
The satellite data can visualize light besides that visible to the human eye (visible light). Infrared light rays (NIR) can be used on Tellus. You can assess the presence or absence of plants using NIR.
Tellus preset “AVNIR – 2 false color” is designed to display in red where plants are located.
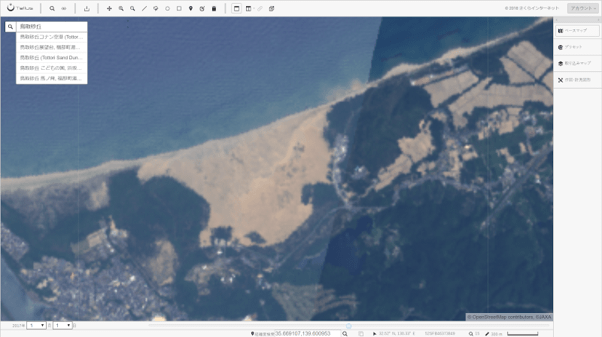
For example, if you take a look at Tottori Sand Dunes, you can see something black in the sand with the visible light on the left. Is the sand color of the dunes different, or are there any other different substances?
First, click the comparison screen on the top.
Then, click the satellite data on the right and if you make sure that it is surrounded by an orange border, let’s click preset “AVNIR-2 false color” to set “T” to 100% on the base map.
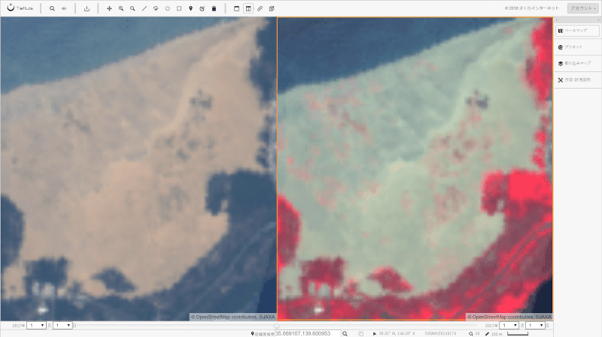
Then the answer would be obvious. You can see something red in the Dunes, that is, plants seem to exist in the Dunes.
However, some places are not red, black areas in visible light mode.
We have actually visited Tottori Sand Dunes.
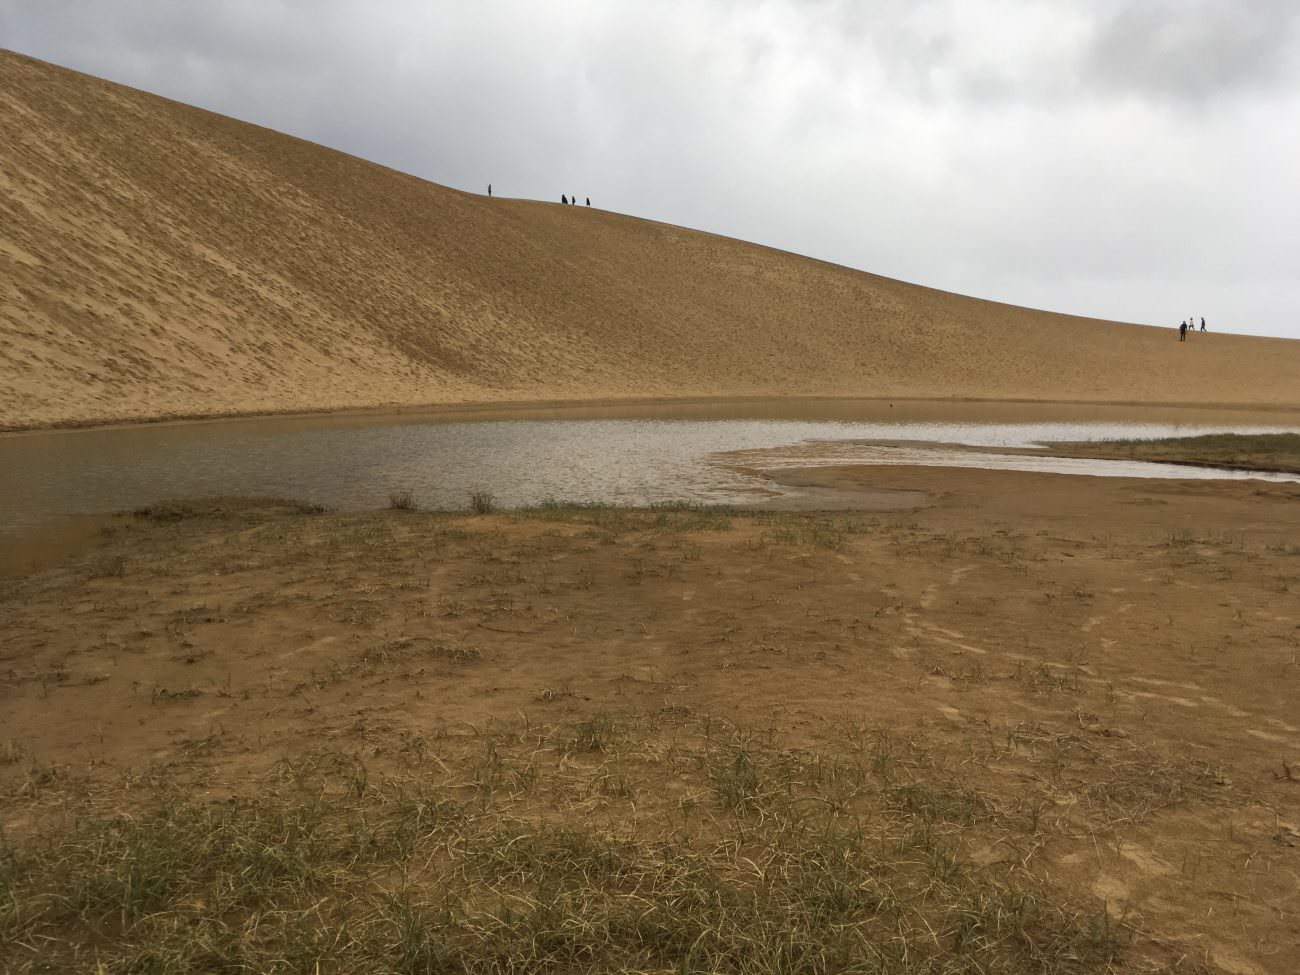
A small pond is located here.
You can do things such as “Guessing Grand Slam Tennis Court Surfaces” just by using Satellite Data, (https://sorabatake.jp/889/) using “False color.”
(c) Calculate the ratio of plant distribution within a certain kilometer radius from home.
Tellus is recommended to those who are looking for “a house surrounded by lots of greenery.”
*We are not sure how many people there are in that area though, haha.
First, set “T” to 100% in preset “AVNIR-2 false color.”
Then, select “circle” in measurement graphics and let’s draw a circle with any size radius.
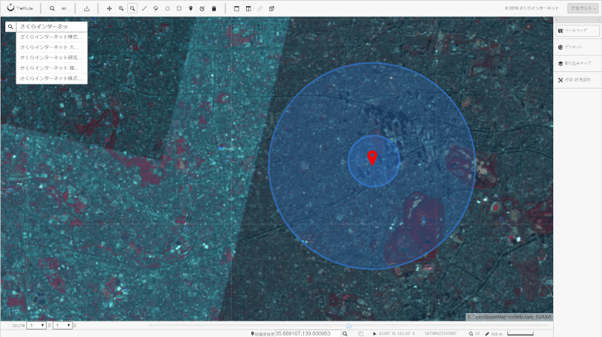
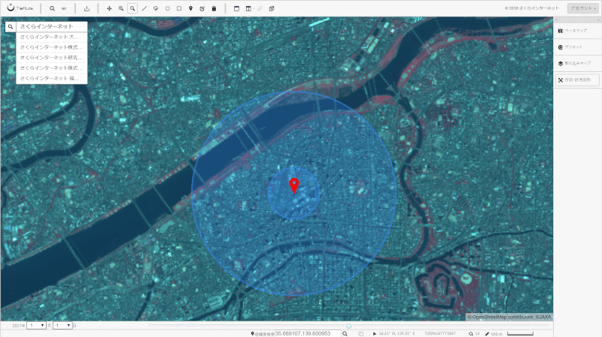
This time, we compared the percentage of plants within a radius of 2 kilometers from the Osaka Headquarters with that from the Tokyo Office of Sakura Internet Inc.
Although it is only a visual observation, it turns out that there seem to be more plants around the Tokyo Office.
Please also refer to the article “Are there really more US Democratic Supporters in the Cities? Verified with Satellite Data.” which was answered by comparing and analyzing land data with satellite data.
(d) Compare Various Geospatial Information side by side with Satellite Data.
The attraction of Tellus is that it loads not only satellite data but also several open ground data by default.
We will introduce an example of what we can tell by comparing satellite data and ground data and such procedures in practice.
First, click the comparison screen on the top.
Then, select “AVNIR-2 NDVI Vegetation” (Satellite data) from the left screen, and “Survey on Trends of Land Use for Housing-Capital Region (GSI (Geospatial Information Authority of Japan) map)” (Ground data) from the right screen.
As for more complicated examples, the following are also shown on the right.
Left: AVNIR-2 NDVI Vegetation (100%).
Colored Elevation Map 5-15 (GIS map) (50%).
Right: Survey on Trends of Land Use for Housing-Capital Region (GIS map) (100%).
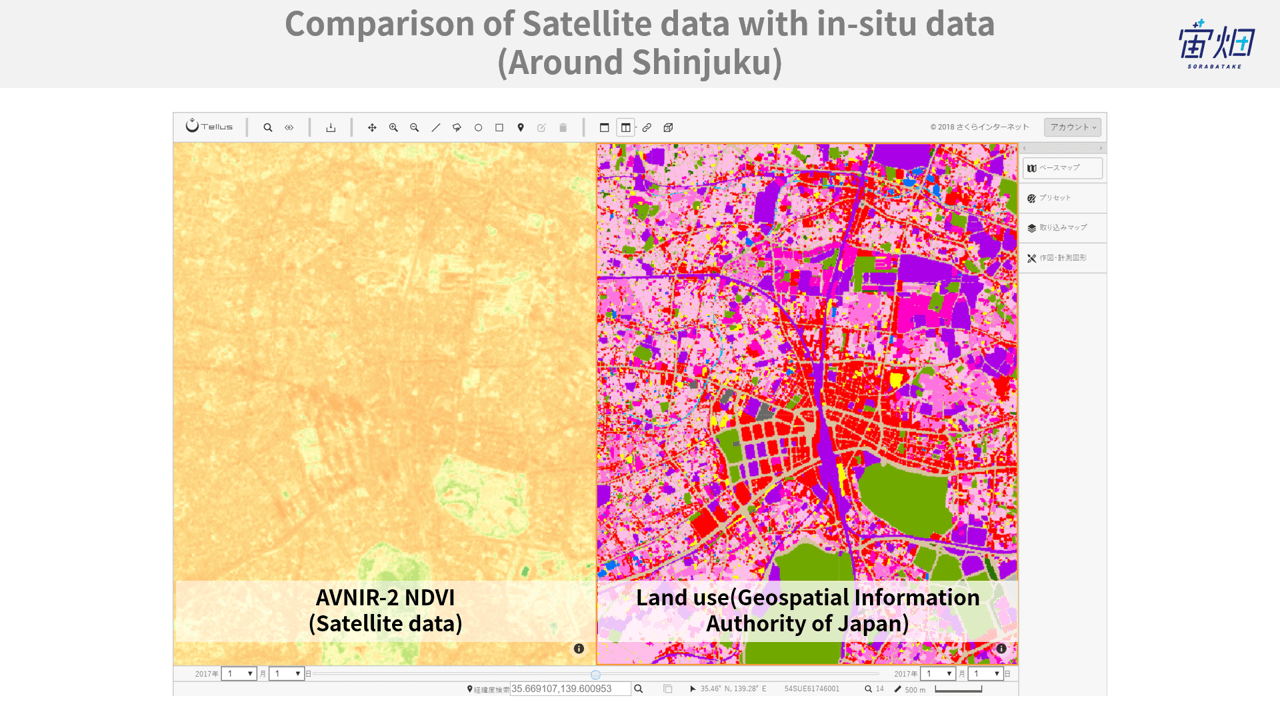
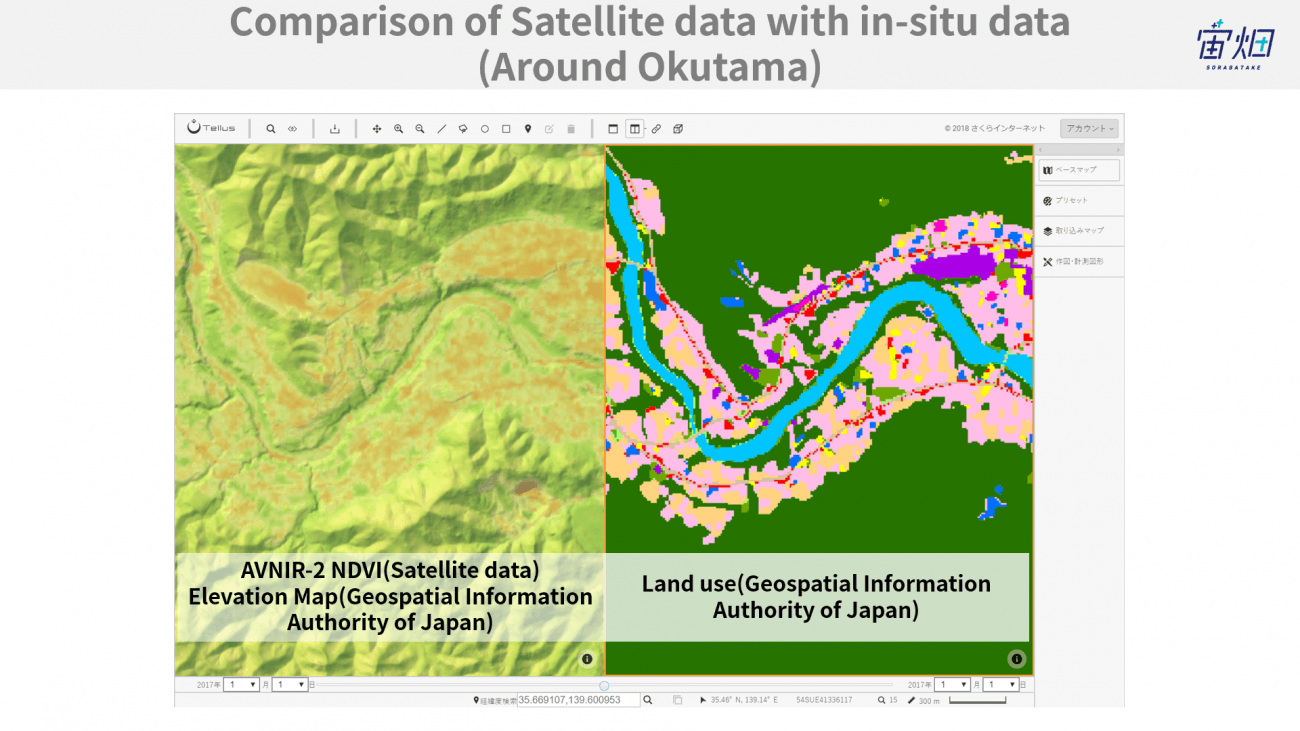
We can tell that the vegetation index is low in a residential area (orange indicates low index and green high) from the left figure.
We can tell from the right figure that the vegetation index is high in a non-residential area, and there is a residential area on flat land.
Although these are simple examples, if you keep comparing the maps while superimposing several other layers, you may be able to obtain new findings which confirms such a relationship.
(e) Read external data and compare with satellite data.
Tellus can import map information and satellite data from external files.
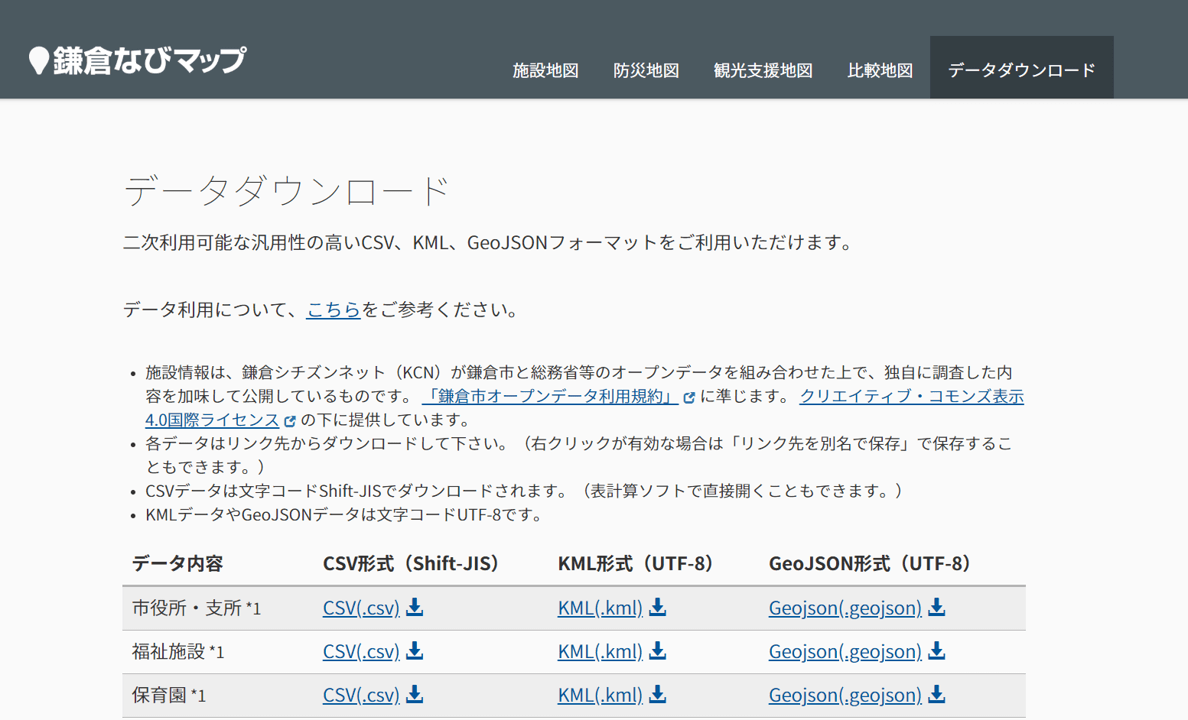
Currently, it can import GeoJSON format data, so let’s find the sites where such data is collected.
For example, in “Kamakura Navimap” (http://navimap.kcn-net.org/data.html), you are able to download the GeoJSON format data including various facilities, public toilets, and free Wi-Fi spots in Kamakura.
We will use it this time.
First, access Kamakura Navimap and download the data.
And import the data to Tellus.
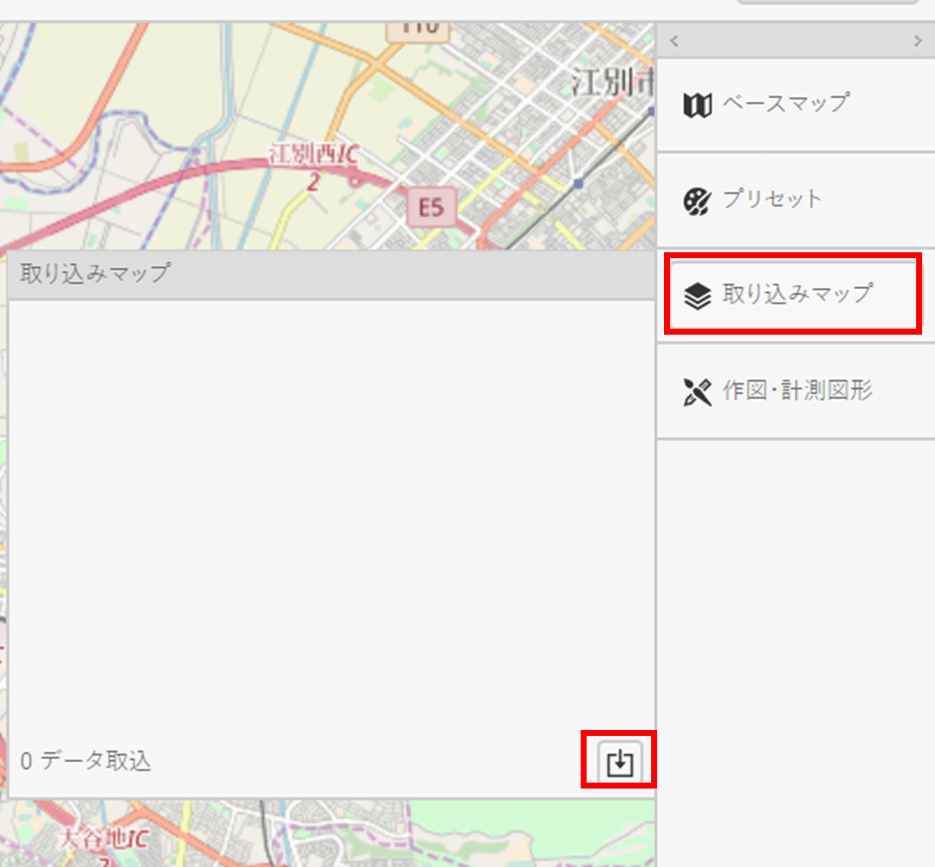
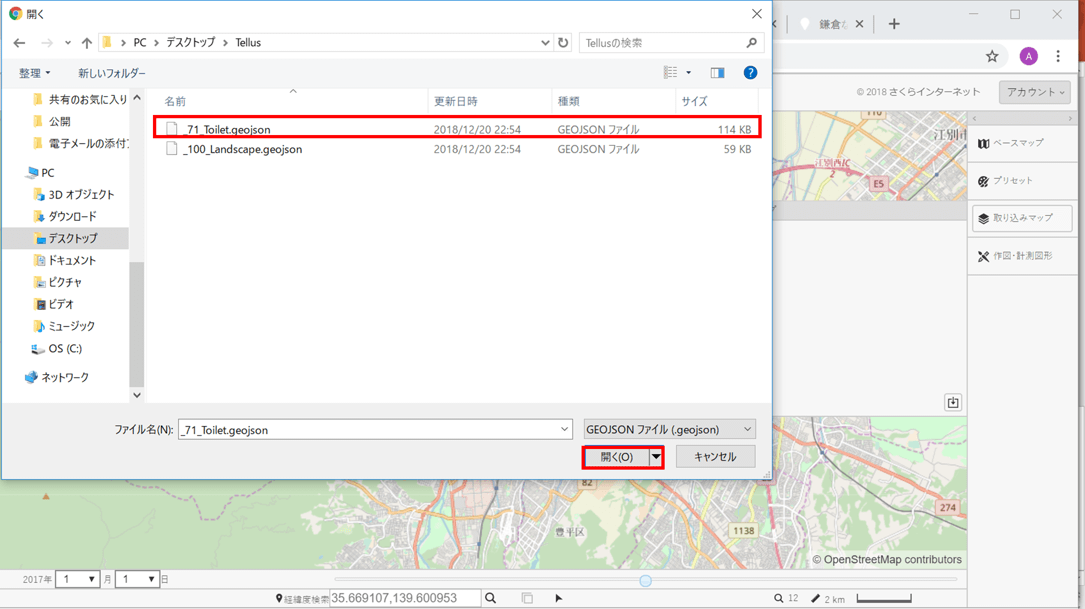
Download the data of 100 landscapes and public toilets, and import the data downloaded from “imported map.”
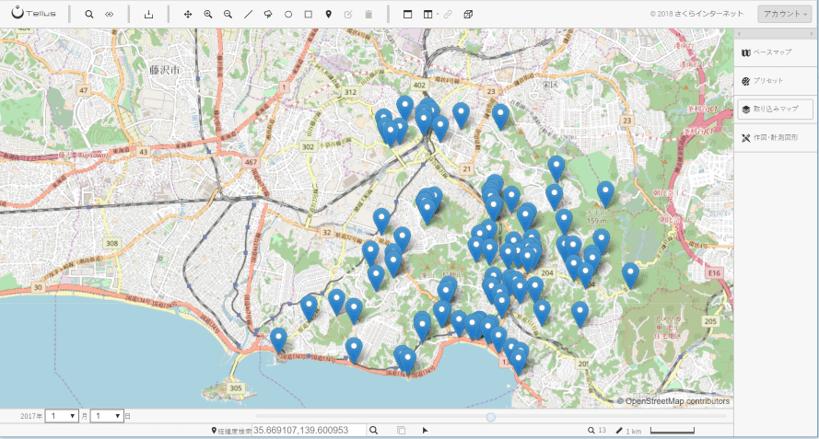
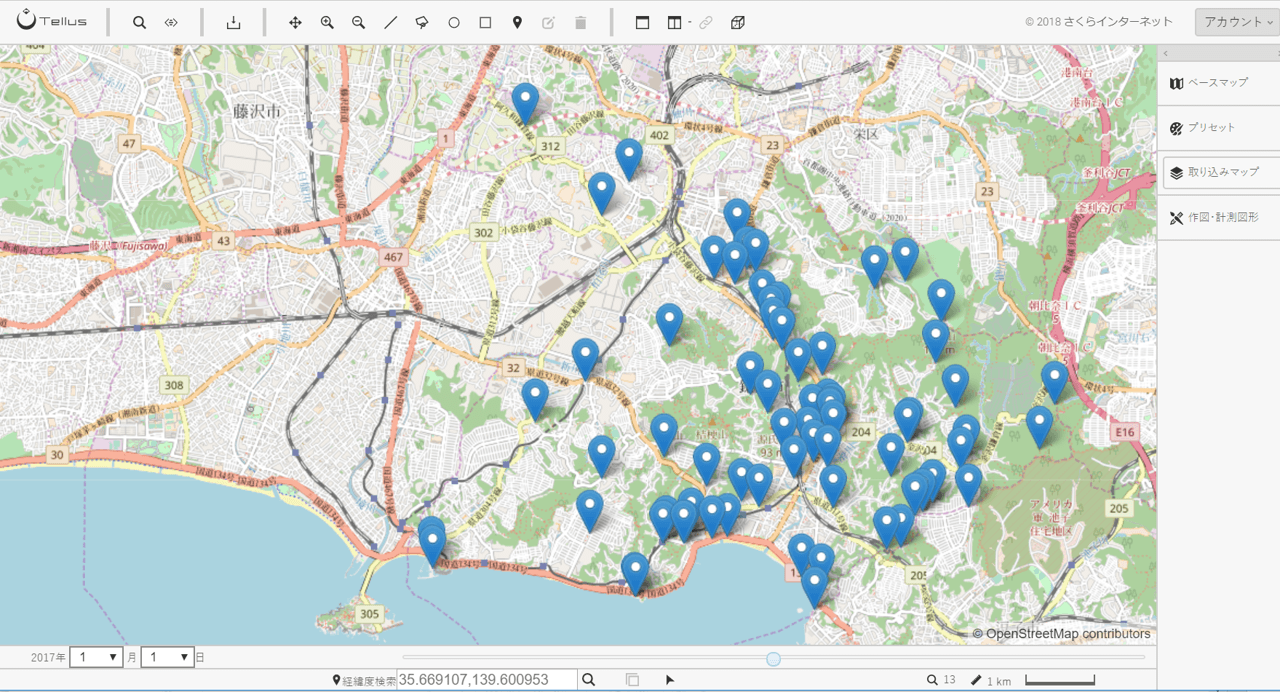
It came out!
Apparently, we can tell that public toilets are concentrated along the coast, and there are few in east Kamakura where the 100 landscapes are concentrated.
When we have a chance to sightsee in Kamakura, we are now able to choose a time to go to restrooms based on sightseeing spots.
(f) Superimpose people flow data on analyzed precipitation.
Click the people icon on the top of the screen and enlarge the Kanto region, and you can see many red dots.
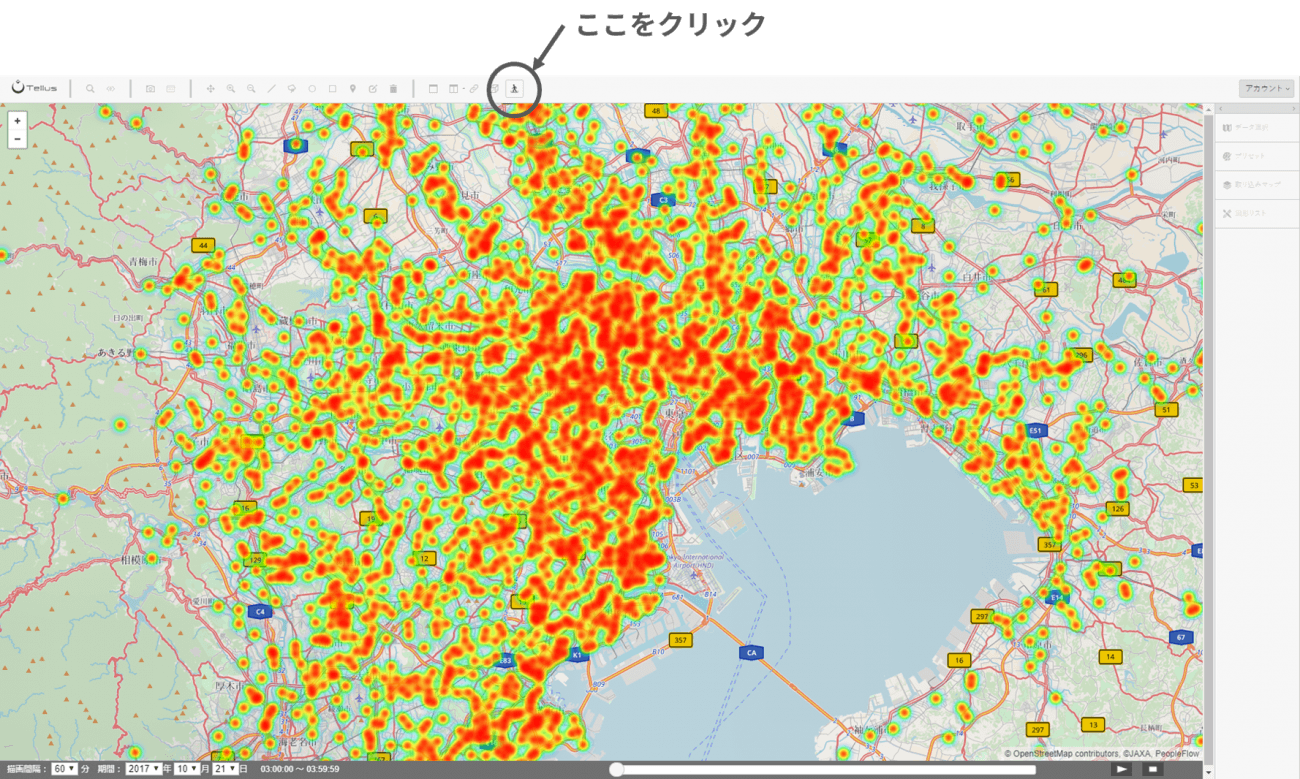
Those dots are data on location information obtained from mobile phones.
You can set the date and the required time period in the bottom left corner of the screen and see the movement of people flow using the play button in the bottom right corner.
Those dots are data on location information obtained from mobile phones.
You can set the date and the required time period in the bottom left corner of the screen and see the movement of people flow using the play button in the bottom right corner.
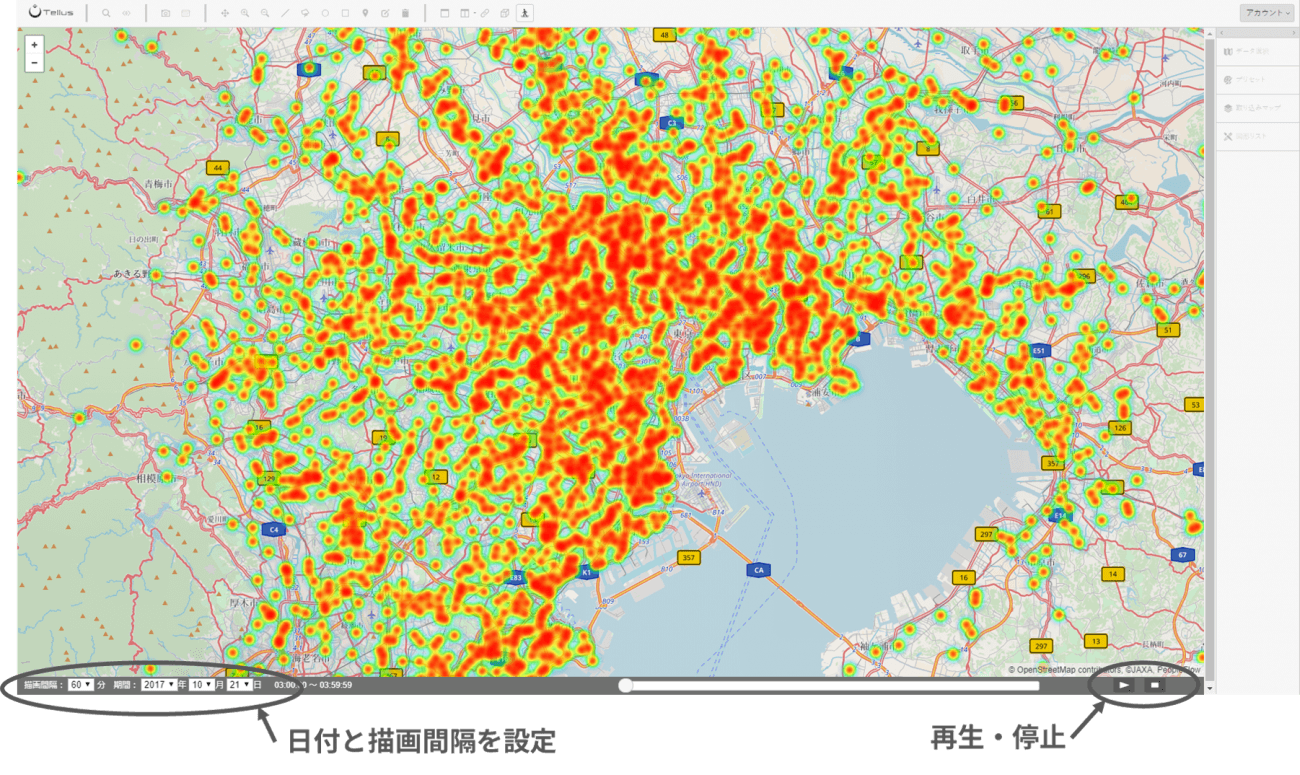
As you watch the playback video, you can see how people commute to the city center.
In addition, you can see that the background color changes from time to time.
It is superimposing the GSMaP precipitation data.
For example, if we analyze how people move at times of heavy rain by superimposing precipitation data on people flow, although in this case the resolution is coarse, this could be utilized for taxi dispatching or locations to open stores.
(5) Now, let’s start up Tellus OS!
The above information explains how to use Tellus OS.
We hope you can imagine what you can do with Tellus OS.
Please sign up for Tellus and experience satellite data in practice!
▼ Sign up for Tellus from here.
www.tellusxdp.com