Using Lightning Observation Data for Free! Learning About the Science Behind Different Types of Lightning
A long long time ago, lightning used to be feared. Even today, it still has a large impact on our everyday lives in the form of power outages and lightning surges. Lightning observation data allows us to understand when and where lightning will strike. Today, we will be looking into what causes lightning, and getting to learn how to use Tellus' lightning data.
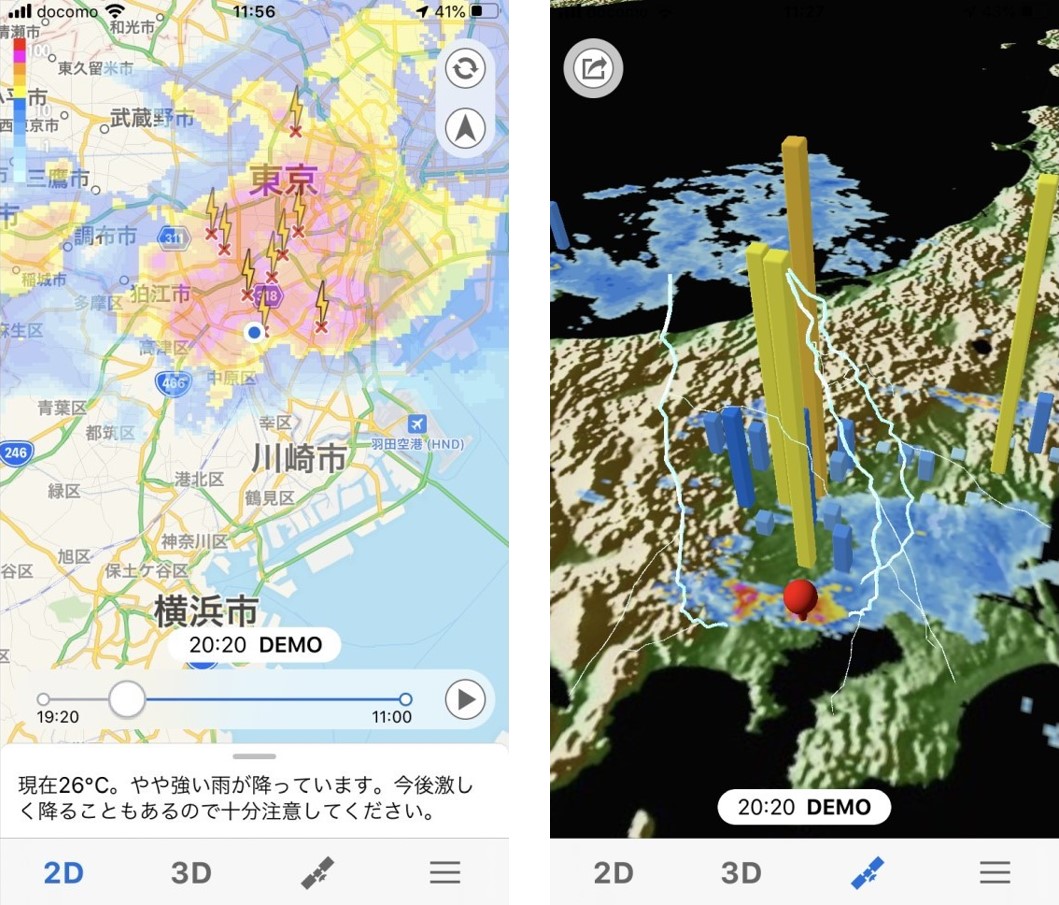
Shimadzu Business Systems Corporation is a Japan Meteorological Agency forecast permit holder that uses climate data to run a series of weather apps. The free to use “Amemiru” (rain watch in English), is one of their more popular apps that shows rain forecasts using AR. Amemiru uses a combination of data from precipitation radars, images from the “Himawari” meteorological satellite, and lightning data.
Shimadzu Business Systems provides precipitation observation data, precipitation forecast data, and lightning observation data to Tellus market. Their lightning observation data is a unique type of data that can’t be found anywhere else so please give it a try on Tellus OS.
1. Climate and Lightning Data
The Science Behind Lightning
It is well known that lightning is a discharge of electricity, but how exactly does that electricity build up?
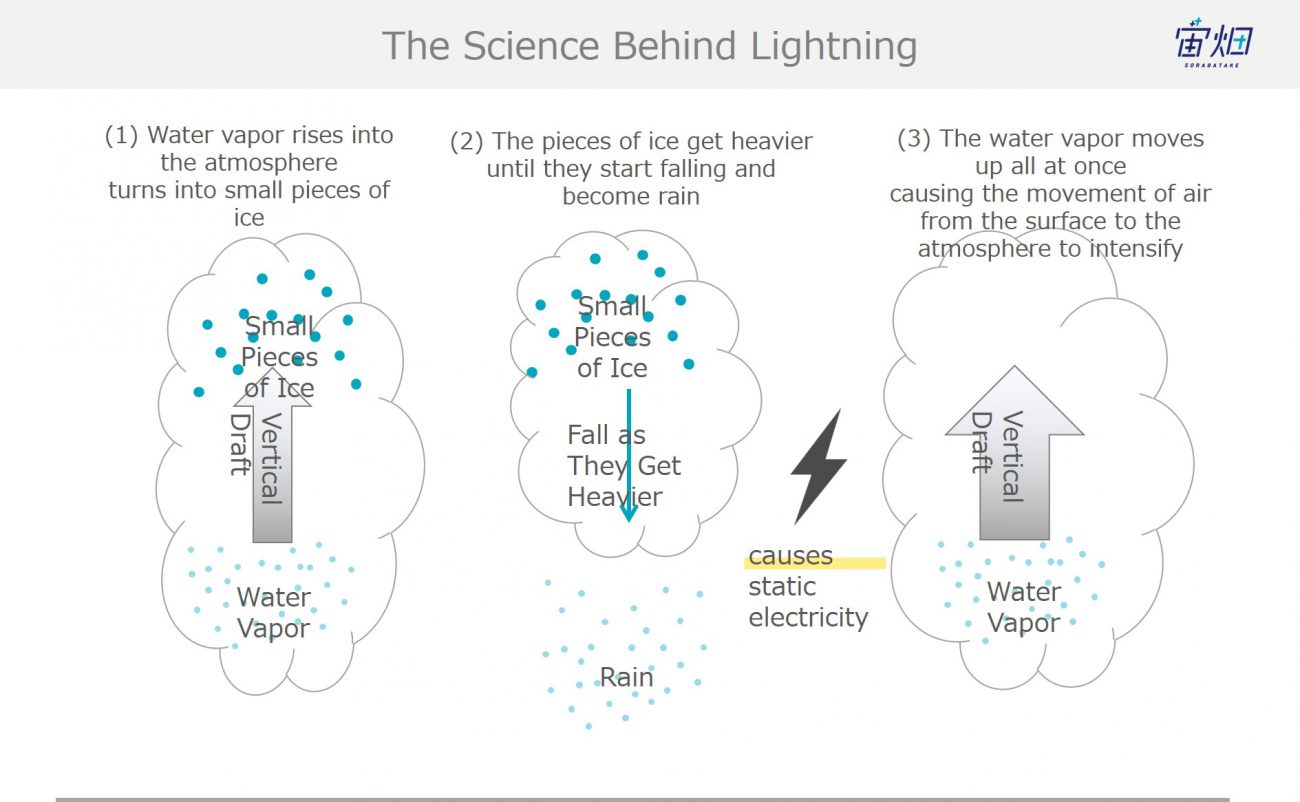
Clouds are made by hot air rising off the earth’s surface up into the sky where the water vapour inside the air slowly cools and eventually freezes into small pieces of ice. When the small pieces of ice begin to clump together, they start to fall back down to the earth’s surface. The falling ice then melts into rain.
When certain conditions are met and a lot of water evaporates at once, the movement of air from the earth’s surface up into the atmosphere gradually gets more intense. As air is rapidly pushed up, it carries small pieces of ice which crash into pieces of ice that are falling from the sky. This collision creates electricity and causes polarity, leading to a buildup of static electricity. When this accumulates in the atmosphere to a certain point, electricity discharges to the earth’s surface or to another cloud. This is what causes lightning.
It sounds pretty simple, right? Real lightning discharges are very different from the kind of electricity created in laboratories. Air acts as a very good insulator, and since there is only about 1 km of air between the earth’s surface and the thunder clouds, electrical discharge isn’t something that happens very easily. There are actually a few phases to a lightning strike.
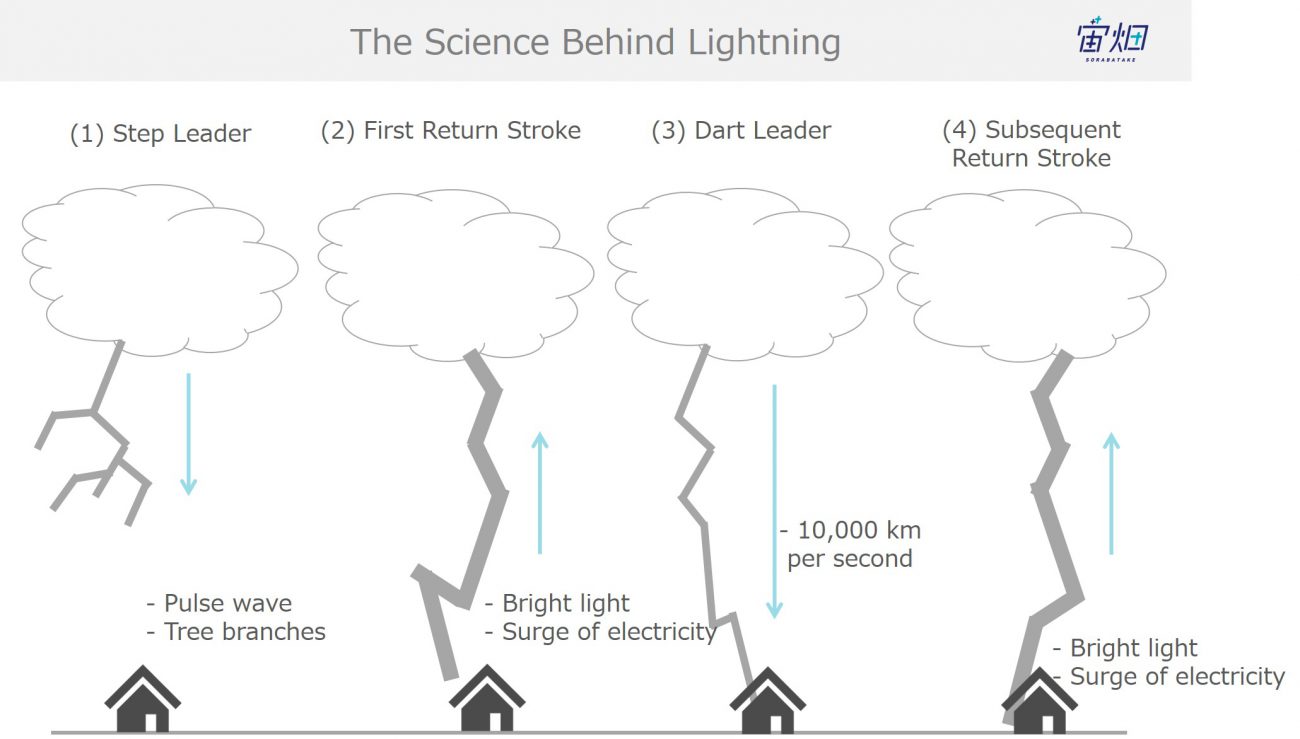
(1) Stepped Leader
A bolt of lightning starts with a relatively large pulse (a wave that happens in a very short period of time). This bolt travels down a series of steps at roughly 100 km a second towards the earth’s surface. This is why you see branch like patterns when you see a flash of lightning.
(2) First Return Stroke
When the lightning bolt reaches the surface of the earth, it travels about a third of the speed of the light back up the path it came, while letting off a bright light. There is on average around 30 kA of electricity flowing through the lightning bolt at this point.
(3) Dart Leader
After this, electricity is discharged from the clouds along the same path, falling at about 10,000 km per second.
(4) Subsequent Return Stroke
When it gets close to the earth’s surface, it shoots back up a flow of electricity.
(5) In one electrical discharge, this process repeats about four times before ending.
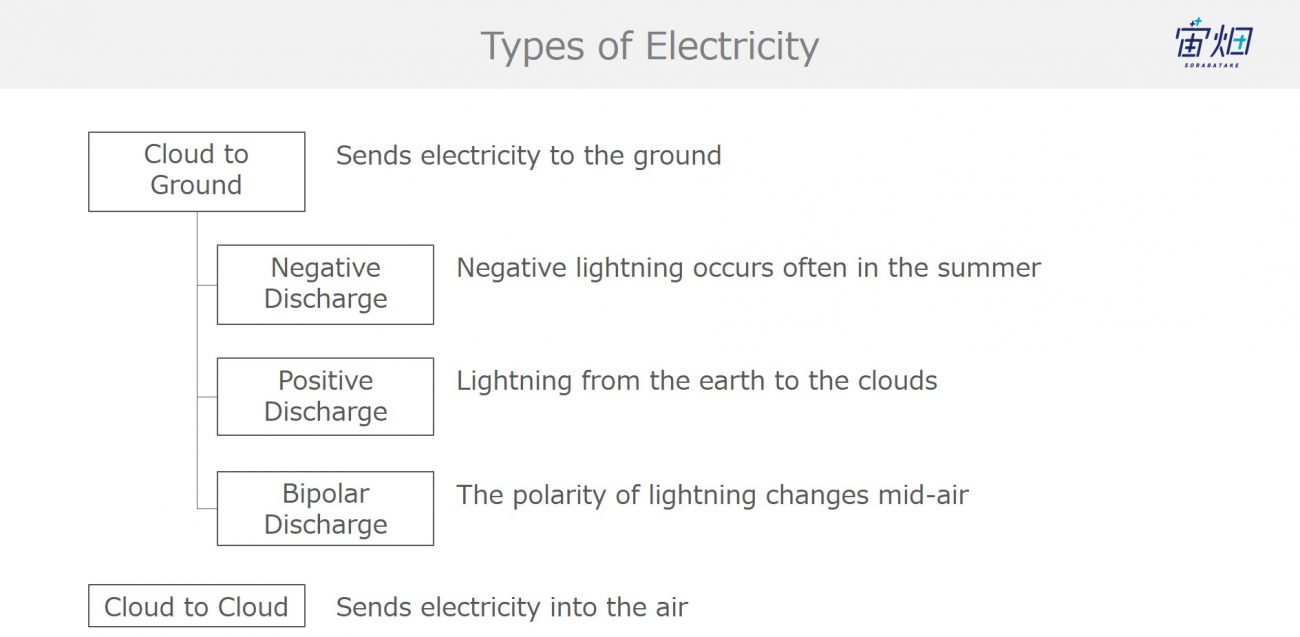
There Are Different Types of Lightning!
There is cloud to ground lightning and cloud to cloud lightning. For cloud to ground lightning, there is negative lightning that occurs a lot in the summer, and there is also positive lightning which flows from the ground to the clouds.
Just before, we talked about how small pieces of ice create electricity by crashing into each other, however, depending on the cloud’s temperature, there are spots that create positive energy and spots that create negative energy, creating a complex composition of polarity.
The summer sees about 90% of the cloud’s electricity being negative, but more than half of the clouds around the north pole during the winter are positive. Most positive lightning releases only a small amount of electricity, although occasionally there is lightning that reaches over 200 kA that strikes seemingly out of nowhere without any warning called a superbolt.
The Sea of Japan Sees More Lightning Strikes?! The Cloudiest Place in Japan Is Kanazawa
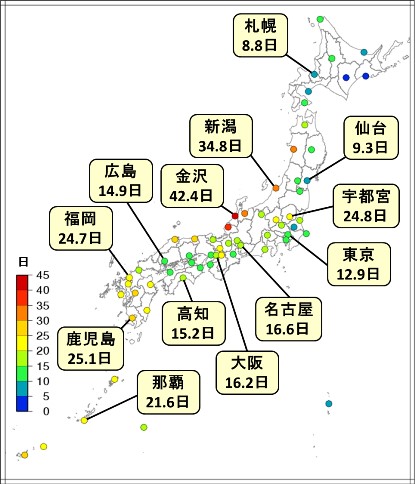
30% of lightning damage occurs in August, and is about 2 times more likely to occur on the Pacific Ocean side of Japan than the Sea of Japan side, but the coastal area between the Tohoku and Hokuriku regions along the Sea of Japan have more cloudy days. Kanazawa sees the most cloudy days, with 42.4 days a year.
The voltage of lightning is over __ volts! What is Lightning Damage?
Lightning gives off electromagnetic waves of various frequencies, from direct current (frequency 0Hz) to X-rays, so people used to say that the radio cutting out meant that lightning was close.
Since the amount of electricity emitted is very large, even if the lightning doesn’t directly strike a power line, they can act as antennas which receive shocks at very high voltage, capable of going higher than a few kilovolts. These are called “induced lightning surges”.
A surge like this only lasts for a few microseconds, but can still cause damage to electric equipment or make them malfunction. To prevent this, it is recommended to use a power supply tap with a built-in varistor.
How the Japan Meteorological Agency Parses Lightning Observation Data
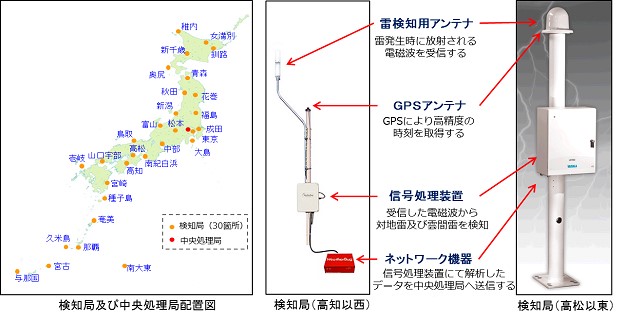
Japan Meteorological Agency operates a lightning detection system called LIDEN (LIghtning DEtection Network system) to keep airport equipment and airplanes safe. Of the different kinds of electromagnetic waves given off by a lightning strike, lightning detection stations placed at 30 different spots around the country gather information on LF waveforms of lightning.
The lightning observation data is updated in real time by using the LIDEN lightning detection system.
2. An Introduction of Lightning Observation Data that can be Used on Tellus
There are two types of lightning observation data available on Tellus The first shows the observed value of lightning on a map, called “lightning observation”, and the second is a way to gather the “lightning observation data” by using an API obtained from the Tellus OS developing environment.
The types of lightning observation data includes:
■Observation Data
■Location
■Latitude and Longitude
■Type of discharge (cloud to cloud, cloud to earth).
Let’s check out the free to use data from 12:00 AM Sep. 9, 2019 – 11:59 PM Sep. 10, 2019.
To view the data, registering an account on Tellus and buying the data on the Tellus Market are both required.
*the data is available in real time by LIDEN since Nov. 7, 2017 and is planned to be sold on Tellus Market.
3. How to View it on Tellus OS
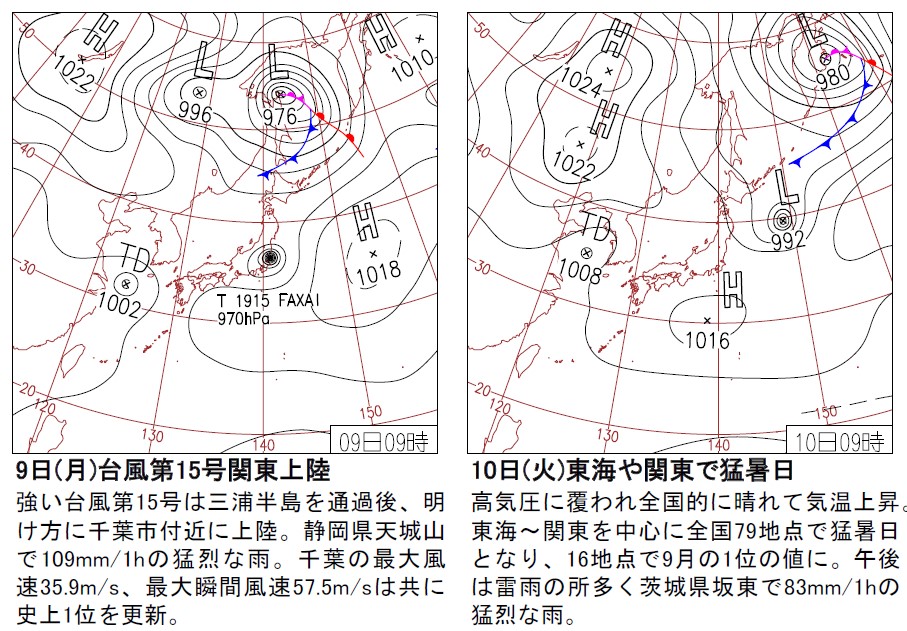
The free period shows the day after typhoon-15 hit land in Japan from 2019. This typhoon (Typhoon Faxai) passed the Miura peninsula at around 3:00 AM on the 9th, and landed near Chiba city on land just before 5:00 AM, making its way east afterwards. Areas that were hit hard in the Tokai region saw up to 300 ml in rainfall, with the Kanto region seeing up to 200 ml.
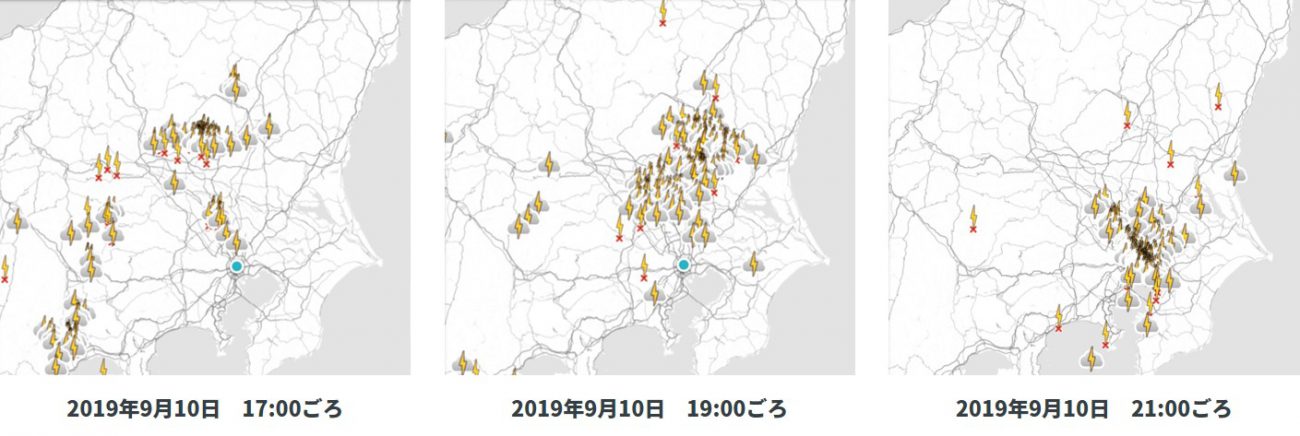
When the typhoon was passing, there was very little lightning in the Kanto region, but on the 10th, the next day, brought moisture which triggered widespread lightning strikes. At around 5:00 PM on Oct. 10, there were thunderclouds all over northern Kanto, many of which were observed to gradually move south, reaching Tokyo by 7:00 PM.
You can see how by 9:00 PM on the same day, the thunderclouds have gathered around Tokyo Bay. This typhoon caused widespread power outages around Chiba that affected up to 560,000 households, which many people still remember hearing about in the news even today.
Next, to learn more about lightning observation data, we will try using its API in a developing environment.
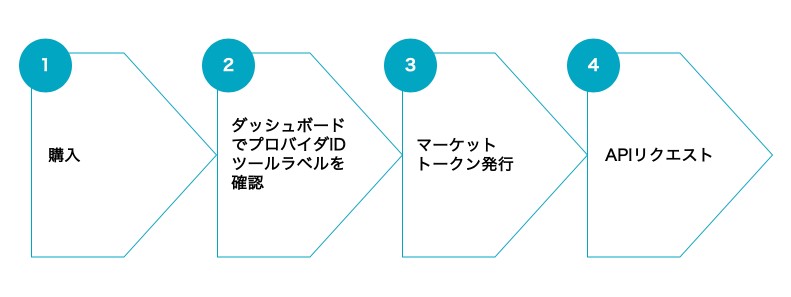
First, purchase the “lightning observation data (free)” on Tellus Market. To execute the Market Token API, it requires an API Access Token. API Access Tokens can be made in the Developing Environment part of the dashboard.
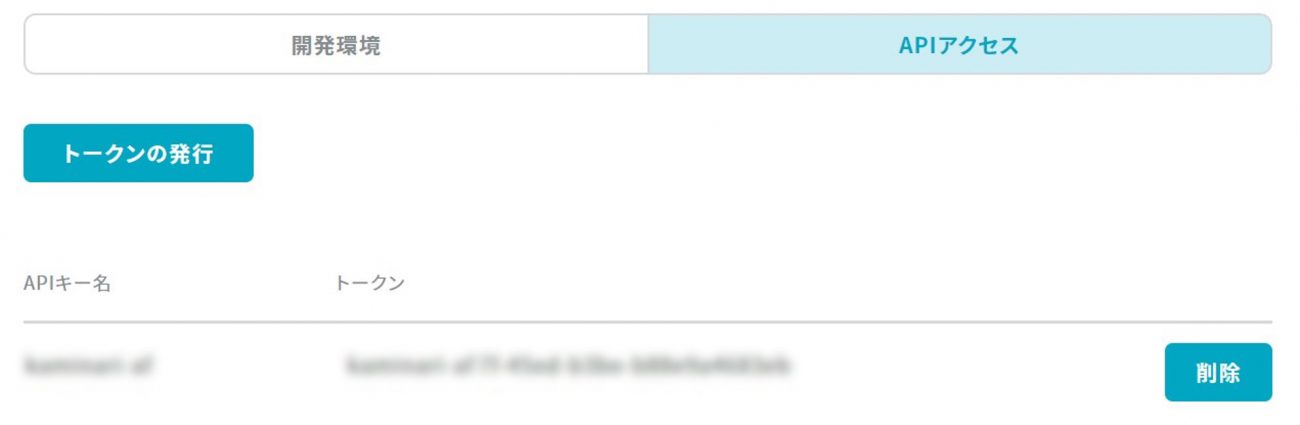
So let’s start with getting a Market Token.
import requests, datetime, json

TOKEN = '(ご自身で発行したトークンを入力してください)'
provider_id = 'shimadzu-bs'
tool_label = 'kaminari-af'

# マーケットトークン有効期限(30分に設定)
# デフォルトでは5分、最長で60分まで設定可能
expires_at = (datetime.datetime.now(datetime.timezone(datetime.timedelta(hours=+9))) + datetime.timedelta(minutes=30)).isoformat()
def get_market_token(payload={}):
    url = 'https://sdk.tellusxdp.com/api/manager/v1/auth/api_access_token/token'
    headers = {
        'Authorization': 'Bearer ' + TOKEN
    }
    r = requests.post(url, headers=headers, data=json.dumps(payload))
    if r.status_code is not 200:
        raise ValueError('status error({}).'.format(r.status_code))
    return json.loads(r.content)

# マーケットトークンを発行する
ret = get_market_token({'provider_id': provider_id, 'tool_label': tool_label, 'expires_at':expires_at})
Using our newly acquired market token, we can finally send requests for the API data. This article requests data from 8:00 PM on Sep. 10, 2019, and has set the filters for cloud to ground lightning in a 30 km radius around Tokyo Station.
import requests
import json
import pyproj

stime = '20190910200000'
etime = '20190910210000'
path= '/tellus/wif82af3w39s/kaminari_af.php'
opt = '?stime='+stime+'&etime='+etime
lat1, lon1 = 35.677716, 139.764805  # 東京駅
within_radius = 30000.0

def exec_api(url, token, payload={}):
    headers = {
        'Authorization': 'Bearer ' + token
    }
    r = requests.get(url, headers=headers, params=payload)
    return r.content

# API実行
executed = exec_api(ret['base_url'] + path + opt, ret['token'], {})

json_data = json.loads(executed)
strike_data = json_data['data']
strike_data2 = [d for d in strike_data if d['attr'] == '対地放電']

grs80 = pyproj.Geod(ellps='GRS80')  # GRS80楕円体

for strike in strike_data2:
    lat2 = float(strike['lat'])
    lon2 = float(strike['lon'])
    azim, bk_azim, distance = grs80.inv(lon1, lat1, lon2, lat2)
    if distance <= within_radius:
        print(lat2, lon2, strike['dtime'], strike['pname'], distance)
35.942 139.753 2019-09-10 20:57:43 越谷市 29343.161596578608
35.684 139.587 2019-09-10 20:57:43 三鷹市 16110.98974075251
35.903 139.832 2019-09-10 20:57:12 吉川市 25723.931017227893
35.87 139.704 2019-09-10 20:56:10 さいたま市 22031.869542933535
35.822 139.674 2019-09-10 20:55:45 蕨市 17992.802471048664
35.614 139.944 2019-09-10 20:55:42 17701.72839120572
35.736 139.466 2019-09-10 20:55:19 小平市 27803.222863210856
35.805 139.785 2019-09-10 20:55:13 足立区 14240.353824900898
35.756 140.03 2019-09-10 20:53:24 船橋市 25519.77742897484This API can only answer requests for about 2,000 lightning strikes at any one time, so if your data goes over 2,000 strikes, try making it small by doing things like shortening the period by 30 minutes until you can see the data.
4. What You Can Do With the Data
What can you do by knowing when and where lightning has struck in the past? Well, how about something like this.
– Finding the cause for broken equipment
The first use that comes to mind is finding out whether lightning is the cause of an accident or not. Let’s say you are managing the maintenance of a network. You would be able to tell instantly whether or not lightning was the reason your equipment broke.
– Mapping out how people move during thunderstorms
You can hide in a building or a car to avoid being struck by lightning when you are outside. By cross reference lightning data with data on where people are moving, you can ascertain how lightning impacts where people go. This data could be useful in deciding where to send taxis when there is heavy rain. This could be further enhanced by adding a search on social media for the keyword “lightning”.
– Picking out where to build new facility and factories
This data could also be used to pick out spots to build a sports facility that may be badly affected by thunderstorms, or factories that are vulnerable to lightning.
– Picking out a place to live with your pets
Lightning may be stressful for your beloved pet dog? As remote work grows increasingly more common, for people who can live and work anywhere, choosing a place to live that isn’t stressful for their pet may become a thing.
These are four examples we just whipped up for this article, but there are endless possibilities of how lightning data can be used. Try thinking of some yourself!
5. Summary
This article dived head first into the science behind lightning and its different types, and how they can be observed, and introduced the basics of how to view lightning observation data on Tellus.
For many people, this may be their first time ever seeing lightning observation data. This data is available for everyone to access on Tellus OS.
Why not take this chance to play around with the lightning data and see what you can do with it?
Check out the lightning observation data on Tellus
If you purchase data on Tellus Market, you can use the “Lightning Observation Data (free to use)” API and view the lightning data on Tellus OS like we introduced in this article. They are both available for free so please check them out.
There is also a free API called “Precipitation Forecast Data (free to use)” available now.
★Register for Tellus here
参照サイト
■雷の物理とその観測技術、大阪大学牛尾教授 - 日本物理学会