2020年の抱負を叫ぶため、衛星データでやまびこができるポイントを探す!(前編)
やまびこができるポイントを探して叫びたい! ということで、衛星データでやまびこができるポイントを探せるのか、実践してみました。
2022年8月31日以降、Tellus OSでのデータの閲覧方法など使い方が一部変更になっております。新しいTellus OSの基本操作は以下のリンクをご参照ください。
https://www.tellusxdp.com/ja/howtouse/tellus_os/start_tellus_os.html
2020年が始まりましたが、皆様はどのような抱負を掲げましたか? また、誰かにその抱負を話しましたか?
宙畑では今年も「宇宙産業を日本の基幹産業に」をスローガンに皆様に様々な記事をお届けしてまいります!
しかし、多忙な日々の中でついつい新年の抱負を忘れてしまいがち。流されてしまわないように、この想いを叫びたい、思いっきり叫びたい、やまびこが聞こえる場所で。
ということで、今回は衛星データを活用して東京都内でやまびこができる場所を探してみたい! まずはそもそも衛星データでやまびこができるスポットを探せるのか、日本一のやまびこスポットと言われている「ヤッホーポイント」を衛星で確認してみました。
(1)やまびこの仕組み
まずはやまびこがきれいに聞こえる条件について、考えてみましょう。
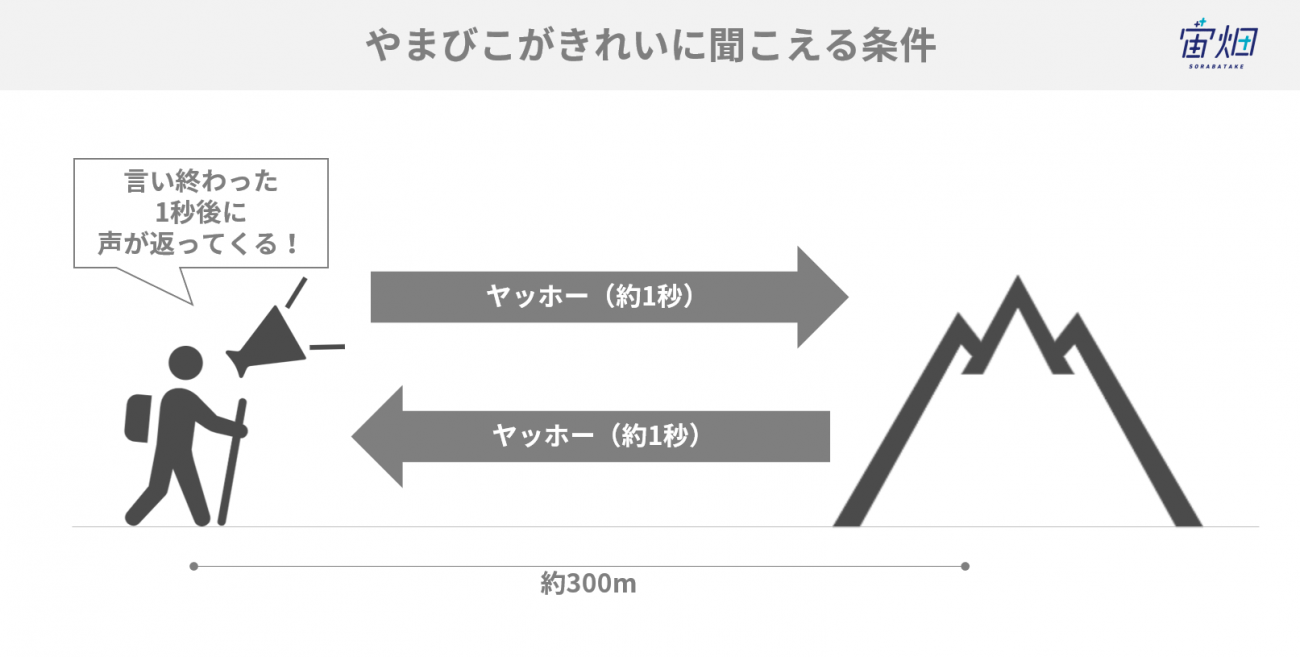
やまびこがきれいに聞こえるには声をぶつける対象物までの距離が大切だと考えられます。
「ヤッホー」という定番のやまびこの叫び声の長さがだいたい1秒弱程度。それに対して、音速が秒速340メートルです。つまり、ヤッホーは1秒で340メートル進むということになります。
「ヤッホー」と叫んだ後、1秒後にやまびこが返ってくるとちょうど綺麗に聞こえるとすると、叫んだ地点から反射する対象までの距離が340メートル程度だと良いということになります。
(2)Tellusでヤッホーポイントを見てみた
実際にやまびこが綺麗に聞こえると言われている場所が、本当に上記条件を満たしているのか、衛星データプラットフォームTellusで見てみました。
探してみると、和歌山県日高川町に日本一と呼ばれる場所があるようです。
以下、日本一の「ヤッホー」ポイントでやまびこをしている動画がありました。
綺麗にやまびこが聞こえていますね。
まずは、ヤッホーポイントから、跳ね返りがある場所までの距離を計ってみましょう。
Tellusでは線の描画をすることで距離を算出できる機能がついており、2点の距離が確認できます。
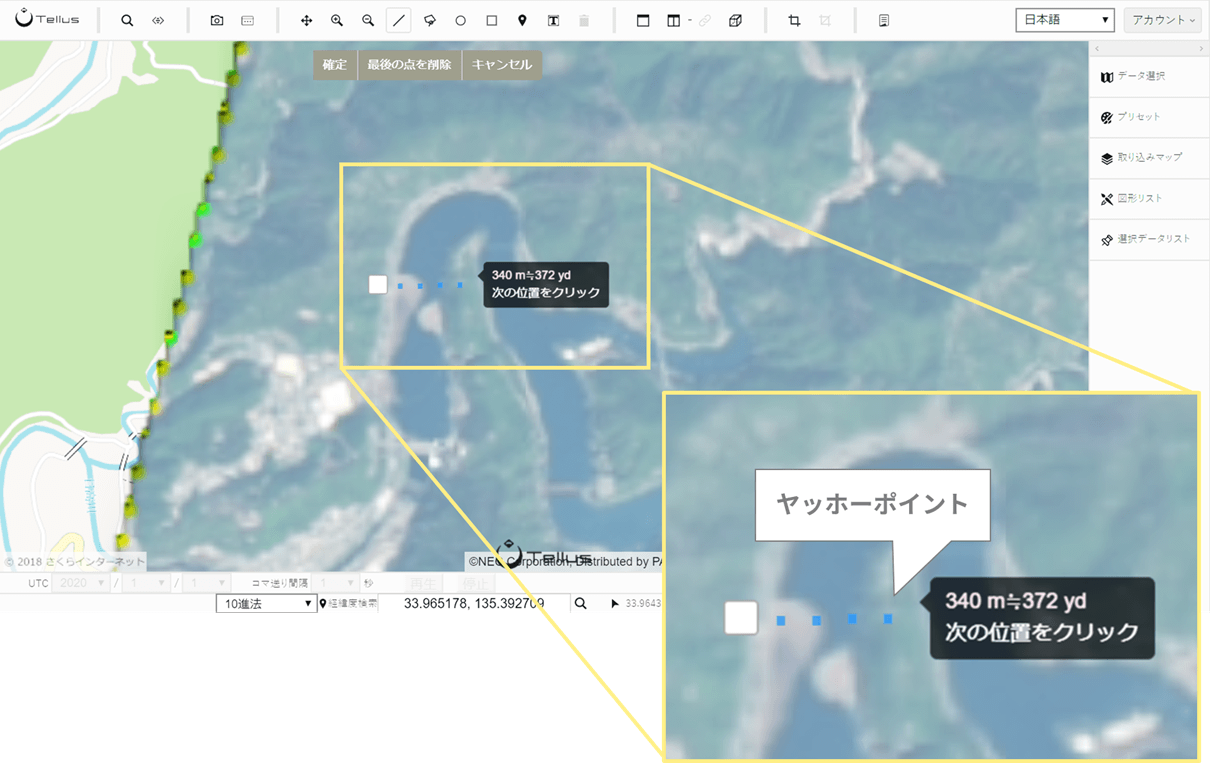
ヤッホーポイントは周囲を川に囲まれた場所にあります。
正確な跳ね返り点は分かりませんが、動画の様子から、川の向こう岸すぐだと推定しました。
測定してみると上記の通り、340メートルで、条件に合致しました。
(3)ヤッホーポイントをさらに詳しく標高データで見てみる
先ほどは真上から見た衛星写真を使っていたため、正確な跳ね返り点が分かりませんでした。
もう少し詳しく跳ね返り点を調査するため、衛星で取得した標高データで確認することにしました。
今回は「Tellusで標高の高い山の森林限界を可視化してみた」でご紹介した標高データを見るコードと同様のものを用います。
import requests, json
from skimage import io
from io import BytesIO
import numpy as np
import math
import matplotlib.pyplot as plt
%matplotlib inline

TOKEN = '自分のトークン'

def get_astergdem2_dsm(zoom, xtile, ytile):
    """
    ASTER GDEM2 の標高タイルを取得

    Parameters
    ----------
    zoom : str
        ズーム率
    xtile : str
        座標X
    ytile : number
        座標Y
    Returns
    -------
    img_array : ndarray
        標高タイル(PNG)
    """
    url = " https://gisapi.tellusxdp.com/astergdem2/dsm/{}/{}/{}.png".format(zoom, xtile, ytile)
    headers = {
        "Authorization": "Bearer " + TOKEN
    }

    r = requests.get(url, headers=headers)
    return io.imread(BytesIO(r.content))

# ヤッホーポイントが存在しているタイル座標を指定
z = 12
x = 3588
y = 1636
gdem_img = get_astergdem2_dsm(z, x, y)

def get_landsat_tile_path_from_scene_id(id):
    """
    Landsat-8のシーンIDから、バンド別合成画像APIで使用するパスを取得する

    Parameters
    ----------
    id : str
        シーンID
    Returns
    -------
    path : str
        APIパス文字列
    """
    url = "https://gisapi.tellusxdp.com/api/v1/landsat8/get_scene/{}".format(id)
    headers = {
        "content-type": "application/json",
        "Authorization": "Bearer " + TOKEN
    }

    r = requests.get(url, headers = headers)
    data = json.loads(r.content.decode('utf-8'))
    return data["tile_path"]

def get_landsat_image(scene_id, zoom, xtile, ytile, opacity=1, r=4, g=3, b=2, preset=None):
    """
    Landsat-8のバンド別合成画像を取得する

    Parameters
    ----------
    scene_id : str
        シーンID
    zoom : str
        ズーム率
    xtile : str
        座標X
    ytile : number
        座標Y
    opacity : number
        透過率
    r : number
        Redに割り当てるバンド
    g : number
        Greenに割り当てるバンド
    b : number
        Blueに割り当てるバンド
    preset : str
        使用するプリセット
    Returns
    -------
    img_array : ndarray
        バンド別合成画像タイル(PNG)
    """
    host = "https://gisapi.tellusxdp.com"
    path = "/blend/" + get_landsat_tile_path_from_scene_id(scene_id).format(z=zoom, x=xtile, y=ytile)
    queries = "?opacity={}&r={}&g={}&b={}".format(opacity, r, g, b)
    if preset is not None:
        queries += "&preset=" + preset
    url = host + path + queries

    headers = {
        "content-type": "application/json",
        "Authorization": "Bearer " + TOKEN
    }

    r = requests.get(url, headers=headers)

    return io.imread(BytesIO(r.content))

scene_id = "LC81100362018103LGN00"
natural_img = get_landsat_image(scene_id, z, x, y, preset="true")

io.imshow(natural_img)
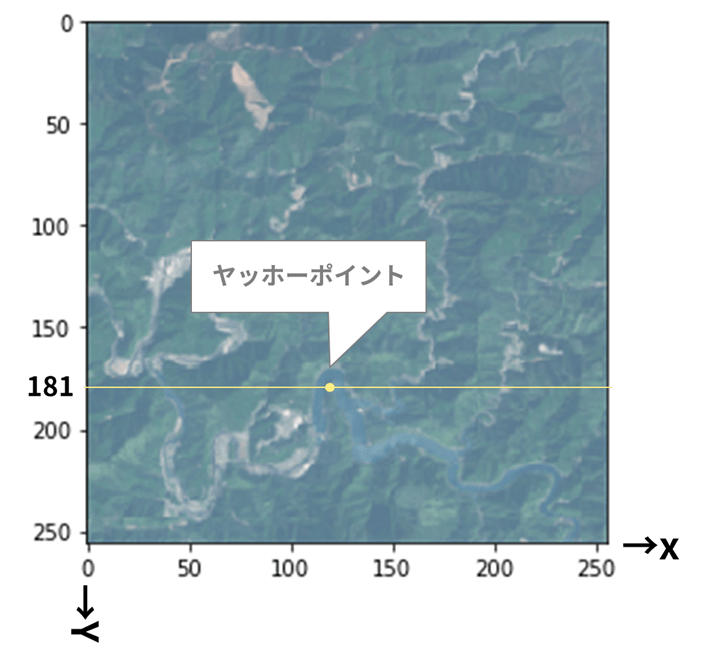
ヤッホーポイントは図中の黄色い点なので、X軸方向(図中黄線)に標高データを出してみると以下のようになりました。
def get_colors(tile, index, direction, z, x, y, xtile_size=1, ytile_size=1, u=1):
    """
    タイル画像から植生に応じたRGB値を取得する

    Parameters
    ----------
    tile : ndarray
        植生タイル
    index : number
        走査するピクセルのインデックス
    direction : number
        走査方向(0で上から下、1で左から右)
    zoom : number
        ズーム率
    xtile : number
        座標X
    ytile : number
        座標Y
    xtile_size : number
        X方向のタイル数
    ytile_size : number
        Y方向のタイル数
    u : number
        標高分解能[m](デフォルト 1.0[m])
    """
    if direction == 0:
        line = tile[:,index]
    else:
        line = tile[index,:]

    colors = []
    colors_err = []
    for k in range(len(line)):
        R = line[k,0]
        G = line[k,1]
        B = line[k,2]
        try:
            colors.append([R, G, B, u])
        except ValueError as e:
            colors.append([0,0,0,0])
            colors_err.append((i,j))
    return colors

def get_tile_bbox(zoom, topleft_x, topleft_y, size_x=1, size_y=1):
    """
    タイル座標からバウンダリボックスを取得
    https://tools.ietf.org/html/rfc7946#section-5
    """
    def num2deg(xtile, ytile, zoom):
        # https://wiki.openstreetmap.org/wiki/Slippy_map_tilenames#Python
        n = 2.0 ** zoom
        lon_deg = xtile / n * 360.0 - 180.0
        lat_rad = math.atan(math.sinh(math.pi * (1 - 2 * ytile / n)))
        lat_deg = math.degrees(lat_rad)
        return (lon_deg, lat_deg)

    right_top = num2deg(topleft_x + size_x , topleft_y, zoom)
    left_bottom = num2deg(topleft_x, topleft_y + size_y, zoom)
    return (left_bottom[0], left_bottom[1], right_top[0], right_top[1])

def calc_height_chiriin_style(R, G, B, u=100):
    """
    標高タイルのRGB値から標高を計算する
    """
    hyoko = int(R*256*256 + G * 256 + B)
    if hyoko == 8388608:
        raise ValueError('N/A')
    if hyoko > 8388608:
        hyoko = (hyoko - 16777216)/u
    if hyoko < 8388608:
        hyoko = hyoko/u
    return hyoko


def plot_height(tile_gdem, tile_natural, index, direction, z, x, y, xtile_size=1, ytile_size=1, u=1):
    """
    高度のグラフをプロットする

    Parameters
    ----------
    tile_gdem : ndarray
        標高タイル
    tile_natural : ndarray
        natural画像タイル
    bbox : object
        標高タイルのバウンディングボックス
    index : number
        走査するピクセルのインデックス
    direction : number
        走査方向(0で上から下、1で左から右)
    zoom : number
        ズーム率
    xtile : number
        座標X
    ytile : number
        座標Y
    xtile_size : number
        X方向のタイル数
    ytile_size : number
        Y方向のタイル数
    u : number
        標高分解能[m](デフォルト 1.0[m])
    """

    bbox = get_tile_bbox(z, x, y, xtile_size, ytile_size)
    width = abs(bbox[2] - bbox[0])
    height = abs(bbox[3] - bbox[1])
    if direction == 0:
        line = tile_gdem[:,index]
        per_deg = -1 * height/tile_gdem.shape[0]
        fixed_deg = width/tile_gdem.shape[1] * index + bbox[0]
        deg = bbox[3]
        title = 'height at {} degrees longitude'.format(fixed_deg)
    else:
        line = tile_gdem[index,:]
        per_deg = width/tile_gdem.shape[1]
        fixed_deg = -1 * height/tile_gdem.shape[0] * index + bbox[3]
        deg = bbox[0]
        title = 'height at {} degrees latitude'.format(fixed_deg)

    heights = []
    heights_err = []
    degrees = []
    for k in range(len(line)):
        R = line[k,0]
        G = line[k,1]
        B = line[k,2]
        try:
            heights.append(calc_height_chiriin_style(R, G, B, u))
        except ValueError as e:
            heights.append(0)
            heights_err.append((i,j))
        degrees.append(deg)
        deg += per_deg

    fig, ax= plt.subplots(figsize=(8, 4))

    colors = np.array(get_colors(tile_natural, index, direction, z, x, y)) / np.array([255, 255, 255, 1])
    plt.title(title)
    plt.scatter(degrees, heights, s=20,c=colors)
    ax.text(0.01, 0.95, 'Errors: {}'.format(len(heights_err)), transform=ax.transAxes)
    plt.show()

plot_height(gdem_img, natural_img, 181, 1, z, x, y)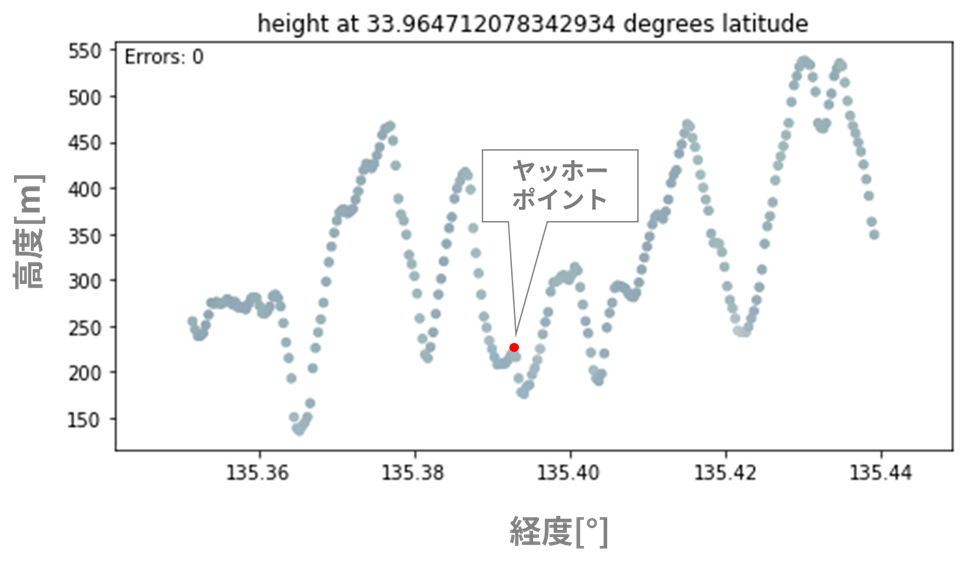
周囲を山に囲まれていることがよくわかります。
今回のポイントをよく見るために拡大すると以下のようになります。
def get_colors(tile, index, direction, z, x, y, xtile_size=1, ytile_size=1, u=1):
    """
    タイル画像から植生に応じたRGB値を取得する

    Parameters
    ----------
    tile : ndarray
        植生タイル
    index : number
        走査するピクセルのインデックス
    direction : number
        走査方向(0で上から下、1で左から右)
    zoom : number
        ズーム率
    xtile : number
        座標X
    ytile : number
        座標Y
    xtile_size : number
        X方向のタイル数
    ytile_size : number
        Y方向のタイル数
    u : number
        標高分解能[m](デフォルト 1.0[m])
    """
    if direction == 0:
        line = tile[:,index]
    else:
        line = tile[index,:]

    colors = []
    colors_err = []
    for k in range(len(line)):
        R = line[k,0]
        G = line[k,1]
        B = line[k,2]
        try:
            colors.append([R, G, B, u])
        except ValueError as e:
            colors.append([0,0,0,0])
            colors_err.append((i,j))
    return colors

def get_tile_bbox(zoom, topleft_x, topleft_y, size_x=1, size_y=1):
    """
    タイル座標からバウンダリボックスを取得
    https://tools.ietf.org/html/rfc7946#section-5
    """
    def num2deg(xtile, ytile, zoom):
        # https://wiki.openstreetmap.org/wiki/Slippy_map_tilenames#Python
        n = 2.0 ** zoom
        lon_deg = xtile / n * 360.0 - 180.0
        lat_rad = math.atan(math.sinh(math.pi * (1 - 2 * ytile / n)))
        lat_deg = math.degrees(lat_rad)
        return (lon_deg, lat_deg)

    right_top = num2deg(topleft_x + size_x , topleft_y, zoom)
    left_bottom = num2deg(topleft_x, topleft_y + size_y, zoom)
    return (left_bottom[0], left_bottom[1], right_top[0], right_top[1])

def calc_height_chiriin_style(R, G, B, u=100):
    """
    標高タイルのRGB値から標高を計算する
    """
    hyoko = int(R*256*256 + G * 256 + B)
    if hyoko == 8388608:
        raise ValueError('N/A')
    if hyoko > 8388608:
        hyoko = (hyoko - 16777216)/u
    if hyoko < 8388608:
        hyoko = hyoko/u
    return hyoko


def plot_height(tile_gdem, tile_natural, index, direction, z, x, y, xtile_size=1, ytile_size=1, u=1):
    """
    高度のグラフをプロットする

    Parameters
    ----------
    tile_gdem : ndarray
        標高タイル
    tile_natural : ndarray
        natural画像タイル
    bbox : object
        標高タイルのバウンディングボックス
    index : number
        走査するピクセルのインデックス
    direction : number
        走査方向(0で上から下、1で左から右)
    zoom : number
        ズーム率
    xtile : number
        座標X
    ytile : number
        座標Y
    xtile_size : number
        X方向のタイル数
    ytile_size : number
        Y方向のタイル数
    u : number
        標高分解能[m](デフォルト 1.0[m])
    """

    bbox = get_tile_bbox(z, x, y, xtile_size, ytile_size)
    width = abs(bbox[2] - bbox[0])
    height = abs(bbox[3] - bbox[1])
    if direction == 0:
        line = tile_gdem[:,index]
        per_deg = -1 * height/tile_gdem.shape[0]
        fixed_deg = width/tile_gdem.shape[1] * index + bbox[0]
        deg = bbox[3]
        title = 'height at {} degrees longitude'.format(fixed_deg)
    else:
        line = tile_gdem[index,:]
        per_deg = width/tile_gdem.shape[1]
        fixed_deg = -1 * height/tile_gdem.shape[0] * index + bbox[3]
        deg = bbox[0]
        title = 'height at {} degrees latitude'.format(fixed_deg)

    heights = []
    heights_err = []
    degrees = []
    for k in range(len(line)):
        R = line[k,0]
        G = line[k,1]
        B = line[k,2]
        try:
            heights.append(calc_height_chiriin_style(R, G, B, u))
        except ValueError as e:
            heights.append(0)
            heights_err.append((i,j))
        degrees.append(deg)
        deg += per_deg

    fig, ax= plt.subplots(figsize=(8, 4))

    colors = np.array(get_colors(tile_natural, index, direction, z, x, y)) / np.array([255, 255, 255, 1])
    plt.title(title)
    plt.scatter(degrees, heights, s=20,c=colors)
    ax.text(0.01, 0.95, 'Errors: {}'.format(len(heights_err)), transform=ax.transAxes)
    plt.xlim(135.38,135.40)
    plt.show()
plot_height(gdem_img, natural_img, 181, 1, z, x, y)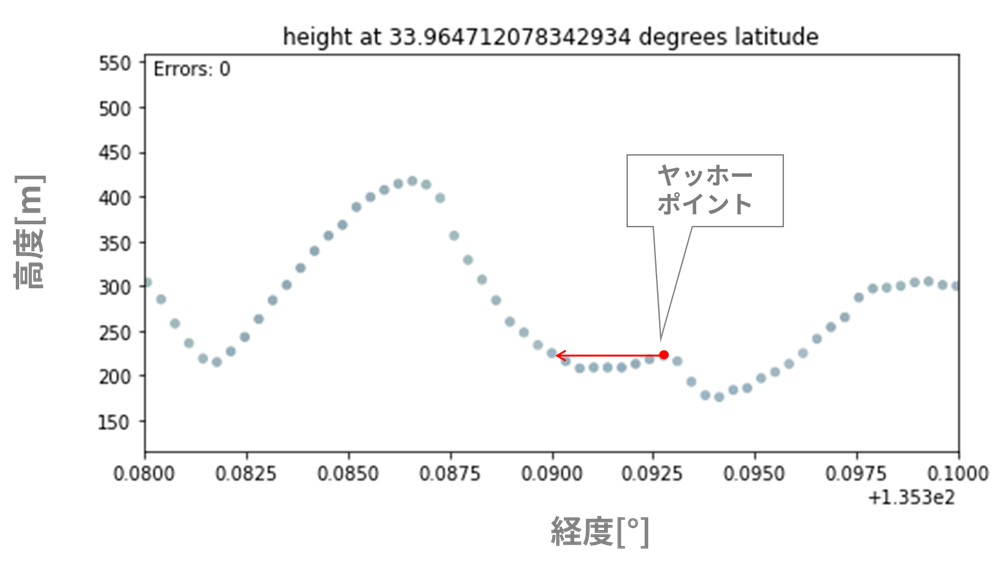
赤点で示したヤッホーポイントから、西側へ0.0025°行った場所がちょうど同じ標高くらいです。
これを距離に換算すると250m程度になります。先ほど仮定した条件に遠からず、といったところでしょうか。
(4)衛星データでやまびこポイントを見つける方法
やまびこができる場所の条件が分かったところで、やまびこポイントを見つける方法を考えて見ます。
ステップは以下の通りです。
(1)近所で山あり谷ありな場所の当てをつける
(2)Google Mapで該当する場所の中で人が立ち入れて叫べそうなポイントを見つける
(3)衛星から取得する標高データで、(2)の地点と標高が同じで2点の距離が300メートルのポイントを見つける
次回は、この手順でやまびこポイントを見つけてみたいと思います。
(5)まとめ
今回は和歌山県のやまびこができるとすでに分かっているポイントについて衛星データで確認してみました。
日本は、国土の約7割を山地が占める国。きっと読者の皆さんの近所の山々にもやまびこが綺麗に返ってくるポイントが見つかるはずです。ぜひ試してみてください。
※危険な場所である可能性があるため、実際に訪れる場合は、人が安全に、そして誰でも入れる場所があるのかは必ず確かめてからお願いいたします。
では、これから高尾山のやまびこができるポイントを探しだし、2020年の抱負を叫んできます。